THE EFFECTS OF HIGH TEMPERATURES
ON ROACH {RUTILUS RUTILUS)
I. THE EFFECTS OF CONSTANT HIGH TEMPERATURES
BY ANTHONY W. COCKING*
Department of Zoology, King's College, London, W.C. 2
(Received 14 August 1958)
INTRODUCTION
The thermal relations of fishes have been much investigated in Canada and terms describing various states have been defined by Fry and his colleagues from their own observations (Brett, 1941, 1944, 1946; Fry, Brett & Clawson, 1942; Fry, Hart & Walker, 1946; Fry, 1947; Hart, 1947, 1952; Black, 1953) and from the earlier work of Hathaway (1927) and Loeb & Wasteneys (1912).
The temperature relations of British fishes are not very well understood and the available information mainly concerns growth and development (Audige, 1921; Gray, 1928; Wood, 1932; Brown, 1946, 1951). Cocking (1957), however, showed that the temperature range for good health in the roach is curtailed 4 or 50 C. below the ultimate upper lethal temperature for the species.
This study was designed to provide reliable figures for the upper lethal tem-peratures and the thermal tolerance for a common British fish. The roach was chosen because it is a ' coarse' fish that is very common in the lowland reaches of rivers where pollution is most frequent and because Hartley (1947) had investigated its natural history. Particular attention was paid to its behaviour because although death has often been used as the criterion of the effectiveness of pollution (Fry et al. 1946; Wuhrmann, 1952; Downing, 1954), nobody has described the behaviour of the dying fish or tried to relate this to the lethal factors involved. Wells (1914) and Rubin (1935) both reported that fish become more active at high temperatures and this must affect the fish's chance of survival.
Winterstein (1908) reported that the asphyxial concentration of oxygen of 'Rutilus' at room temperature was 0-4 ml./l., but it is not clear whether these fish were roach or rudd. The ability to withstand low concentrations of oxygen at high temperatures must be of survival value in polluted habitats, so this investigation included estimations of the asphyxial tensions of oxygen of the roach at 30 and 32° C. Poor condition in the experimental fish is often an important unknown factor in fish physiology. Difficulty in keeping fish healthy (Wells, 1935; Job, 1955) may lead to difficulty in acclimatizing them properly (Hart, 1952). The aim of keeping the fish in first-class condition for the experiments and keeping them in the laboratory at known temperatures was realized; the temperature history of some of the fish used in the tests was known to within ± o-i° C. for more than 3 months.
204 ANTHONY W. COCKING
Definition of terms
The terms used are those defined by Fry et al. 1946.
Below and above the acclimatization temperature, i.e. the temperature at which the fish have been kept for at least a week, is the zone of tolerance, which contains all temperatures at which over 50% of the fish can live indefinitely. The zone of tolerance is bounded by upper and lower incipient lethal temperatures, which are the temperatures at which 50 % of the fish die within a week. Above the upper incipient and below the lower incipient lethal temperatures are zones of resistance, which include all temperatures at which more than 50% of the fish will die. The time taken to die decreases as the difference between the acclimatization temperature and the temperature to which the fish are transferred increases. The temperature in the zone of resistance at which all the fish die within 10 min. is the temperature of instantaneous death. Raising the acclimatization temperature raises the upper incipient lethal temperature until the ultimate upper lethal temperature for the species is reached, i.e. the highest upper incipient lethal temperature that cannot be increased by raising the acclimatization temperature. Similarly, lowering the acclimatization temperature lowers the lower incipient lethal temperature until the ultimate lower lethal temperature is reached.
MATERIALS
[image:2.451.56.401.397.498.2]The tests were done in a tank room designed to provide constant environmental conditions for growing or acclimatizing fish. Brown (1951) has described an earlier model which resembles the present one in all essentials.
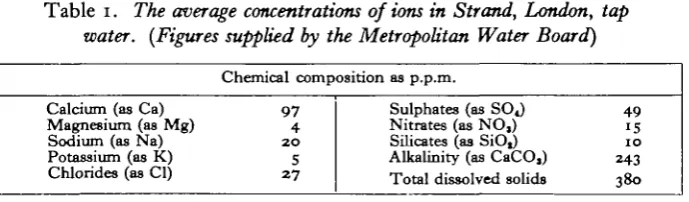
Table 1. The average concentrations of ions in Strand, London, tap water. (Figures supplied by the Metropolitan Water Board)
Chemical composition as p.p.m.
Calcium (as Ca) 97 Magnesium (as Mg) 4 Sodium (as Na) 20 Potassium (as K) 5 Chlorides (as Cl) 27
Sulphates (as SOJ Nitrates (as NO,) Silicates (as SiOj) Alkalinity (as CaCO,) Total dissolved solids
49
15
1 0
243 3 8 0
Strand (London) tap water is very hard and contains unusually high concentra-tions of chloride, sulphate and nitrate ions (Table 1). From November to May it passed through a charcoal filter before entering the tanks to remove possible traces of free chlorine and chloramines. The tanks received 12 hr. of light daily from 20 W., fluorescent, 'Daylight' tubes. During the other 12 hr. each day the tanks were in complete darkness.
of various ages. The effect of transfer from soft Tarn Hows water (total dissolved solids about 40 p.p.m.) to hard Strand tap water (total dissolved solids about 380 p.p.m.) may have produced a slight increase in resistance to high temperatures (Halsbrand, 1953) but this was not investigated.
A week after arrival, when the fish were feeding, the temperature was raised to the acclimatization temperature at a rate not exceeding i° C. a day and the fish were acclimatized for as long as possible. The fish were kept at 20° C. as a basic acclimatization temperature and were then held for at least a week at the experi-mental acclimatization temperature. The fish were given as much minced liver as they would eat five or six times a week and lettuce leaves three or four times a week.
METHODS
I investigated the survival times at constant lethal temperature by the method used by Fry et al. (1946) to investigate the thermal relations of Salvelinus
fontinaiis.
Roach were acclimatized to 17, 20, 23, 26 and 300 C. for periods up to 3 months and then moved quickly to higher lethal temperatures. The jump in temperature was instantaneous to avoid further acclimatization and the tests were carried on for up to 36 hr. Fish were also acclimatized to 32 and 33° C. but they lost condition rapidly at these temperatures which were maintained for only a few days. When tested at higher temperatures, these fish took up to 4 days to die and, as it was impossible to maintain constant watch over this period of time, no median survival times could be calculated, though the upper incipient lethal temperature was estimated in each case. The fish were starved for 24 hr. before being caught and put into the test tank. Eight fish were used in each test except when acclimatized to 30, 32 and 330 C. when only five fish were used. The test tank was a standard 50 1. tank, stirred and aerated by compressed air, with water flowing through and the temperature controlled to within ±o-i° C.
The criterion of death was that opercular movements, which persisted after the fish was unable to swim, had stopped; if the fish were removed before this stage, it would often recover. Sumner & Doudoroff (1938) using the cessation of respiratory movements as the criterion of death in Gillichthys, found that this fish sometimes recovered when placed in cooler water. In the present tests only one out of all the fish tested recovered when placed in cooler water, so the determination of the death point was an accurate or conservative estimate.
The time of death of each fish was recorded and the fish was then weighed, measured from the tip of the snout to the fork of the tail and opened to determine sex, to see if the heart was still beating and to examine the other organs. Notes were kept of the behaviour of the fish and in many cases individuals were watched con-tinuously from being put into the tank to dying.
206 ANTHONY W. COCKING
temperature. Water, saturated with oxygen at the experimental temperature, flowed through the container overnight to allow the fish to recover from catching and handling before the flow was stopped. The dissolved oxygen and total ammonia concentrations, alkalinity and pH were measured just before stopping the flow through the container and immediately after the fish had rolled over, and from these measurements the dissolved oxygen, free ammonia and carbon dioxide concentra-tions could be calculated. The asphyxiated fish was weighed and put into well-aerated water to see if it would recover.
Throughout all experiments temperature was measured to the nearest o-i° C. Oxygen was estimated by unmodified Winkler's technique. At high temperatures, in spite of tight fitting stoppers, small bubbles of air (about o*i ml.) were drawn in as the sample cooled. This was prevented by submerging the bottles in boiled-out water; the small volume of water drawn in contained a negligible quantity of oxygen. Carbon dioxide was estimated graphically (Moore, 1939) from measure-ments of pH, alkalinity and temperature. Ammonia was estimated photo-electrically using Nessler's reagent and a Hilger 'Spekker*. Only free ammonia affects fish (Wuhrmann, 1952) and the concentration was calculated from the total ammonia, pH, temperature and total dissolved solids (Downing, personal communication). Alkalinity (equivalent to carbonate hardness) was measured by titrating O-IN-hydrochloric acid against 25 ml. of water, using B.D.H. ' ^ s * indicator. Total dissolved solids were estimated as recommended by Thresh, Beale & Suckling (1949). The pH was measured on a Cambridge bench-type pH meter. The instru-ment was compensated for temperature and the buffers used for calibration were kept at the temperature of the water samples.
RESULTS
Survival at constant high temperatures
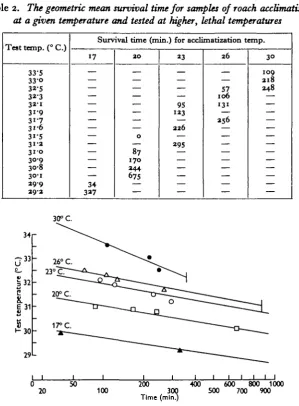
Table 2 shows the mean survival time for roach acclimatized at 17, 20, 23, 26 and 300 C. and tested at higher, lethal temperatures. Following Fry et al. (1946), the geometric mean time has been used. In Fig. i, test temperature is plotted against time, on a semi-log scale. For any acclimatization temperature, the survival time decreases as the test temperature increases and the resistance to any given lethal temperature increases with a rise in acclimatization temperature. The graph makes it possible to estimate the median survival time for a group of fish acclimatized to any of the temperatures shown and tested at a higher temperature. The lines re-presenting tests with fish acclimatized to 26 and 300 C. terminate at vertical lines to the right; beyond these less than 50% of the fish would die. There must be corresponding points on the 23, 20 and 170 C. lines but they are off the graph, to the right.
207
Table 2. The geometric mean survived time for samples of roach acclimatized at a given temperature and tested at higher, lethal temperatures
Test temp. (° C.)
33"5 33-o 3*-5 3 2 3 3 2 1 31-9 3i-7 31-6 3 1 S 3i-3 3 1 0 30-9 30-8 30-1 3 9 9 3 9 a
Survival time (min.) for acclimatization temp.
17 — — — — — — — — — — — — — — 34 337 2 0 — — — — — — — 0 — 87 170 3 4 4 675 — — 33 — — — 95 133 — 2 3 6 39S — — 26 57 106 131 — 2 5 6 — — — — — — — — 3 0 109 2 1 8 248 — — — — — — — — — — — — — 30° C.
3 4 r
U3 3
E 31
•30
29L - 23'
20 SO 100 200 300
Time (min.)
400 600 800 1000
500 700 900
Fig. 1. Median survival time of roach at constant lethal temperatures when acclimatized to 17, ao, 23, 36 and 300 C. Plotted on semi-log scale. Drawn from data in Table 1. Figures above lines—acclimatization temperature. T o the right of the vertical lines less than 50 % of a sample would die.
temperature for instantaneous death which marks the upper limit of the zone of resistance.
2O8 ANTHONY W. COCKING
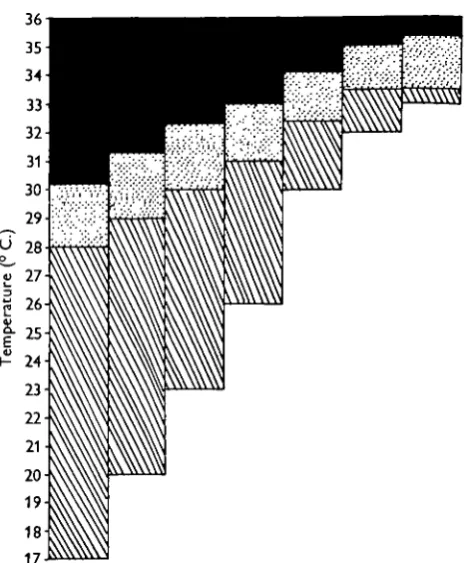
Fig. 2. Diagram showing the thermal relations of roach when acclimatized to 17, 20, 23, 26, 30, 32 and 330 C. Cross-hatched—zone of tolerance; dotted—zone of resistance; black—tempera-tures at which death is instantaneous. The zone of resistance is limited below by a horizontal line representing the upper incipient lethal temperature and above by a line representing the temperature for instantaneous death. The lower horizontal line limiting the zone of tolerance represents the acclimatization temperature.
Thermal tolerance
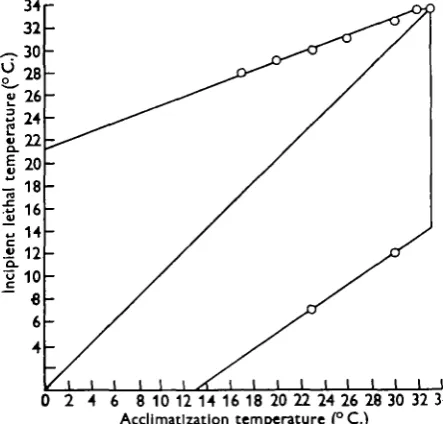
Figure 3 shows the thermal tolerance of the roach in the way originally adopted by Fry et al. (1942) for year-old goldfish. The lower incipient lethal temperatures for roach acclimatized to 30 and 230 C. were estimated so that the thermal tolerance could be calculated.
above the freezing point of water, the lower lethal line would become horizontal and cut the 45-degree line to the left, but it is probable that the ultimate lower lethal temperature of the roach is about o° C. and this has been assumed in constructing the diagram. The area contained by the two axes, the upper and lower lethal lines and the perpendicular therefore represents all the thermal variations that roach can tolerate indefinitely. This area equals the thermal tolerance of roach and is 770 square units. The upper incipient lethal temperature of roach increases by about i° C. for each 30 C. rise in acclimatization temperature. Brett (1944) found a similar relationship between upper incipient lethal temperature and acclimatiza-tion temperature in the goldfish and Ameiurus.
34 32
« 26
1
24
I 20
ti 16 "3 14
10
e
6
4
i i i i i i I i i i
[image:7.451.114.336.218.430.2]0 2 4 6 8 10 12 14 16 18 20 22 24 26 28 30 32 34 Acclimatization temperature (°C.)
Fig. 3. The thermal tolerance of roach (770 units).
Behaviour
Roach living in acclimatization tanks at 200 C. were light, olive green in colour and their breathing was slow and discontinuous. They always formed a shoal at the end of the tank away from the observer a few inches off the bottom; even three or four roach would form a shoal and show no sign of individual territories. They only moved into the upper and middle parts of the tank when fed; when transferred from one tank to another they swam to the bottom and remained still or swam quietly, though for the first few hours after transfer they were easily disturbed.
The behaviour of roach when put into lethal temperatures (Table 3) can be divided into five stages: initial distress, recovery, final distress, loss of control and death. Some of the fish in a test went through the stages more quickly than others and at any moment the tank would contain fish in various stages of distress, recovery and death.
2 I O ANTHONY W. COCKING
Table 3. Behaviour of roach when transferred to constant
higher temperatures
Variation 1: Characteristic of fish acclimatized to 23° C. and above.
Variation 2: Characteristic of fish put into temperatures above the temperature for instantaneous death.
Variation 3: Characteristic of fish tested close to the upper incipient lethal temperature.
Stage Symptoms
Period of no response
Initial distress
Recovery
Final distress
Loss of control
Death
Complete recovery
In upper part of water; rapid glides hitting obsta-cles ; cutting surface; rolling and pitching; breath-ing erratic
Move to bottom; swim more steadily; form shoal; pass air bubbles; defaecate; rapid breathing
Black pattern; leave shoal; move up and down tank; lose depth control when still; bursts of weak jerky swimming towards end
Float on side or back; body stiff but eyes and pectoral fins move; breathing very rapid, shallow and continuous I
Motionless (opercular movements are last to stop) Breathing and colour normal
I
to the top and back to the bottom again. Some fish showed difficulty in main-taining their position in the water by floating upwards when not actively swimming and some passed bubbles of air again, though usually at, or near, the surface of the water. The fish passed gradually from this stage to loss of control, i.e. when they rolled over and could no longer right themselves even if stimulated. Loss of control began as the swimming muscles passed into rigor, resulting in weak, jerky swimming movements with frequent half-rolls. Fish frequently alternated between lying on their sides or on their backs and swimming unsteadily round the tank. When unable to swim they made feeble body movements, but eventually they became unable to move the body at all, even when tapped with a glass rod, though the mouth, opercula, pectoral fins and eyes continued to move. Occasionally the fish would give a violent coughing reflex when the opercula were widely distended, but the last visible movement before death was very shallow breathing. The fish, therefore, died from the posterior end forwards.
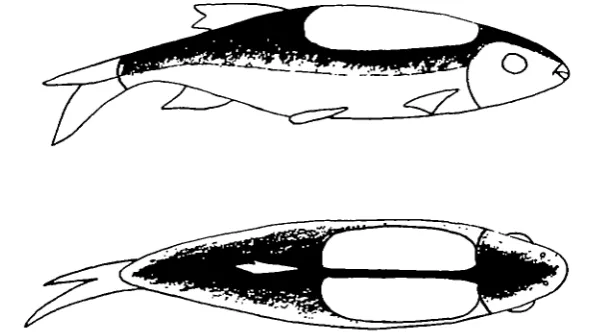
Fig. 4. Diagram showing the lateral and dorsal views of the characteristic black pattern which appeared in the stage of final distress in fish acclimatized to 200 C. and above.
2 1 2 ANTHONY W. COCKING
often possible to tell which fish will die and which will recover since if the charac-teristic black pattern appeared (Fig. 4) the fish invariably died, but uniform darkening usually meant that the fish would eventually recover.
[image:10.451.49.408.232.388.2]When the fish had died, they were opened. In almost every case the heart was still beating and although in some cases the beat was weak and irregular it was often strong and regular. The gall bladder was abnormal, however; in normal roach it is oval and clear light green in colour whereas in test fish it was frequently cloudy and dark green. In fish with long exposures to high temperatures it was black and very large. The black colour was caused by the concentration of bile in the bladder, since when the bile was examined in a strong light in a fine pipette it was clear but a very dark green.
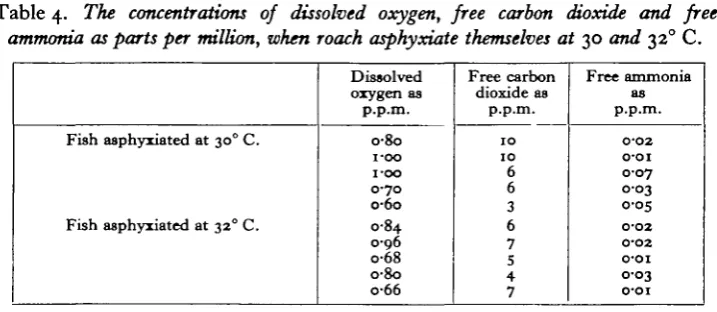
Table 4. The concentrations of dissolved oxygen, free carbon dioxide and free ammonia as parts per million, when roach asphyxiate themselves at 30 and 320 C.
Fish asphyxiated at 300 C.
Fish asphyxiated at 320 C.
Dissolved oxygen as p.p.m. o-8o i-oo i-oo 0-70 o-6o 0-84 0-96 o-68 o-8o o-66 Free carbon dioxide as p.p.m. 1 0 1 0 6 6 3 6 7 5 4 7 Free ammonia as p.p.m. 0-02 o-oi 0-07 0-03 0-05 O-O2 0-O2 O-OI 0-03 o-oi
The asphyxial concentration of oxygen
Table 4 shows the concentrations of oxygen, free ammonia and free carbon dioxide at the time of asphyxiation for roach at 30 and 320 C.
At 300 C. the range of asphyxial concentrations of oxygen is 0-60-1-00 mg./l. (mean 0-82 mg./l.) and at 320 C. it is 0-66-0-96 mg./l. (mean 0-79 mg./l.). The ranges and the means are, therefore, very similar. At 320 C. none of the fish re-covered when transferred to well-aerated water, but at 300 C. three out of five recovered.
DISCUSSION
It is difficult to compare the thermal relations of roach with those of other British fish because the latter have not been measured. It is clearly more eurythermal than brown trout, Salmo trutta, which will not grow above 210 C. (Brown, 1946), which probably have an upper lethal temperature of about 250 C. and which have a high mortality rate when reared from the egg at 150 C. (Gray, 1928). Brook trout, Salvelinus fontmaUs, have an ultimate upper lethal temperature of 25-3° C. and a thermal tolerance of 625 units (for Canadian fish) and are probably more steno-thermal than Salmo trutta. The roach is probably more eurysteno-thermal than the minnow, Phoxinus phoxmus. Fortune (1955) reported that minnows died in tap water at temperatures above 230 C. but this observation needs verification, since Barrington & Matty (1954) kept Phoxmus at 260 C. and the ultimate upper lethal temperature is probably about 300 C. Since Perca flavescms and P. fluviatiUs are closely allied it is possible that the British perch and roach have similar thermal limits.
The results of the temperature-time experiments (Fig. 2) lead to two con-clusions of importance in nature. First, fish will not be killed by a sudden rise in temperature, providing the increase does not take the fish out of the zone of tolerance for the particular acclimatization temperature. Roach acclimatized to 170 C. can withstand an instantaneous jump of io° C. without dying and they will be able to survive an even greater jump from water colder than 170 C , since the size of the zone of tolerance increases with decrease in acclimatization temperature (Fig. 2). If the relationship between increase in acclimatization and upper incipient lethal temperatures (i° C. rise in upper incipient lethal temperature for each 30 C. rise in acclimatization temperature) holds over the whole thermal range of the species, the zone of tolerance should increase by about 2° C. for each 30 C. fall in acclimatization temperature. Secondly, even if the temperature rises instan-taneously to a lethal level (i.e. in the zone of resistance) the fish will survive for a length of time that is a function of the increase in temperature. Roach acclima-tized to 200 C. can survive water at 31° C. for a median time of 87 min. and this would give them time in nature to move to cooler water or would allow them to survive if the increase in temperature were only temporary. Under natural con-ditions, therefore, roach should be most susceptible to a sharp rise in temperature when they are already living near their ultimate upper lethal temperature, but it is difficult to correlate fish kills in nature with temperature, because temperature effects are complicated by the effects of temperature-dependent factors. These results do not mean, however, that fully acclimatized roach can live indefinitely at high sublethal temperatures. When kept at 300 C. for long periods, roach lose condition rapidly and die (Cocking, 1957). Long exposures at temperatures 3-40 C. below the ultimate upper lethal temperatures are, therefore, harmful and result in a loss of condition which would damage a natural population.
The behaviour of roach in constant lethal temperatures depends on the size of the jump in temperature to which the fish are subjected. At temperatures near the upper incipient lethal temperature roach show distress but subsequently recover. At higher temperatures the fish are unable to adjust themselves and die in a
214 ANTHONY W. COCKING
characteristic manner, i.e. from the posterior end forwards. Sumner & Doudoroff (1938) noted that GiUichthys died in a similar manner at high temperatures and in potassium cyanide solutions, boiled sea water and anaesthetics. The hearts of the roach were still beating when the body cavities were opened after death. The work of Vernon (1899) and Battle (1926) suggests that heart muscle is more sensitive to heat than skeletal muscle. Since the heart beat was sometimes abnormal, however, it is possible that the heart had stopped and it started to beat again when the fish cooled on being taken out of water and the body cavity opened.
The asphyxial concentrations of oxygen of roach (Table 4) are some of the lowest recorded for any species and confirm Winterstein's (1908) results. A low asphyxial tension implies that a species must have a blood of low loading tension and it is possible that the roach, like the carp (Nicloux, 1923), uses its haemoglobin only when in water of very low oxygen concentrations or when very active. The asphyxial concentrations at 30 and 32° C. apply only to fish acclimatized to those tempera-tures. Aitken (personal communication) has shown that the% oxygen consumption of roach muscles from fish acclimatized to io° C. was much higher at 200 C. than the oxygen consumption of muscles from fish acclimatized to 200 C. Wells (1935) also showed that acclimatization to high temperatures involves a proportionate reduction in metabolic rate. Since the asphyxial concentration of fish depends, in part, on the metabolic rate, the asphyxial concentration of roach at 300 C. following a sudden rise in temperature would be higher than o-8 mg./l., the amount measured for roach acclimatized to that temperature.
SUMMARY
1. The temperature at which 50 % of a sample of roach {Rutilus rutilus) die within a week cannot be raised above 33-5° C. by raising the acclimatization temperature.
2. The roach is about as eurythermal as the yellow perch {Perca flavescens). 3. The mean asphyxial concentration of oxygen at 30 and 320 C. is approximately o-8 mg./l.
4. Median survival time at any lethal temperature increases with increase in acclimatization temperature; survival time for any acclimatization temperature decreases as test temperature increases; the temperature at which 50 % of a sample die within a week rises by about i° C. for each 30 C. rise in acclimatization temperature.
5. The behaviour, on transfer to higher temperatures, depends on the acclimatiza-tion temperature and the size of the jump in temperature and can be divided into five characteristic stages.
6. Dying fish develop a black pattern; myotomic swimming muscles die first and opercular muscles last. The heart was still beating when the fish were opened but the gall bladder was abnormal.
REFERENCES
AUDIGE, M. P. (1921). Sur la croissance des poissons maintenus en milieu de temperature constante.
CJi. Acad. Set., Paris, 173, 287-9.
BARRINGTON, E. J. W. & MATTY, A. J. (1954). Seasonal variation in the thyroid gland of the minnow,
Phoxmus phoxinus, L., with some observations on the effect of temperature. Proc. Zool. Soc. Lond. 134, 89-95.
BATTLE, H. I. (1926). Effects of extreme temperatures on muscle and nerve tissue in marine fishes.
Trans. Roy. Soc. Can. V, (3), 30, 127-44.
BLACK, E. C. (1953). Upper lethal temperature of some British Columbia freshwater fishes. J. Fish.
Res. Bd Can. 10, 197-209.
BRETT, J. R. (1941). Tempering versus acclimation in the planting of speckled trout, Salvdinus
fontinalis. Trans. Amer. Fish. Soc. 70, 397-403.
BRETT, J. R. (1944). Some lethal temperature relations of Algonquin Park fishes. Univ. Toronto
Stud. Biol. no. 52, 63, 49 pp. Publ. Ontario Fisheries Research Lab.
BRETT, J. R (1946). Rate of gain of heat tolerance in goldfish, Carassius auratus. Univ. Toronto
Stud. Biol. no. 53, 64, 24 pp. Publ. Ontario Fisheries Research Lab.
BRETT, J. R. (1952). Temperature tolerance in young pacific salmon, genus Oncorkynckus. J. Fish.
Res. Bd Can. 9, 265-309.
BROWN, M. E. (1946). The growth of brown trout (Salmo trutta L.). I. Factors affecting the growth of trout fry. II. The growth of two-year-old trout at a constant temperature of 11 -5° C. III. The effect of temperature on the growth of two-year-old trout. J. Exp. Biol. 33, 118-55. BROWN, M. E. (1951). The growth of brown trout. IV. The effect of food and temperature on the
survival and growth of fry. J. Exp. Biol. 28, 473-91.
COCKING, A. W. (1957). Relation between the ultimate upper lethal temperature and the temperature range for good health in the roach (Rutilus rutilus). Nature, Lond., 180, 661-2.
DOWNING, K. M. (1954). The influence of dissolved oxygen concentration on the toxicity of potas-sium cyanide to rainbow trout. J. Exp. Biol. 31, 161—4.
FORTUNE, P. Y. (1955). Comparative studies of the thyroid function in the Teleosts of tropical and temperate habitats. J. Exp. Biol. 33, 504-13.
FRY, F. E. J. (1947). Effects of the environment on animal activity. Univ. Toronto Studies Biol. no. 55, 68, 62 pp. Publ. Ontario Fisheries Research Lab.
FRY, F. E. J. (1957). The aquatic respiration of fish, Vol. 1, The Physiology of Fishes, ed. M. E. Brown. New York: Academic Press.
FRY, F. E. J., BRETT, J. R. & CLAWSON, G. H. (1942). Lethal limits of temperature for young gold-fish. Rev. Can. Biol. 1, 50-6.
FRY, F. E. J., HART, J. S. & WALKER, K. F. (1946). Lethal temperature relations for a sample of young speckled trout, Salvelinus fontinalis. Univ. Toronto Stud. Biol. no. 54, 66, 35 pp. Publ. Ontario Fisheries Research Lab.
GRAY, J. (1928). The growth of fish. III. The effect of temperature on the development of eggs of
Salmo fario. J. Exp. Biol. 6, 125-30.
HALSBRAND, E. (1953). Untersuchungen Uber das Verhalten von Forelle (Trutta iridea, W. Gibb.) und Dobel (SquaUus cephaius. Heck.) bei Einwirkung verschiedener Aussenfactoren. Z. Fisch.
N.F. a, 227-70.
HART, J. S. (1947). Lethal temperature relations of certain fish in the Toronto region. Trans. Roy.
Soc. Can. V, (3), 41, 57-71.
HART, J. S. (1952). Geographic variations of some physiological and morphological characters in certain freshwater fish. Univ. Toronto Stud. Biol. no. 6o, 73, 77 pp. Publ. Ontario Fisheries Research Lab.
HARTLEY, P. H. T. (1947). The natural history of some British freshwater fishes. Proc. Zool. Soc.
Lond. 117, 129—206.
HATHAWAY, E. S. (1927). The relations of temperature to quantity of food consumed by fishes.
Ecology, 8, 428-34.
JOB, S. V. (1955). The oxygen consumption of Salvelinus fontinalis. Univ. Toronto Stud. Biol. no. 61, 73, 39 pp. Publ. Ontario Fisheries Research Lab.
LOEB, J. & WASTENBYS, H. (1912). On the adaptation of fish (Fundulus) to higher temperatures.
J. Exp. Zool. 13,
543-57-MOORB, E. W. (1939). Graphic determination of carbon dioxide and the three forms of alkalinity.
J. Amer. Wat. Whs Ass. 31, 51-60.
216 ANTHONY W. COCKING
RUBIN, M. A. (1935). Thermal reception in fishes. J. Gen. Pkytiol. 18, 643-53.
SUMNER, F. B. & DOUDOROFF, P. (1938). Some experiments upon temperature acclimatisation and respiratory metabolism in fishes. Biol. Bull., Woods Hole, 74, 403-29.
THRESH, J. C , BBALE, J. F. & SUCKLING, E. V. (1949). The Examination of Water and Water
Supplies, 6th ed. London: Churchill.
VERNON, H. M. (1899). The death temperature of certain marine organisms. J. PhysioL as, 131-8. WELLS, M. M. (1914). The reactions and resistance of fishes to temperature. Trans. III. Acad. Sd.
7.
48-59-WELLS, N. A. (1935). Change of rate of respiratory metabolism in a teleost fish induced by acclima-tisation to high and low temperatures. Biol. Bull., Woods Hole, 69, 361—7.
WrNTERSTEiN, K. (1908). Beitrfige zur Kenntniss der Fischatmung. PflOg. ArMv. ges Physiol. 135,
73-98-WOOD, A. H. (1932). The effects of temperature on the growth and respiration of fish embryos,
Salmofario. J. Exp. Biol. 9, 271-6.
WUHHMANN, K. (1952). Sur quelques principes du toxicologie du poisson. Bull. Cent. Beige