Original Article
Adjustments made to the Q-flags affect the
performance of the flags generated by the IMI channel
Haixia Wang, Yao Bai, Shengfa Li
Department of Laboratory Medicine, The First Affiliated Hospital of Chongqing Medical University, Chongqing, China
Received May 3, 2018; Accepted July 26, 2018; Epub May 15, 2019; Published May 30, 2019
Abstract: Introduction: IMI-DC (immature information-direct current) is a useful index for efficient morphologic clas-sification of cells. This study assessed the usefulness of IMI-DC thresholds to retain less than 5% false negative rate on automated cell counters. Methods: In total, 526 blood samples supplemented with EDTA-K2 (1.8 mg/mL) were analyzed on Sysmex XE2100. Then, 5 WBC-specific flags including blasts, immature granulocytes, left shift were verified by manual slide review. Laboman EasyAccess 4.2.44 was used for data analysis and measuring efficiency. False-negatives were counted by standard microscopy following the laboratory’s standard operating procedure. Optimized IMI-DC thresholds were assessed by receiver operating characteristic (ROC) curve through maximized YI. The efficiency of the optimized IMI-DC thresholds was verified by 200 additional samples. Results:The 526 samples examined by the Laboman software showed 63.40% positive predictive value (PPV), 89.81% negative predictive value (NPV), 82.13% efficiency, 10.65% false-positives, 7.22% false-negatives and 29.09% review rate. Maximized Youden index (YI) altered the false negative rate to 3.5%, PPV to 64.15%, NPV to 95.24%, efficiency to 87.00%, and false-positive to 9.5%. Finally, review rate was reduced from 29.09% to 26.5%.Discussion: IMI-DC is associated with false negative rate in automated cell counters. A low false negative rate helps improve the accuracy of automated cell counters.
Keywords: Q flag, smear slide review, thresholds, IMI channel, automated cell counters
Introduction
Automated laboratory hematology analyzers are very efficient at performing leukocyte dif-ferential count and blood morphologic evalua-tion, with greater precision and accuracy com-pared with manual screening of blood smears [1, 2]. When this novel technology was intro-duced by Wallace Coulter in 1953, the manual screening of blood smears was replaced [3]. Performing manual blood morphology analysis and using automated cell counters yield identi-cal results. However, the latter procedure ensures efficiency and productivity in a medical laboratory.
Furthermore, the International Society for Laboratory Hematology (ISLH) through the International Consensus Group for Hematology Reviews, founded by the hematologist Berend Houwen, published a set of 41 applicable guidelines as criteria for reviewing automated
complete blood count and leukocyte differen-tial results obtained with automated hematolo-gy analyzers [4]. These guidelines have been applied in different laboratories with various choices according to specific laboratory condi-tions [5-7], aiming to reduce cost and save time without sacrificing data quality.
In addition, quality control data to identify tests that utilize internal quality control processes to confirm performance is important in evaluating the accuracy of an instrument [8].
Gran. In our laboratory, review criteria were established for the Sysmex XE2100 (Sysmex, Kobe, Japan) instrument. Based on these parameters, blood smear examination was per-formed to assess the validity of reported flags. In order to ensure the accuracy of validated results for reported flags, an external control daily was assessed and numeric QC data was monitored. In the process of online quality con-trol monitoring, we found that IMI-DC was below target value. This indicated that sensitivity of immature cell assessment is reduced, with the “Left Shift, Blasts, Immature Gran” not report-ed. A microscopic slide review may not be per-formed. As a result, accuracy of verifying “Left Shift, Blasts, Immature Gran” presence and identifying/excluding other pathologic cells, e.g. blasts, in peripheral blood, will be altered. To our knowledge, no studies have investigated the usefulness of IMI-DC quality control data. The aim of this study was thus to evaluate ana-lytical and diagnostic performance of IMI-DC measurements as well as the usefulness of IG flag reports by Sysmex XE-2100, assessing the effect of manual slide review. IMI-DC thresh-olds of Sysmex XE-2100 were altered. The accuracy of IMI-DC and usability of “Left Shift, Blasts, Immature Gran” flag reports were stud-ied by comparing with manual review.
Materials and methods
Sysmex XE2100 automated cell counters
Routine hematology samples from inpatient and outpatient populations were analyzed ran-domly on Sysmex XE2100 at the First Affiliated Hospital of Chongqing Medical University. Dur- ing a period of three days, 526 blood samples supplemented with ethylenediaminetetraacetic acid (EDTA)-K2 (1.8 mg/mL) were selected and reanalyzed on Sysmex XE2100. All specimens were kept anonymous. Only samples initially reported with one or more WBC-specific sus-pect flags by microscopic slide review were included. The 3 WBC-specific flags affected by
the channel IMI were: (1) blasts, (2) immature granulocytes, (3) left shift. These flags were generated by patterns in scatter grams, and are typical for certain abnormalities [9]. Manual blood smear and differential WBC counts
Manual blood smear and differential WBC counts using standard microscopy following the laboratory’s standard operating procedure, based on the Clinical and Laboratory Standards Institute guidelines [4]. In this process, atypical lymph was excluded. Manual slide review was performed by 2 observers, with consistency certified by comparison [10]. At least 200 nucleated cells were counted by at least 2 observers independently, in a blinded manner. The criteria defining positive smear are summa-rized in Table 1, and based on recommenda-tions by the International Consensus Group for Hematology Review [4, 9]. Laboman EasyAccess 4.2.44 (Sysmex, Kobe, Japan) was then used for data analysis. Positive and negative micro-scopic review results were considered true pos-itive (TP) and false pospos-itive (FP), respectively. Positive microscopic review results with nega-tive automated count results were considered false-negatives (FN). A negative microscopic re- view result was considered true negative (TN). IMI-DC threshold reduction
Improving the IMI-DC threshold was used to adjust IMI-DC data that mainly reflect sensitivi-ty of “Left Shift, Blasts, Immature Gran” detec-tion. However, decreasing IMI-DC threshold was carried out by optimization. Optimal set-tings for flagging thresholds were assessed using the YI. The threshold was selected for an assay with YI maximized.
YI = Sensitivity + (specificity - 1)
Optimization began by reducing the cut-off value of “Left Shift, Blasts, Immature Gran” flags from factory default settings declining by 10 units and calculating the YI for identifying the specific abnormality denoted by the flag [11]. The threshold yielding the highest YI was selected for each flag.
Validation of optimized criteria
[image:2.612.89.290.109.163.2]Another randomly selected 200 samples (se- lection criteria were the same as described above) were used to validate the optimized flag
Table 1. Abnormal cell criteria for positive smear based on the International Society of Laboratory Hematology recommendations Abnormal cell types
Blasts ≥1%
threshold derived from the optimization as well as a new IMI-DC setting. Samples were assessed as described above.
Statistical analysis
Optimal settings for flag thresholds were described using the Youden index (YI). The thresholds were selected for an assay with YI maximized. YI was derived by ROC using the SPSS software 17.0.
Sensitivity, specificity, positive predictive value (PPV), negative predictive value (NPV), micro-scopic review rate, and efficiency were evaluat-ed by the Laboman software as follows [12]: Sensitivity (%) = TP/(TP + FN) × 100; Specificity (%) = TN/(TN + FP) × 100; PPV (%) = TP/(TP + FP) × 100; NPV (%) = TN/(TN + FN) × 100;
Review rate (%) = (TP + FP)/(TP + FP+ FN + TN) × 100;
Efficiency (%) = (TP + TN)/(TP + FP + FN + TN) × 100
Results
Performance of 526 samples on Sysmex XE2100
A total of 526 samples were assessed by Sysmex XE2100 by experienced technologists. The results obtained with the Laboman
soft-ware are shown in Table 2. PPV, NPV, and effi-ciency were 63.40%, 89.81%, and 82.13%, respectively. A false-positive rate of 10.65% was obtained; false-negative rate was 7.22%, for a review rate of 29.09%. To reduce the false-negative rate, we analyzed 526 additional samples. There are 13 false negative samples were Myelocytes/Promyelocytes/Metamyelocy- tes among the 526 samples.
Optimized thresholds
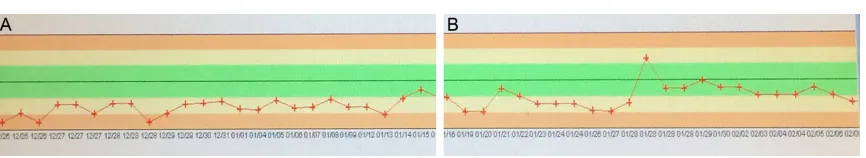
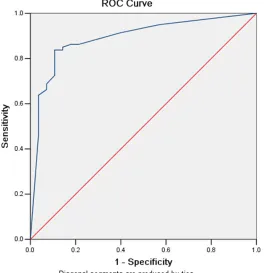
Online quality control was a procedure using control material. The target value was setting according to short term quality control method. When online quality control data were asse- ssed, IMI-DC data were found to be below the target values (Figure 1A and 1B). The threshold for IMI-DC was optimized for the detection of specific abnormalities. Quality data were reflected by the machine reducing the sensitiv-ity of estimating “Left Shift, Blasts, Immature Gran”; this resulted in a high false-negative value. Therefore, the threshold for “Left Shift, Blasts, Immature Gran” was optimized from 100 to 90; a receiver operating characteristic (ROC) curve was used to evaluate the efficiency of optimizing the flag threshold for “Left Shift, Blasts, Immature Gran”. As shown in Figure 2, theAUC of optimizing the threshold from 100 to 90 was 0.730, with 83.8% sensitivity and 80.8% specificity.
Validation of the optimized setting
[image:3.612.92.525.152.231.2]An independent set of 200 samples were next used to validate the optimized settings. App-
Table 2. False negative rate, false positive rate, PPV, NPV and efficiency of former and optimized criteria in the validation set
Criteria False negative, %, NO. False positive, %, NO. PPV, % NPV, % Efficiency, %
Former 7.22, 38/526 10.65, 56/526 63.40 89.81 82.13
Optimized criteria 3.50, 7 (total number = 200) 9.50, 19 (total number = 200) 64.15 95.24 87.00
lication of the optimized thresholds instead of factory-default settings investigated the num-ber of false-negatives from 38 (total numnum-ber = 526) to 7 (total number = 200), indicating a false negative rate reduction from 7.22% to 3.5%; overall PPV, NPV and efficiency were 64.15%, 95.24%, and 87.00%, respectively. A false-positive rate of 9.5% was obtained (Table 2).
Effects of IG flagging threshold adjustment on review rate
The review rate was 29.09% for all complete blood cell counts with differential values when the factory-default threshold was used. When the optimized threshold was applied, the review rate dropped to 26.5%, indicating that the opti-mized threshold did not increase the burden of manual slide review.
Clinical effect of false-negatives
Among the abnormalities observed in manual differential WBC counts of the validation set (n = 200), 2 (1.0%), 2 (1.0%), 2 (1.0%), and 1 (0.5%) samples had promyelocytes,
metamy-IMI-DC for testing samples on automated cell counters is emphasized to allow laboratories to safely increase the efficiency of morphologic classification of cells.
In general, the usefulness of instrument-gener-ated flags is evaluinstrument-gener-ated by their sensitivity and specificity [13-17]. Overall, optimized thresh-olds lead to increased PPV, NPV, and efficiency rate compared with factory-default settings because of low false negative rates.
This study demonstrates the value of IMI-DC in decreasing the false negative rate. However, Heidi Eilertsen et al. [18] reported that the “IG Present” flag gives almost no information regarding blast detection in addition to the “Blasts” flag. In this study, because of the num-ber of missed immature myeloid cells, adjust-ing to the Q-flags affected the performance of the flags, with no cases of blasts being missed and “IG Present” being detected. The high false negative rate was reduced and the efficiency of automated hematology analyzer was improved. Maximized YI, which could optimize the rela-tionship between true-positives and false-posi-Figure 2. ROC analysis was used to optimize the flag threshold for
im-mature granulocytes.
elocytes, neutrophil particle toxici-ty, and erythroblasts. No cases of blasts were missed.
Discussion
[image:4.612.92.356.75.348.2]tives, was used to improve PPV. An additional factor is the XE-IG master software, which could report a parameter directly called imma-ture granulocytes (IG) from the analyzer. CAP Laboratory Improvement Programs [19] report-ed that adopting certain laboratory practices may be possible to reduce the rates of manual reviews of peripheral blood smears and in- crease the efficiency of generating CBC results. In conclusion, the IMI-DC threshold is impor-tant in reducing the false-negative rate and improving the overall PPV and NPV. In another, this study finds the best cut-off value for the Q-flags which provide a more adequate assess-ment in order to indicate the blood smear review.
Acknowledgements
This work was supported by Jishu Deng, Zuqin Wang and Jingsong Liu and in part by the National Science Foundation of China (Grant No. 81401728).
Disclosure of conflict of interest
None.
Address correspondence to: Haixia Wang, Depart- ment of Clinical Laboratory, The First Affiliated Hos- pital of Chongqing Medical University, Chongqing 400016, China. Tel: +86 23-89011841; Fax: +86 23-89012513; E-mail: [email protected]
References
[1] Barnes PW, McFadden SL, Machin SJ, Simson E; International consensus group for hematol-ogy. The international consensus group for he-matology review: suggested criteria for action following automated CBC and WBC differential analysis. Lab Hematol 2005; 11: 83-90. [2] Briggs CJ, Linssen J, Longair I, Machin SJ.
Im-proved flagging rates on the sysmex XE-5000 compared with the XE-2100 reduce the num-ber of manual film reviews and increase labo-ratory productivity. Am J Clin Pathol 2011; 136: 309-316.
[3] Clinical and Laboratory Standards Institute (CLSI). (2008) User Protocol for evaluation of qualitative test performance; Approved guide-line-second edition. CLSI document EP12-A2 (ISBN1-56238-654-9). Clinical and laboratory standards institute, 940 west valley road, suite 1400, wayne, pennsylvania 19087-1898 USA.
[4] Comar SR, Malvezzi M, Pasquini R. Are the re-view criteria for automated complete blood counts of the international society of laborato-ry hematology suitable for all hematology labo-ratories? Rev Bras Hematol Hemoter 2014; 36: 219-25.
[5] Gulati G, Song J, Florea AD, Gong J. Purpose and criteria for blood smear scan, blood smear examination, and blood smear review. Ann Lab Med 2013; 33: 1-7.
[6] Kim AH, Lee W, Kim M, Kim Y, Han K. White blood cell differential counts in severely leuko-penic samples: a comparative analysis of dif-ferent solutions available in modern laboratory hematology. Blood Res 2014; 49: 120-6. [7] Hoffman R, Benz EJ, Furie B, Shattil SJ.
Hema-tology: basic principles and practice, 5th edi-tion. Philadelphia, PA: Churchill Livingstone: Elsevier; 2009. pp. 443.
[8] Kang SH, Kim HK, Ham CK, Lee DS, Cho HI. Comparison of four hematology analyzers, cell-DYN sapphire, ADVIA 120, coulter LH 750 and sysmex XE-2100, in terms of clinical useful-ness. Int J Lab Hematol 2008; 30: 480-486. [9] Koepke JA. A delineation of performance
crite-ria for the differentiation of leukocytes. Am J Clin Pathol 1997; 68 Suppl: 202-206.
[10] Lantis KL, Harris RJ, Davis G, Renner N, Finn WG. Elimination of instrument-driven reflex manual differential leukocyte counts. Optimi-zation of manual blood smear review criteria in a high-volume automated hematology labora-tory. Am J Clin Pathol 2003; 119: 656-662. [11] NCCLS H20-A 1992.01.01 Reference
Leuko-cyte Differential Count (Proportional) and Eval-uation of Instrumrntal Methods; Approved Standard.
[12] Schisterman EF, Perkins NJ, Liu A, Bondell H. Optimal cut-point and its corresponding Youden Index to discriminate individuals using pooled blood samples. Epidemiology 2005; 16: 73-81.
[13] Pierre RV. Peripheral blood film review: the de-mise of the eyecount leukocyte differential. Clin Lab Med 2002; 22: 279-297.
[14] Aulesa C, Pastor I, Naranjo D, Galimany R. Ap-plication of receiver operating characteristics curve (ROC) analysis when definitive and sus-pect morphologic flags appear in the new Coul-ter LH 750 analyzer. Lab Hematol 2004; 10: 14-23.
[15] Ruzicka K, Veitl M, Thalhammer-Scherrer R, Schwarzinger I. The new hematology analyzer sysmex XE-2100: performance evaluation of a novel white blood cell differential technology. Arch Pathol Lab Med 2001; 125: 391-6. [16] Stamminger G, Auch D, Diem H, Sinha P.
[17] Sireci A, Schlaberg R, Kratz A. A method for op-timizing and validating institution-specific flag-ging criteria for automated cell counters. Arch Pathol Lab Med 2010; 134: 1528-33.
[18] Eilertsen H, Hagve TA. Do the flags related to immature granulocytes reported by the Sys-mex XE-5000 warrant a microscopic slide re-view? Am J Clin Pathol 2014; 142: 553-60.