Abstract - The objective of this research is to develop an instrument to measure student attitude toward IT career promotion. Instrument was designed based on questionnaire used to measure the effect of Aad on familiar product brand. As used before, questionnaire was developed to measure three (3) variables, such as positive effects, negative effects, and attitude. Two first mentioned is grouped as feeling. Questionnaire was distributed to high school student located in five (5) regions of Jakarta, Indonesia. Data collected first analyze using factor analysis in order to narrow question items and proceed with Confirmatory Factor Analysis (CFA) in order to validate each question item. Result shows using principal factor analysis, out of 24 feeling indicators 22 indicators meet prerequisite. From attitude indicators, out of 10 items, 9 indicators meet prerequisite. Using Confirmatory Factor Analysis (CFA), it shows that feeling towards promotion influence attitude towards promotion significantly.
Key Words : attitude, IT career interest, negative effect, positive effect, promotion
I. INTRODUCTION
It is evident that the rapid growth of computer technology has influenced all human activities both in rural or urban area. We can see that all business activities use computer technology in order to achieve high work efficiency. All businesses, micro, small, medium, or big sizes, service or manufacture industry increasingly utilizing advanced information and communication technologies, such as the Internet, in hopes of improving the efficiency, cost-effectiveness, and/or quality of their customer-facing operations [1]; [2]; [3]; [4]; [5]; [6]; [7]. In regards to this, the need for computer and IT workers and specialists is high
In addition to high market demand, the high salaries offered by companies would be attractive as well to job seekers. These attractiveness (high demand and salary) could be useful for Indonesian government to motivate young work force to plan a career in IT. This could be in turn replacing the blue collar (household maid) exports. Exporting blue collars is a big issue and big problem for Indonesian
Manuscript receipt on August 2nd 2010.
E.S. Margianti. is lecturer and researcher in University of Gunadarma. Postal Address: Jalan Margonda Raya No. 100 Depok 16424, Indonesia. Phone : +628129617275. email : [email protected],
Hotniar Siringoringo. is a lecturer and researcher in University of Gunadarma. Postal Address: Jalan Margonda Raya No. 100 Depok 16424, Indonesia. Phone : +628129617275. email :
[email protected], [email protected].
3Yudi Agustono. Direoctorate of Higher Education, Jakarta Indonesia. Email id : [email protected]
4Trini Saptariani.. is a lecturer and researcher in University of Gunadarma. Postal Address: Jalan Margonda Raya No. 100 Depok 16424, Indonesia. email id : [email protected]..
government these days. They are quite often tortured by their employer.
In the need of government to improve work force qualification from blue collars to white collars, from household maid to IT/computer specialist, government needs to promote the IT career prospects. Therefore, subsequent and continuous researches are needed. Such research is to develop an instrument in promoting IT career opportunity.
II. RESEARCH METHOD
Presentation was used to promote the prospect of IT career. The intention of treatment is to effect differences in subjects’ response psychologically. Subjects might reflect in measure of affective reaction (feeling) and cognitive evaluation (attitude). Based on [8] and [9] instruments, we developed questionnaire with 24 items measuring feelings and 10 items measuring attitudes. Feelings (affective reaction) consists of confused, stimulated [8], promising, attractive (positive and negative), bored, confident, contemplative, convinced, creative, withstand, depressed, dubious, hopeful, inspire, decent, interested, pensive, proud, satisfied, skeptical, stimulated, strong, suspicious [9]. Attitude (cognitive evaluation) consists of imaginative, informative, useful, valuable, thorough, memorable, stimulate, for me, annoying, and trust [9].
Presentation on computer/IT career prospect was used as treatment stimuli. We designed a presentation informing computer/IT work force absorption currently, the need for future, and range of salary offered currently both in Indonesia and USA (the lowest and highest salary offer). Presentation was designed for 5 minutes.
Participants for the study were recruited from High School students located in five (5) regions of Jakarta Indonesia. Choosing the participants for the study first based on school rating. Few years back, directorate of primary and secondary education patronize every two (2) schools in each region of Jakarta as top quality based on entering score and school facilities. Between the two schools, we chose the second grade which is called as the second to the top. Within the school, we chose the classes based on their time availability as we didn’t intend to disturb the students on study time. We entered to the class by chance when the teacher was not present. We succeeded to recruit 392 respondents.
Having introducing ourselves and described the research purpose, filling out questionnaire was started. First we asked participants to provide us with family background as well as their age. It took 2-3 minutes and we asked the student not to read on succeeding questions. It’s followed by computer/IT career prospect presentation. During the presentation, we asked the students not to look nor read the questionnaire. Having finished the presentation, the student asked shortly to fill out the remaining questions for 10-15 minutes.
Measurement Development of Attitude toward
IT Career Promotion Instrument
On questionnaire answering session, participants were asked to try to remember what they were feeling during the presentation. Student asked to response for each of 54 adjectives on a five (5) Likert scale. We didn’t follow a 6-point scale of [8] in order to provide neutral feeling.
III. RESULT AND DISCUSSION
First five (5) minutes as the starting for the presentation, we stimulate student towards Indonesian labor in abroad as house maid. We told them how bad those labors be treated by their employer. Even few of them died or became handicap tortured by their employer. But still many of Indonesian work forces still look for job as house maid in abroad as they can’t get better job whether in Indonesia nor abroad. The government seems do nothing toward this dilemma as we need foreign exchange to strengthen nation economy. Subsequently we triggered student concern by explaining that this dilemma can be overcome by turning out workforce policy. Government should ban house maids employ and shift to trained workforce such as computer/IT workers. Then we proceed to describe the statistics of computers / IT workers in Indonesia and the USA today, forecast future demand, and current salary offered.
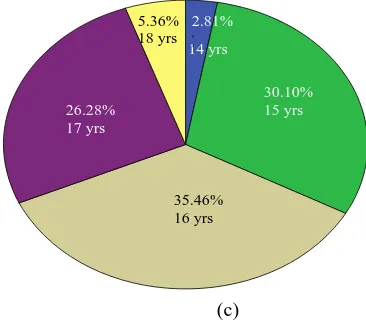
Filled questionnaire further was coded and input to MS Excel. Respondent profile is described on Fig. 1-3. Based on school location (Fig. 1), respondents composition on the five regions are almost similar. Percentage is ranging from 11.22% (the least in East Jakarta) till. 27.30% (Center Jakarta). More than half of respondent is female (Fig. 2), and respondent composition based on age ranging from 2.81% (14 years old) till 35.46% (16 years old) (Fig. 3).
Fig. 1. Student Characteristics based on location
[image:2.595.317.500.66.226.2](c)
Fig. 3. Student Characteristics based on age
Before proceeded to factor analysis, firstly we performed data adequacy test using KMO and Bartlett’s test. As KMO for feeling is 0.846 and attitude is 0.833, both far above 0.5, and significance is 0.000 for both, far below 0.01, then we accept that those variables and data are adequate and can be proceed to further analysis.
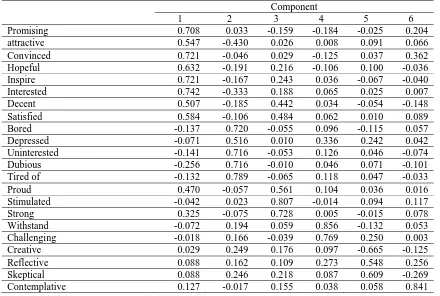
Table 1 provides principal component solution of feeling toward promotion. It’s constructed six (6) dimensions. Promising, attractive, convinced, hopeful, inspire, interested, decent, and satisfied are grouped as first dimension, bored, depressed, uninterested, dubious, and tired of as second dimension, proud, stimulate, and strong as third dimension, withstand and challenging as fourth dimension, creative, reflective, and skeptical as fifth dimension, and contemplative as sixth dimension. Trust has a factor loading less than 0.5 so that it’s excluded from further analysis. There are two (2) indicators don’t show factor loading above 0.5. Therefore the two (2) indicators do not use for further analysis.
Table 2 provides as well principal component solution of attitude towards promotion. Indicators can be grouped into there (3) components (dimensions). Imaginative, informative, useful, valuable, thorough, memorable are grouped as the first dimension. Stimulate and for me are in one group (second dimension). Remaining, “annoying” is the only one member of the last component, third dimension. Trust has a factor loading less than 0.5 so that it’s excluded from further analysis.
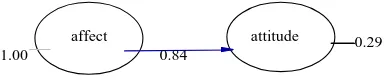
All indicators were proceeded to Confirmatory Factor Analysis (CFA) in order to evaluate the relationship between feeling toward promotion and attitude toward promotion. CFA fit of measure summary is provided on Table 3 and model estimate is portrayed on Fig. 4.
All indexes are used to measure model fit with data. Model fit criteria commonly used are chi-square, GFI, AGFI, and RMSEA. These criteria based on the differences between the
5.36% 18 yrs
26.28% 17 yrs
35.46% 16 yrs
30.10% 15 yrs 2.81%
%
14 yrs 0
44.39%
55.61% 27.30%
Center of Jakarta
19.90%
South Jakarta
26.79% North Jakarta
11.22%
East Jakarta 14.80%
[image:2.595.60.238.432.595.2]Table 1. Principal Component Solution of Feeling
Component 1 2 3 4 5 6
Promising 0.708 0.033 -0.159 -0.184 -0.025 0.204
attractive 0.547 -0.430 0.026 0.008 0.091 0.066
Convinced 0.721 -0.046 0.029 -0.125 0.037 0.362
Hopeful 0.632 -0.191 0.216 -0.106 0.100 -0.036
Inspire 0.721 -0.167 0.243 0.036 -0.067 -0.040
Interested 0.742 -0.333 0.188 0.065 0.025 0.007
Decent 0.507 -0.185 0.442 0.034 -0.054 -0.148
Satisfied 0.584 -0.106 0.484 0.062 0.010 0.089
Bored -0.137 0.720 -0.055 0.096 -0.115 0.057
Depressed -0.071 0.516 0.010 0.336 0.242 0.042
Uninterested -0.141 0.716 -0.053 0.126 0.046 -0.074
Dubious -0.256 0.716 -0.010 0.046 0.071 -0.101
Tired of -0.132 0.789 -0.065 0.118 0.047 -0.033
Proud 0.470 -0.057 0.561 0.104 0.036 0.016
Stimulated -0.042 0.023 0.807 -0.014 0.094 0.117
Strong 0.325 -0.075 0.728 0.005 -0.015 0.078
Withstand -0.072 0.194 0.059 0.856 -0.132 0.053
Challenging -0.018 0.166 -0.039 0.769 0.250 0.003
Creative 0.029 0.249 0.176 0.097 -0.665 -0.125
Reflective 0.088 0.162 0.109 0.273 0.548 0.256
Skeptical 0.088 0.246 0.218 0.087 0.609 -0.269
Contemplative 0.127 -0.017 0.155 0.038 0.058 0.841
[image:3.595.42.443.394.526.2]
Table 2. Principal Component Solution of Attitude
Component 1 2 3
Imaginative 0.709 0.073 -0.171
Informative 0.799 -0.072 0.147
Useful 0.605 0.246 0.327
Valuable 0.718 0.249 0.102
Thorough 0.691 0.245 0.015
Memorable 0.594 0.293 0.307
Stimulate 0.066 0.849 -0.203
For me 0.278 0.718 0.252
Annoying 0.019 0.108 -0.861
Table 3. Fit Measure
Index Calculated Acceptance level Fitting
Chi square 1092.84 table Not fit
RMSEA 0.070 0.08 Acceptable
Normed Fit Index (NFI) 0.87 0(not fit-1(perfect fit)) good Non-Normed Fit Index (NNFI) 0.88 0(not fit)-1(perfect fit) good Comparative Fit Index (CFI) 0.91 0(not fit)-1(perfect fit) Very Good Incremental Fit Index (IFI) 0.91 0(not fit)-1(perfect fit) Very good
Goodness of Fit Index (GFI) 0.86 0-0.9 good
Adjusted Goodness of Fit Index (AGFI)
[image:3.595.40.480.561.683.2]Other indexes are fit. RMSEA falls in acceptance range, NFI, NNFI, IFI, CFI, GFI, and AGFI fit good. Therefore, this model is reasonable to accept and can be used further to measure feeling and attitude toward computer/IT career promotion by deploying more respondents. The only need is to increase respondent quantity.
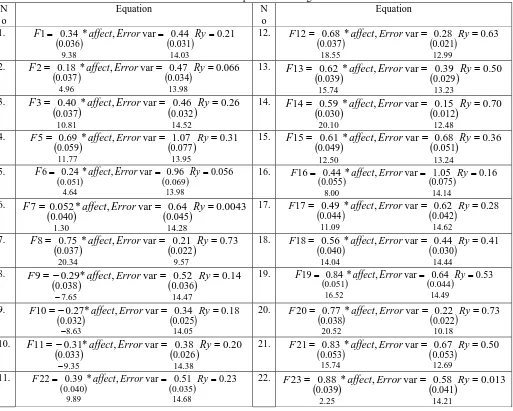
We proceed in understanding the role of each indicators in developing feeling and attitude toward promotion. As shown on Table 4, F9, F10, F11, indicate negative contribution. These indicators are depressed, uninterested, and dubious respectively. As the three indicators are negative feeling, it justifies the negative direction. It implies that the promotion designed by presenting the absorption of computer/IT workforce now, predicted need in the future, and salary range currently, does not create depressed, uninterested, and dubious. More ever we can show the contribution of each indicator in establishing feeling. The biggest contribution in developing feeling toward computer/IT promotion based on the loading is proudness and the smallest is creativeness. It provides for promotion designer in order to establish positive feeling, he/she should create proudness stronger and lessen creativeness.
[image:4.595.325.519.108.148.2]On attitude variable (Fig. 4), A6 indicates negative contribution. It is acceptable since A6 is annoyance indicator, negative attitude indicator precisely. It means that promotion material designed doesn’t bear student annoyance. In another word, student can’t disregard the promotion material. The strongest contribution to the attitude is shown by A4 indicator (for me), and the most weakness is shown by A10 (memorable). It implies by presenting current and future computer/IT absorption and current offered salary, we can motivate the student to consider computer/IT job as future career. As memorable indicator shows smallest contribution, we need to promote computer/IT career frequently.
Fig. 4. Y-model
The impact of feeling on attitude toward computer/IT career promotion is 0.84 (Fig, 5). This statistics indicates that
[image:4.595.64.266.461.628.2]study is a presentation in regards to computer/IT career prospect using MS power point and viewer projector. However those stimuli are in the same group as promotion activities with different media and material.
Fig. 5. structural model
IV. CONCLUSION
Feeling and attitude indicators toward advertising used in commercial brand product are adaptable for feeling and attitude toward computer/IT career promotion study. However not all indicators are adapted. It is needed to adjust so that only 9 indicators play as attitude formation and 21 indicators are suitable in feeling formation. Imaginative, informative, useful, valuable, thorough, memorable, stimulate, for me are and annoying are valid indicators of attitude toward computer/IT career promotion. Promising, attractive, convinced, hopeful, inspire, interested, decent, satisfied bored, depressed, uninterested, dubious, tired, proud, stimulate, strong, withstand challenging, creative, reflective, skeptical, and contemplative are those indicators of feeling (emotion) toward computer/IT career promotion.
Feeling towards promotion influences attitude towards promotion. The more positive feeling can be created by promotion the more positive attitude can be expected.
However the result from this study still needed to verify further. As the future work force is not only resulted from first or second to the top of high school students, study for all school strata need to be performed. One should be considered for the study is using stratified sampling.
It is also needed and possible to modify the experiment. To more precisely measuring the impact of promotion towards feeling and attitude, it’s needed to measure feeling and attitude before the presentation. It will become control data.
REFERENCES
[1] J.A. Fitzsimmons, M.J. Fitzsimmons, Service Management: Operations, strategy, and information technology. Irwin-McGraw Hill, New York, NY., 2004 [2] L. Huete, A.V Roth., “The industrialization and span of retail banks’ delivery systems,” International Journal of Operations and Production Management 8 (3), 1988, pp. 46–66.
[3] R.M. Haynes, E.A. Thies,. “Management of technology in service firms,” Journal of Operations Management, 10 (3), 388–397, 1991
affect 1.00
attitude 0.29
Chi-Square=1027.34, df=352, P-value=0.00000, RMSEA=0.070 0.84
attitude 1.00
A 1.13
A 0.46
A 0.27
A 0.31
A 0.31
A 0.45
A 0.19
A 0.22
A10 0.67 Chi-Square=1027.34, df=352, P-value=0.00000, RMSEA=0.070
0.54 0.40 0.58 0.40 -0.24 0.32 0.63 0.64 0.10
0.48
0.04 0.06
[6] A.V. Roth, “Service strategy and the technological revolution: The 7 myths of E-services,” In: Machuca, J.A.D., Mandakovic, T. (Eds.), POM Facing the New Millennium:Evaluating the Past, Leading with the Present and Planning the Future of Operations. POM Sevilla, 2000,pp. 159–168.
[7] K.K. Boyer, R. Hallowell, A.V. Roth,. E-services: operating strategy—a case study and a method for analyzing operational benefits. Journal of Operations Management 20 (2), 2002, pp. 175–188.
[8] T.J. Madden, C.T. Allen, and J.L Twible, “Attitude toward the Ad: an Assessment of diverse measurement,” JMR, Journal of Marketing Research; 25, 3; ABI/INFORM Global pg. 242, 1988.
[9] M.C Burke and J. A. Edell, “The impact of feelings on Ad-based affect and cognition,” Journal of Marketing Research; 26, 1Feb 1989, pp. 69-84.
[10] D.J. Moore and W.D. Harris, “Affect intensity and the consumer's attitude toward high impact emotional advertisement appeals” Journal of Advertising; Summer; 25, 2; 1996, pp. 37-50.
[11] R.P. Bagozzi and D.J Moore, “Public service advertisements : Emotions and empathy guide prosocial Behavior,” Journal of Marketing, 58, 1994, pp. 56-70. [12] D.M. Stayman and D.A. Aaker, “Are all the effects of
[image:5.595.49.562.235.646.2]Ad-induced feeling mediated by A, “ Journal of Consumer Research, 15 (Dec), 1988, pp. 368-373.
Table 4. Measurement equation of feeling indicators N o Equation N o Equation 1.
0.34
* , var
0.44
0.211 03 . 14 38 . 9 031 . 0 036 . 0
affect Error Ry
F 12.
0.68
* , var
0.28
0.6312 99 . 12 55 . 18 021 . 0 037 . 0
affect Error Ry
F
2.
0.18
* , var
0.47
0.0662 98 . 13 96 . 4 034 . 0 037 . 0
affect Error Ry
F 13.
0.62
* , var
0.39
0.5013 23 . 13 74 . 15 029 . 0 039 . 0
affect Error Ry
F
3.
0.40
* , var
0.46
0.263 52 . 14 81 . 10 032 . 0 037 . 0
affect Error Ry
F 14.
0.59
* , var
0.15
0.7014 48 . 12 10 . 20 012 . 0 030 . 0
affect Error Ry
F
4.
0.69
* , var
1.07
0.315 95 . 13 77 . 11 077 . 0 059 . 0
affect Error Ry
F 15.
0.61
* , var
0.68
0.3615 24 . 13 50 . 12 051 . 0 049 . 0
affect Error Ry
F
5.
0.24
* , var
0.96
0.0566 98 . 13 64 . 4 069 . 0 051 . 0
affect Error Ry
F 16.
0.44
* , var
1.05
0.1616 14 . 14 00 . 8 075 . 0 055 . 0
affect Error Ry
F
6.
0.052
* , var
0.64
0.00437 28 . 14 30 . 1 045 . 0 040 . 0
affect Error Ry
F 17.
0.49
* , var
0.62
0.2817 62 . 14 09 . 11 042 . 0 044 . 0
affect Error Ry
F
7.
0.75
* , var
0.21
0.738 57 . 9 34 . 20 022 . 0 037 . 0
affect Error Ry
F 18.
0.56
* , var
0.44
0.4118 44 . 14 04 . 14 030 . 0 040 . 0
affect Error Ry
F
8.
0.29
* , var
0.52
0.149 47 . 14 65 . 7 036 . 0 038 . 0 Ry Error affect F 19.
0.84
* , var
0.64
0.5319 49 . 14 52 . 16 044 . 0 051 . 0
affect Error Ry
F
9.
0.27
* , var
0.34
0.1810 05 . 14 63 . 8 025 . 0 032 . 0 Ry Error affect F 20.
0.77
* , var
0.22
0.7320 18 . 10 52 . 20 022 . 0 038 . 0
affect Error Ry
F
10.
0.31
* , var
0.38
0.2011 38 . 14 35 . 9 026 . 0 033 . 0 Ry Error affect F 21.
0.83
* , var
0.67
0.5021 69 . 12 74 . 15 053 . 0 053 . 0
affect Error Ry
F
11.
0.39
* , var
0.51
0.2322 68 . 14 89 . 9 035 . 0 040 . 0
affect Error Ry
F 22.
0.88
* , var
0.58
0.01323 21 . 14 25 . 2 041 . 0 039 . 0
affect Error Ry