Abstract—Wind turbines produce electrical energy by using the natural power of the wind to drive a generator. Small scale wind turbines can be used in domestic, community and smaller wind energy projects and these can be either stand-alone or grid-connected systems. With grid-connected turbines, the output from the wind turbine is directly connected to the existing mains electricity supply. This type of system can be used both for individual wind turbines and for wind farms exporting electricity to the electricity network. In this paper, wind farm in form of doubly fed induction generator penetrating is formulated into a power system. An optimal placement of wind farm on the power system topology is proposed aiming to minimize fuel and emission costs of overall system. The multiobjective Bees optimization (MBO) is used to minimize simultaneously fuel cost and emission of thermal units by changing location and varying sizes of wind farm. We employ IEEE 30 bus system to verify the proposed method. The results show that the proposed method found the optimal position of wind farm with minimum cost of fuel and environmental pollution.
Index Terms—Wind farm, Multiobjective Bees algorithm
I. INTRODUCTION
wind farm or wind park is as a cluster of wind turbines that acts and is connected to the power system as a single electricity producing power station. Generally it is expected that a wind farm consists of more than three wind turbines. Modern wind farms are installed offshore as well as on land. Size of wind turbine is selected to produce electricity energy followed by demand and wind power density. Now the largest wind turbine can give power up to 6 MW. Modern wind farms generally are connected to the high voltage transmission system, in contrast to the early application of wind energy for electricity production with wind turbines individually connected to the low to medium voltage distribution system [1].
The advantages of wind power are many, including practical, environmental as well as economic. Worldwide, the total kinetic energy contained in wind is more than 80 times that of human energy consumption. The advantage of wind power in economic is very low operation and maintenance cost. When wind farm is built to generate electricity, it can produce continually electricity into power system without many times of interruption. Moreover, wind energy system operations do not generate air or water
Manuscript received Nov 6, 2010; revised April 12, 2011. (Write the date on which you submitted your paper for review.)
Prakornchai Phonrattanasak. Author is PhD student at Thammasat University, Thailand and Lecturer at the North Eastern University ,Thailand (corresponding author to provide phone: +66866306324; e-mail: polratanasak.prakornchai@ gmail.com).
emissions and do not produce hazardous waste. Nor do they deplete natural resources such as coal, oil, or gas, or require significant amounts of water during operation. Wind's pollution-free electricity can help reduce the environmental damage caused by power generation from all country [2,3]. ANN for multi-objective optimal reactive compensation of a power system with wind generators [4] is developed to find tradeoff between economic and loss in power system. The tradeoff of economic and environment is not still developed. And high penetration of wind farm on power system is mysterious.
The goal of this paper is to find best location and sizing of wind farm in power system with minimum fuel cost and emission in test system. The multiobjective bees algorithm is developed to find minimum fuel cost and emission when the wind farm varies in its location and sizing. The IEEE 30 bus is selected to test proposed method. The result show that the best location and sizing of wind farm with minimum fuel cost and emission in test system.
II. PROBLEM FORMULATION
The objective of environmental/economic power dispatch with varying location and sizing of wind farm is to minimize the economic and environmental cost function of power system while satisfying various equality and inequality constrains.
A. Objective
Objective1: Minimization of generator cost The total US$/h fuel cost f(PG) can be expressed as
2
1
(
Gi,
w)
N i i Gi i Gi i wi
f P P
a
b P
c P
d P
=
=
∑
+
+
+
(1) where
a b c
i, ,
i iandd
i are the cost coefficients of the ithgenerator thermal units and wind farm, and PGiand
P
w arethe real power output of the ith generator thermal units and wind farm at bus
w
.N
is the number of generators. It can be defined as1 2
[
,
, ,
,
]
N
T
Gi G G G W
P
=
P P
…
P
P
(2)Objective2 : Minimization of environmental emission The total ton/h emission E(PG) of atmospheric pollutants
such as sulfur oxides SOX and nitrogen oxides NOX caused
by fossil-fueled thermal units can be expressed as
2 2
1
( , ) 10 ( ) exp( )
N
Gi W i i Gi i Gi i i Gi W i
e P P −
α β
Pγ
Pξ
λ
Pρ
P=
=
∑
+ + + +(3)
Optimal Placement of Wind Farm on the Power
System Using Multiobjective Bees Algorithm
Prakornchai Phonrattanasak,
Member, IAENG
where
α β γ ξ λ
i, , , ,
i i i iandρ
are coefficients of the ithemission characteristics of thermal units and wind farm. B. Constraints
Generation capacity constraints: For stable operation, real power output of each generator is restricted by lower and upper limits as follows:
N
i
P
P
P
Gimin≤
Gi≤
Gimax,
=
1
,...,
(4)min max
, 1
w w w B
P
≤
P
≤
P
≤ ≤
w N
(5)where NB is the number of buses.
Power balance constraints: Power balance is an equality constraint. The total power generation must cover the total demand PD. Hence,
1
0
N
Gi W D L i
P
P
P
P
=
+
−
−
=
∑
(6)Then, power loss in transmission lines can be calculated as
[
]
∑
=
− −
+ =
NL
k
j i j i j i k
loss g V V VV
P
1
2
2 2 cos(δ δ ) (7)
where Vi and Vj are the voltage magnitudes at bus i and j.
δ
iand δjare the voltage angles at bus i and j.Line loading constraints: for secure operation as follows:
S
Li≤
S
Limax,
i N
∈
L (8)where Sland
N
L are transmission line loading and the number of transmission lines.C. Formulation of Multiobjective optimization
Aggregating the objectives and constraints, the problem can be mathematically formulated as a nonlinear constraint mulitiobjective optimization problem as follows[5].
Minimize
[
f
(
x
,
u
),
e
(
x
,
u
)
]
(9) Subject to:0 ) , (xu =
g (10) 0
) , (xu ≤
h (11) where g(x,u) is the equality constraints , h(x,u) is the system inequality constraints.
D. Multiobjective optimization principle
For a multiobjective optimization problem, any two solutions x1 and x2 can have one of two possibilities:
One dominates the other or none dominates the other. In a minimization problem, without loss of generality, a solution
1
x dominates x2if the following two conditions are
satisfied [6]:
1. ∀i∈
{
1,2,...,Nobj}
:fi(x1)≤ fi(x2) (12) 2. ∃i∈{
1,2,...,Nobj}
: fj(x1)≤ fj(x2) (13)If any of the above condition is violated, the
solution
x
1 does not dominate the solutionx2. If x1dominates the solutionx2, x1 is called the nondominated
solution. The solutions that are nondominated within the entire search space are denoted as Pareto-optimal and constitute Pareto-optimal set. This set is also known as Pareto-optimal front.
III. PROPOSED MULTIOBJECTIVE BEES ALGORITHM
Bees algorithm was proposed by Pham D.T [5] which was widely used for optimizing numerical problems in 2006. The algorithm mimics the food foraging behaviour of swarms of honey bees. Honey bees use several mechanisms such as waggle dance to optimally locate food sources and to search new one. This makes them a good candidate for developing new intelligent search algorithms. It is a very simple, robust and population based stochastic optimization algorithm.
The colony of artificial bees includes two groups of bees namely scout and employed bees. The responsibility of scout bees is to find a new food source. The responsibility of employed bees is to determine a food source within the neighborhood of the food source in their memory and share their information with other bees within the hive.
In recent years, BA has been presented as an efficient population-based heuristic technique which is flexible and robust. However, changing conventional single objective BA to a multiobjective BA requires a rational redefinition. In MBA, there is no absolute one global best, but rather a set of nondominated solutions. Hence there is a need to compromise the quality of the outcome by a fuzzy technique as it is proposed in this paper.
A. Proposed MBO and Computation Flow
In the proposed MBO, the population has nsscout bees and each bee is an m-dimensional vector, where m is the number of optimized parameters. The computation flow of the proposed MBO technique is briefly stated and defined as follows:
Step 1: Generate randomly the initial populations of ns
scout bees as following equation. ) ( ) 1 , 0
( i i
i
s l rand u l
n = + × − (14)
where
u
iandl
iare upper and lower bound of the nsscout bees.These initial populations mustbe feasible candidate solutions that satisfy the constraints. Set NC=0.
Step 2: Evaluate the fuel cost and emission fitness value of the initial populations.
Step 4: Separate the m best solutions to two groups, the first group are e best solutions by using random selection and another group is other selected
e
m− solutions.
Step 5: Determine the size of neighborhood search of each best solutions (ngh).
Step 6: Generate neighborhood solution (
n
ngh) around the selected solutions within neighborhood size as following equations.)
(
)
1
,
0
(
,e e i i
ngh
n
rand
ngh
u
l
n
=
+
×
×
−
(15)For best solutions and
nngh,m−e=nm−e+rand(0,1)×ngh×(ui−li) (16) For other selected solutions.
Step 7: Evaluate the fuel cost and emission fitness value of the generated solution.
Step 8: Search for nondominated solutions from all solution by using nondominated function in order to get the Pareto set. If nondominated solution is over the limit, then uses FCM.
Step 9: Check the stopping criterion. If satisfied, terminate the search, elseNC=NC+1.
Step10: Assign the n−m population to generate new solutions and add it with last best solution. Go to Step 2.
Upon the Pareto-optimal set of nondominated solution, fuzzy-based mechanism is imposed to extract the best compromised outcome.
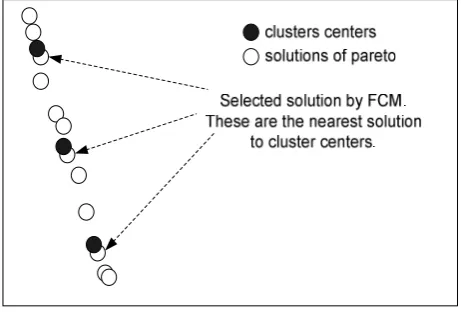
B. Reducing Pareto set by FCM clustering
Fuzzy c-means (FCM) is a data clustering technique in which a data set is grouped into n clusters with every data point in the dataset belonging to every cluster to a certain degree [10]. For example, a certain data point that lies close to the center of a cluster will have a high degree of belonging or membership to that cluster and another data point that lies far away from the center of a cluster will have a low degree of belonging or membership to that cluster. It is based on minimization of the following objective function:
∑∑
= =
∞
<
≤
−
=
Ni C
j i j
m ij
m
u
x
c
m
J
1 1
2
1
,
(17)where
m
is any real number greater than 1,u
ijis the degree of membership ofx
i in the clusterj
,x
i is thei
thof d-dimensional measured data,c
jis the d-dimension center of the cluster, and is any norm expressing the similaritybetween any measured data and the center. Fuzzy partitioning is carried out through an iterative optimization of the objective function shown above, with the update of membership
u
ij and the cluster centersc
j by:∑
=
−
⎟
⎟
⎠
⎞
⎜
⎜
⎝
⎛
−
−
=
C
k
m
k i
j i ij
c
x
c
x
u
1
1 2
1
(18)
∑
∑
= =
=
Ni m ij N
i i m ij j
u
x
u
c
1 1
.
(19)
This iteration will stop when
max
{
( +1)−
(k)}
<
ε
ij k ijij
u
u
,ε
is a termination criterion between 0 and 1, whereas
k
is the iteration step. This procedure converges to a local minimum or a saddle point ofJ
m.By iteratively updating the cluster centers and the membership grades for each data point, FCM iteratively moves the cluster centers to the “right” location within a data set. Once the cluster centers have been obtained, the nearest solution to each center is selected, and the other solutions are eliminated. Reducing Pareto set by the FCM method is shown as Fig 1.
Fig. 1: the FCM method for reducing Pareto set
C. Best Compromise Solution
[image:3.595.311.542.458.614.2]⎪
⎪
⎩
⎪
⎪
⎨
⎧
≥
≤
>
>
−
−
=
max min
min max
min max
max
0
1
i i
i i
i i i i i
i i
i
F
F
F
F
F
F
F
F
F
F
F
u
(20)
In the above definition,
F
imax andF
imin is the value of the maximum and minimum in the objective functions, respectively. It is evident that this membership function indicates the degree of achievement of the objective functions. The function shape is depicted in figure 4. For every nondominated solutionk
, the membership function can be normalized as follows:
∑
∑
∑
= =
=
=
Oi i k S
k O
i i k k
u
u
u
1 1
1 (21)
where
O
andS
are the number of objective functions and the number of non-dominated solutions, respectively. The solution with the maximum membershipk
u
can be seen as the best compromised solution.D. Implementation
The proposed MBO technique has been developed in order to make it suitable for solving nonlinear constraints optimization problem. A computation process will check the feasibility of the candidate solution in all stage of the search process. This ensures the feasibility of the nondominated solution.
The proposed MBO technique was tested on IEEE a 30-bus 6-generator test system. The detailed data are given in [9]. The values of fuel cost and emission coefficients are given in Table I.The MBO is computed by Pentium core 2 duo 2.0 GHz processor 2 GB ram under MATLAB™ program.
Table I
Generating unit fuel cost and emission coefficients.
Unit
G
1G
2G
3G
4G
5G
6Pmin 0.05 0.05 0.05 0.05 0.05 0.05 Pmax 0.50 0.60 1.00 1.20 1.00 0.60
Cost
a 10 10 20 10 20 10
b 200 150 180 100 180 150
c 100 120 40 60 40 100
Emission
α 4.091 2.543 4.258 5.326 4.258 6.131
β -5.554 -6.047 -5.094 -3.550 -0.5094 -5.555
γ 6.490 5.638 4.586 3.380 4.586 5.151
i
ξ 2.0E-4 5.0E-4 1.0E-6 2.0E-3 1.0E-6 1.0E-5
i
λ 2.857 3.333 8.000 2.000 8.000 6.667
E.WIND FARM
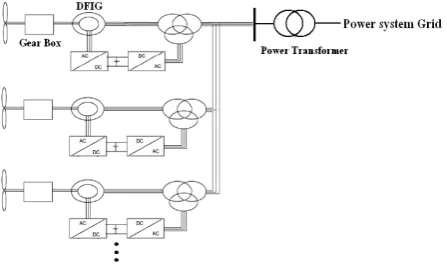
Wind farm consist of a number of wind turbines connected to bus of power system topology through power
[image:4.595.306.530.195.327.2]transformer. Wind turbines use a doubly-fed induction generator (DFIG) consisting of a wound rotor induction generator and an AC/DC/AC IGBT-based PWM converter. The stator winding is connected directly to the 60 Hz grid while the rotor is fed at variable frequency through the AC/DC/AC converter. The DFIG technology allows extracting maximum energy from the wind for low wind speeds by optimizing the turbine speed, while minimizing mechanical stresses on the turbine during gusts of wind. The optimum turbine speed producing maximum mechanical energy for a given wind speed is proportional to the wind speed. For instance, wind farm is shown in Fig.1
Fig.2 wind farm with many wind turbines connect to power system
In this paper, cost and emission coefficients of wind farm are zero. Large wind turbine is selected to produce electric power up to 1.5 MW. Minimum capacity of wind farm is set as 4.5 MW or 3 wind turbines and
Maximum capacity of wind farm is set as 105 MW or 70 wind turbines. These wind turbines run at speed of wind as 12 m/s.
IV. RESULT AND DISCUSSION
Case 1: best fuel cost and emission of power system without wind farm
[image:4.595.314.538.569.704.2]Fuel cost and emission objective are optimized to find the best solution by using MBO Algorithm when wind farm is not penetrated into power system network. Its result is shown in Table II.
Table II
Results of best solution of the proposed approach without wind farm
Unit (MW) Best solution
PG1 114.165
PG2 63.942
PG3 20.289
PG4 30.381
PG5 28.192
PG6 33.782
Total of thermal units
(MW) 290.751
Fuel Cost($/h) 847.430
Emission(ton/hr) 0.245
Case 2: best fuel cost and emission of power system with wind farm penetration
Table III
Results of best solution of the proposed approach with wind farm on IEEE 30 bus test system
Unit (MW) with wind farmBest solution
PG1 48.454
PG2 34.443
PG3 30.439
PG4 29.079
PG5 16.122
PG6 28.612
Total of thermal units
(MW) 187.149
Fuel Cost($/h) 541.52
Emission(ton/hr) 0.209
Wind farm
Location (Bus) 7
Size (MW) 99.73
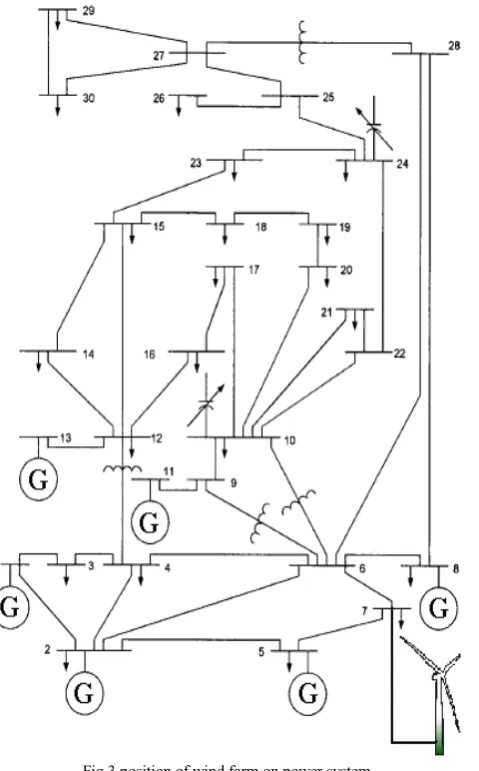
[image:5.595.63.277.86.268.2]Table III shows the power generation and wind farm position optimized by the MBO technique. The result in this case has cost and emission lower than previous case. Wind farm which is penetrated into IEEE 30 bus test system can reduce fuel cost and emission of pollution as 305.91 $/h and 0.036 ton/h respectively.
Fig.3 position of wind farm on power system
Wind farm is connected to power system at bus 7 in Fig 3. Capacity of wind farm is 99.73 MW or approximately 66
wind turbines. This value is high penetration of wind farm on test system.
[image:5.595.306.556.88.252.2]
Fig.4 Best solution on tradeoff surface with wind farm in power system
The best solution in tradeoff surface is selected by fuzzy compromise method in Fig 4.
V. CONCLUSION
In this paper, MBO algorithm has been proposed to find best location and sizing of wind farm on power system with minimum economic and emission of generations. Wind farm is formulated in form of doubly fed induction generators to inject electric power into power system. The simulation result demonstrates that wind farm in optimum sizing and location can reduce fuel cost and emission pollutant of generations. In addition, the result indicated that MBO have effectiveness to search optimum point of wind farm on power system topology.
REFERENCES
[1] Z. Chen, F. Blaabjerg, Wind farm--A power source in future power systems, Renewable and Sustainable Energy Reviews, Volume 13, Issues 6-7, August-September 2009, Pages 1288-1300
[2] Chyou-Jong Lin, Oliver S. Yu, Chung-Liang Chang, Yuin-Hong Liu, Yuh-Fa Chuang, Yu-Liang Lin, Challenges of wind farms connection to future power systems in Taiwan, Renewable Energy, Volume 34, Issue 8,2007
[3] R. Saidur, M.R. Islam, N.A. Rahim, K.H. Solangi, A review on global wind energy policy, Renewable and Sustainable Energy Reviews, Volume 14, Issue 7, September 2010, Pages 1744-1762 [4] Lotfi Krichen, Houssem Ben Aribia, Hsan Hadj Abdallah, Abderrazak Ouali, ANN for multi-objective optimal reactive compensation of a power system with wind generators, Electric Power Systems Research, Volume 78, Issue 9, September 2008, Pages 1511-1519 [5] D.T. Pham, A. Ghanbarzadeh, E. Ko็, S. Otri, S. Rahim, M. Zaidi, D.T. Pham, E.E. Eldukhri, A.J. Soroka, The bees algorithm -- A novel tool for complex optimisation problems, Intelligent Production Machines and Systems Oxford: Elsevier Science Ltd. (2006) 454-459. [6] Tahir Sag, Mehmet Cunkas, A tool for multiobjective evolutionary algorithms, Advances in Engineering Software, Volume 40, Issue 9, September 2009, Pages 902-912
[7] J. Kennedy and R. Eberhart, “Particle swarm optimization”, Proceeding of the 4th IEEE International Conference on Neural Networks, pp. 1942- 1948, 1995.
[8] M. A. Abido, Optimal power flow using particle swarm optimization, International Journal of Electrical Power & Energy Systems, Volume 24, Issue 7, October 2002, Pages 563-571
[9] Alsac O, Stott B. Optimal load flow with steady-state security. IEEE Trans Power Apparatus Syst 1974;93(3):745–51.
[10] F. Mendoza, J.L. Bernal-Agustin, J.A. Dominguez-Navarro, NSGA and SPEA applied to multiobjective design of power distribution systems, IEEE Trans. on Power Systems 21 (2006) 1938-1945.
0.2 0.205 0.21 0.215 0.22 0.225
300 400 500 600 700 800 900
ENVIRONMENT(ton/h)
F
u
e
l C
o
s
t (
$
/h
)
Trade off surface w ith w ind farm
[image:5.595.55.295.357.743.2]