MAKING SENSE OF WEB 2.0 TECHNOLOGY:
DO EUROPEAN STUDENTS USE THE SOCIAL MEDIA
APPLICATIONS FOR EDUCATIONAL GOALS?
Eze Ezekiel Onyebuchi
Towards fulfillment of the Master Degree in Communication Studies
Faculty of Behavioral Science University of Twente
Supervisors: Dr. Sjoerd de Vries
Dr. Piet Kommers
Abstract ... iii
Acknowledgements... iv
List of Abbreviations ... v
List of Tables ... vi
List of Figures ... vii
Chapter One Introduction ... 1
1.0 Introduction... 1
1.1 Research Motivation ... 1
1.2 Immediate concerns ... 2
1.3 Research Objectives... 3
1.4 Research questions... 3
Chapter Two Literature Review... 4
2.0 Introduction... 4
2.1 Experimented educational applications of web 2.0 tools... 4
2.2 Educational potentials of web 2.0 applications... 6
2.3 Concerns over the use of web 2.0 applications for educational goals ... 6
2.4 Summary of the literature review ... 7
2.5 Theoretical Framework and hypothesis ... 7
2.6 Conceptual model ... 12
Chapter Three Research Methodology ... 16
3.0 Introduction... 16
3.1 Research Design... 16
3.2 Target Population... 17
3.3 Sampling and sampling procedure... 17
3.4 Limitations of sample ... 17
3.5 Research Instruments ... 17
3.6 Questionnaire ... 18
3.7 Piloting and Validation of questionnaire ... 19
3.8 Data collection procedure ... 19
3.9 Reliability of instruments... 19
Chapter Four Data Analysis... 21
4.0 Participants...Fout! Bladwijzer niet gedefinieerd. 4.1 Data analysis ... 22
4.2 Overall analysis of relationships... 22
4.3 Regression analysis to study the mediating effect of Hodstede dimensions ... 23
4.4 Limitation of the study... 23
4.5 Ethical consideration... 23
Chapter Five Results ... 24
5.0 Introduction... 24
5.1 Current use of social media in higher education... 24
5.2Testing for the mediating effects of Hofeste’s dimensions ... 31
Chapter Six Discussions ... 35
6.0 Introduction... 35
6.1 Discussion of the first research question ... 35
6.2 Discussion of the second research question... 36
Chapter Seven Conclusion... 39
7.0 Introduction... 39
7.1 Summary and implication of the first research question ... 39
7.2 Summary and implication of second research question... 39
7.3 Summary and implication of the third research question ... 39
7.4 Practical Implications... 40
7.5 Implication on Theories ... 41
Chapter Eight Recommendations ... 42
8.0 Recommendation ... 42
8.2 Recommendation to higher institutions, government and organizations... 42
References... 1
Appendix A... 8
Abstract
The role of web 2.0 applications and more specific social media in e-learning is growing. The use of Wikipedia, YouTube, Flickr, Slideshare and Delicious is becoming accepted as shared information sources in current education. Facebook, Naymz, Twitter and blogs give access to detailed personal information and thematic insights of relevant researchers and professionals and offer opportunities for immediate online conversations. However, there is still limited research into this use, the effects on education and the factors and characteristics that steer the use and effects of these applied social media.
Acknowledgements
This thesis would not have been possible without the assistance, support and patience of my mentor, Dr Sjoerd de Vries, not to mention his advice and sound knowledge of social media applications. The good advice, support, friendship and critical evaluation of my second mentor, Dr Piet Kommers, has been helpful on both personal and an academic point of view, for which I am highly grateful.
The knowledge I garnered from great scholars of communication studies, University of Twente, new media research and design track provided the knowledge base for this thesis and helped me to complete the study. I remain indebted to these great minds, Professor Michael Sheehoulder, Dr Thea van der Geest, Dr Joyce Karreman, Dr ben Allouch, Dr H.J. Vos and Dr Kaap, H.G.van der.
The administration of questionnaire in the sampled institutions would not have been possible without the support and commitment of researchers who agreed to collaborate in the study. Professor Paul van Schaik, Dr Stephen Farrier, Dr Win Tielem, Dick van der Meulen, Dr Ivo van den Berk, Mr. Paul Willems, Mr. Willee Boog, Ms Ekpo, Dr Hillary Ohagwu and Mr. Johan Jonker were of great help.
Things work well when you enjoy the support of caring individuals. I will forever remain thankful to Ms Dioysia Loman, Dr Mark Tempelman, Mr. Frank Lansink, Engr A. Mama, Mr. Eze Livinus, Mr. Eze Romanus, Pharm Eze Joe, Ms Alice Eze, Mr. Okechukwu Ugwu, Mr. Emeka Mama, Mr. Jude Urama, Anna, Mama Chigbo, Obunwa, Lousia, Gloria, Edwin, Sunday, Martina, Emeka, Benedict Okanjo, Ada, Emeka Ezeugwu, Sunday Odo, Dr Ms. Babalola, and Chidex for their support and care. I appreciate the love and cooperation I enjoyed from my Holland friends, Maja, Emeka, Ekpo, Paul, Fanny, Tiblets, Firew and Amy.
List of Abbreviations
AGM - Annual General Meeting
C-TAM-TPB - Combined Technology Acceptance Model and Theory of Planned Behavior
CB - Control Belief
CI - Community Identity
CDI - Cultural Dimension Indexes
EE - Effort Expectancy
EIS - Executive Information Systems
ELIG - European Learning Industry Group
EU - European Union
GSS - Support Group Systems
ICT - Information and Communication Technology
IDI - Individualism Index
IDT - Innovation Diffusion Theory
IT - Information Technology
IU - Intention to Use
KDF - Key Determinant Factors
LTO - Long – Term Orientation
MI - Masculinity Index
MM - Motivational Model
MMO - Massively Multiplayer Online
MPCU - Model of PC Utilization
NC - National Culture
PDI - Power Distance Index
PE - Performance Expectancy
SCT - Social Cognitive Theory
SF - Social Influence
SM - Social Media
SMS - Short Messaging Service
TEP - Technological Experience
TAM - Technology Acceptance Model
TAM - Technology Acceptance Model 2
TPB - Theory of Planned Behavior
TRA - Theory of Reasoned Action
UB - Use Behavior
UDI - Uncertainty Avoidance Index
UTAUT - User Acceptance of Information Technology
List of Tables
Table 1 - Hofstede’s Cultural Dimensions Table 2 - Reliability of subscales
Table 3 - Distribution of participants across participating institutions
Table 4 - Students perceptions of the impact of social media applications on Learning comparing Dutch and United Kingdom institutions Table 5 - Students perceptions of the impact of social media applications on
List of Figures
Figure 1 - UTAUT Model
Figure 2 - Basic Social Media Model
Figure 3 - Current Use of Social Media in Higher Institutions
Figure 4 - Frequency of Use of social Media for Educational Activities Figure 5 - Students Preference of Applications to Learn through Figure 6 - Students preference of Applications to Learn through Figure 7 - The most Use Social Media Application in Institutions Figure 8 - What Students Use the Social Networking Sites for
Chapter One
Introduction
1.0 Introduction
The use of social media for educational purpose is a rather new idea, and a huge opportunity for higher education and lifelong learning, its potential is still to be exploited. Several universities have set up podcasting but literature is still poor, case studies and evaluations inadequate. No concerted combined efforts have been made to explore the relevance and beneficial consequences of web 2.0 in education.
In depth investigation of the relationship between web 2.0 technology and learning in higher education are still rare. No research known to us has carried out a large scale exploration of educational uses of web 2.0 applications in Europe. The little research attempts made by Huffaker (2006), Quible (2005) and Selingo (2004) which are all referenced in Ullrich et al. (2008) rather discussed a number of interesting possibilities for the use of blogs. Lazzari (2007) described an experience of educational podcasting limited to a group of students studying the course multimedia communication and human-computer interaction. Berners-Lee (1999), Berners-Lee, Hendler and Lassila (2001) both in Ullrich et al. (2008) only explored the potentials of web 2.0 in research and learning. Till date, no documented study known to us has attempted to investigate effects of national culture on the intention to use the social media for educational goal.
Our purpose with this current study then is to know if students in European higher institutions use the social media for educational purposes. In addition, we want to know whether national culture has effect on intention to use the social media as well as the students’ perceptions towards social media tools. In doing that, we will attempt to provide answer to crucial research question; do students of European higher education use the social media for educational goals?
1.1 Research Motivation
At European Council in Lisbon in March 2000, the European Union (EU) set the following challenging objective for Europe to become by 2010.
“The most competitive and dynamic knowledge based economy in the world, capable of sustainable economic growth with more and better jobs and greater social cohesion.” The Council then demanded that new educational and training systems be adapted to meet the ambitious target, placing this demand at the hierarchy of the political agenda (Reding, 2000).
information infrastructure, and widespread availability of broadband access at competitive prices.
Notwithstanding these concerted and lofty efforts to improve access, and use of the internet for education and training purposes – a senior policy adviser to The European Learning Industry Group (ELIG), Elmar Husmann is not satisfied with the level of achievement recorded so far. He told delegates at the AGM held in Oct., 2008 at Sestri Levante, Italy, hosted by Giunti Labs that ELIG needs to re-think its positioning with regards to EU. Husmann stated that “e-learning has disappeared from the EU policy agenda”. He also demanded that a broader vision of next generation learning enabled by information and communications technology to be taken. The prime area according to Husmann will include “supporting informal learning and knowledge creation via social network” (Little, 2008).
Husmann’s last statement clearly demonstrates an oversight on the part of researchers. It brings to limelight the void created by dearth of research attempt to exploring the use effects of social media in distance education.
1.2 Immediate concerns
Apart from small scale studies, each designed to experiment if one form of social media application or the other will be suitable for educational context; no research study has been conducted to explore the general use of social media applications in European higher institutions.
Studies to assess the widespread of these new kinds of online activities in day to day digital lives of European learners are still lacking. Research efforts made so far (Selwyn 2007; Sauchuez 2008; Reuben 2008; Cole 2009; & Lazzari 2009) all concentrated on a small group of students as case studies to test if a particular kind of social media application suits a particular educational purpose or not. None of these studies worried to discuss at a large scale the perception of or what stimulates intention to use the social media applications for educational goals among students’ in European higher institutions.
In summary, there are concerns to assess if students of European higher education use the social media for educational goals, and to consider the effect of culture on intention to use social media as culture shapes learners values, perceptions, and goals Valcke et al (2008).
1.3 Research Objectives
• To stimulate research interest in this new domain, by attempting to fill the void
created by lack of research effort on use of social media in European higher education.
• To investigate the similarities and differences between the two perspectives of Dutch institutions and United Kingdom institutions on a host of issues related to use of social media applications in higher education.
• To determine the contribution of culture on the students’ intention to use social media in higher education.
• To use the findings to make recommendations on the adoption of social media to higher institutions of learning, the European Learning Industry Group (ELIG), and other concerned organizations, including European government.
1.4 Research questions
Thefollowing fundamental guiding questions are at the centre of this inquire:
(a) Do students of European higher institutions use the social media for educational Purpose? If they do, what is their perception of social media applications on learning outcomes?
(b) Are there differences in distribution of social media use in European higher institutions?
Chapter Two
Literature Review
2.0 Introduction
With regards to the research questions, the review of literature was guided by the fundamental concern as it relates to the use of the social media in higher institutions. Exploration and in depth study of literature underscores the importance of reviewing the potentials, and relevance of web 2.0 applications in education. A review of similar studies on the educational relevance of web 2.0 tools is carried out to obtain insights and guide the interpretation of results.
The chapter is a review of literature structured into four sections. Section 2.1 reviews research efforts made to evaluate the educational applications of web 2.0. The aim of the review is to gain insights into the nature and various ways web 2.0 applications can be applied to educational use. Section 2.2 presents documented opinions about potentials of web 2.0 with regards to learning. The third section, 2.3, discusses the major concerns over the use of social media for educational purposes. A summary of the review is provided in the last section.
2.1 Experimented educational applications of web 2.0 tools
The growing number of web 2.0 applications and the associated number of individuals who are making use of them especially the students, have continued to raise the consciousness of researchers as well as educators on the possibilities of utilizing the applications for educational goals. According to Allen (2004), web 2.0 applications are getting extreme attention across the entire sectors of education industry. Researchers are of the opinion that the existence of the new web 2.0 applications and technologies are creating more opportunities for efficient learning and have the possibility to aid lifelong competence development (Klamma et al, 2007). Research efforts made so far underscores the relevance of web 2.0 and social media applications for educational goals.
Recent study by Selwyn (2007) as cited in Selwyn (2009) of undergraduate students’ use of facebook in United Kingdom hint that facebook use is fundamentally informal and frequently at a tangent with the official learning objectives of the educators. The study revealed that while facebook can be used to satisfy a number of useful educational purposes, these are not peculiar with formal education expectations. The data generated from the study shows that facebook could act as significant site for informal cultural learning of being a student, with online interactions, admitting roles to be learnt, values understood and identities shaped (Selwyn, 2007).
which included a group of students offering a course on multimedia communication and human computer interaction, indicates that the quantitative analysis of the student’s exam result did not provide significant evidence for its impact on learning (Lazzari, 2009).
An elaborate experimental study that explored the relationship between learning styles and web 2.0 utilization (Selwyn (2007), showed a significant correlation coefficient between learning styles and web 2.0 utilization. The result of the study revealed that students found web 2.0 tools to be easy to use and are confident in using online community tools, and video sharing applications. Fact generated from the correlation analysis indicates that learners were more comfortable in deciding which of the web 2.0 applications to use based on social view point. An evaluative study by Sauchuez (2007) using focused group of eighteen users to gauge experience with second life found that learners expressed an affinity with the social learning activities in second life; they learnt in this learning space and at same time loved the interaction with avatars of other learners.
A cross national survey of university students by Reuben (2008) found that social media applications are currently being used in institutions of higher learning for marketing and communication goals. The result of the survey indicates that students admit that the tools are used in communicating with current students; reaching out to alumni, and for recruitment purpose. The study concluded by acknowledging that blogs remains the most popular social media application used for recruitment purpose in higher institutions.
Ullrich, Borau, Luo, Tan, Shen and Shen (2008) experimental study explains why web 2.0 is good for learning and for research. The study demonstrates that web 2.0 services indeed stimulate active participation among learners. Findings indicate that micro-bogging provides a number of possibilities and benefits which differ from the standard classroom interaction. From a linguistic perspective, the study concludes that micro-blogging is a communicative approach to teaching and learning of alien language.
Based on the fact that social media applications are many, they aggregate to serve specific educational goals for the users. The email, instant messaging systems (SMS), and skype are used for communication purposes among scholars. The tools are used to exchange information, thereby facilitating learning. Blogs, video wiki, feedback, and feeds on feeds on the other hand are used for publishing and sharing contents. These tools in combination with asynchronous and synchronous communication tools are used to take on and manage the learning challenges of self-direction, social networking and collaboration (Grodecka, Wild & Kieslinger, 2008).
interaction and reflection on how a given task should be approached (Mason & Rennie, 2006) in (Grodecka, Wild & Kieslinger, 2008).
2.2 Educational potentials of web 2.0 applications
Although limited research evidence is available to justify the adoption of web 2.0 tools for educational goals, researchers as well as educationists alike have identified a number of potentials web 2.0 technologies can offer for educational purposes.
According to Bryant (2006) in Huang et al, (2007), web 2.0 tools offer significant possibilities for learners who have several needs to enhance their learning experience through enriched interactions. This view is shared with Klamma (2007) who suggests that web 2.0 applications have tremendous potential for facilitating and enhancing lifelong learning through linking of students in collaborative environments with decrease in boundaries. Appreciating its potential, Safran, Helic and Gutl (2007) further stress the impact web 2.0 could have on the collective mental development of students. According them, web 2.0 applications have the capacity to preserve critical and analytical associational thinking, aid analogical thoughts through access to wealth of information and interaction with several view points in terms of education.
Bryant (2006) in Mcloughlin and Lee ( 2007) emphasize that social media tools have significant potential to tackle the needs of today’s diverse students, enriching their learning experiences through personalization, customizations and robust opportunities for collaboration and networking. Evaluating social media from research perspective, Anderson (2007) in his web 2.0 executive summary, reports on the potential benefits of web 2.0 tools in research field. In his view, the tools have the potential to increase communication between researchers and practitioners who have left the university. The view point expressed by Anderson collaborate the relative advantage of web 2.0 applications as captured by (Salaway, Caruso, Nelson & Ellison, 2008). According Salaway et al web 2.0 applications have the ability to aggregate information, data and thoughts from different places rapidly and with less difficulty that the material continues to be accessible to the students after they have left the university.
2.3 Concerns over the use of web 2.0 applications for educational goals
Another serious issue is the ability of young individuals to use social media applications appropriately and carefully. Study conducted by Pew (2005) as cited in Selwyn (2007) disclosed that 79% of young internet users agree that they share information online without exercising much caution. Recent survey by Lernke and Coughlin (2009) found that half of the district administrators of American K-12 schools admitted that web 2.0 applications have negative or highly negative influence on exercise and physical conditioning of the students.
Time commitment is another issue that worries experts as it pertains to web 2.0 applications and its educational use. Reuben (2008) highlights that adding social media mix to workload creeps that professionals and students deals with in higher education will result to time intensity. He cautioned that strategic reason and plan should guide social media use in education.
Information overload is among the issues that dominate the mind of experts as it concerns use of the social media or web 2.0 applications for educational purpose. As Reuben (2008) points out, advent of social media has produced many kinds of media, that those who follow blogs, Twitter, facebook etc in order to contribute can easily find themselves being overloaded with information.
2.4 Summary of the literature review
This subsection provides a summary of the literature on the use of social media for educational purpose in higher education.
The literature illustrates that though empirical evidence is building up to establish the usefulness of social media or web 2.0 applications in education, most of the studies for now are still at the experimentation stages to see if the applications of the tools in education will be profitable. Research studies on the general and actual use of the social media applications or web 2.0 technologies in the higher education system in European institutions is still lacking. In addition, none of these studies reviewed made attempt to experiment on the effect of culture on students’ intention to use the social media. The oversight buttresses Joo (1999) claims that ethical and cultural issues as it relates to Internet use have been largely relegated in education.
The literature on the potential benefits of web 2.0 tools in learning and education holds high hope among researchers and educators alike. The literature indicates that evidences are still lacking to establish these potentials, as no sensible discussion is available yet that can explain the widespread of these new forms of online activities in the day to day digital lives of the learners, and educators as well.
The literature suggests that some individuals are still skeptical and are concerned over the negative implications adoption of web 2.0 technologies for educational goals would have, if adequate measures are not taken to mitigate the flipside of the benefits of the applications.
2.5 Theoretical Framework and hypothesis
addressed in section 5.2. The hypotheses for the three research questions are stated in the section 5.3.
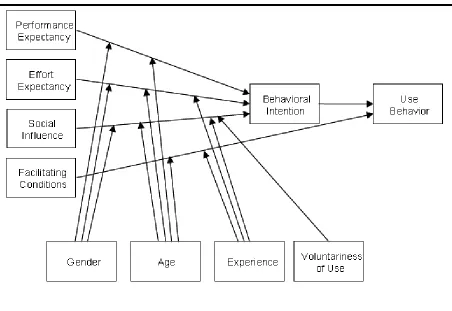
[image:16.595.90.542.317.628.2]The empirical study by Venkatesh, Morris, Davis and Davis (2003) renders a useful staring point for framing our discussion of conceptual model since it adopted sets of determinants and moderators, impacting individual’s intention to use information technology. Using eight outstanding models (1) Theory of Reasoned action (Sheppards et al., 1989), (2) Technology Acceptance Model (Venkatesh & Davis, 2000), (3) Motivational Model (Vallerand, 1997), (4) Social Cognitive Theory (Bandura, 1986), (5) Innovation Diffusion Theory (Rogers, 1995), (6) Theory of Planned Behavior (Ajzen, 1991), (7) Combined Technology Acceptance Model and Theory of Planned Behavior (Taylor and Todd, 1995), and (8) Model of PC Utilization (Triandis, 1977) as an underlying framework, Venkatesh et al conceptualized User Acceptance of Information Technology (UTAUT) as a unified view.
Figure 1: Research Model Venkatesh et al. 2003
voluntariness of use). Venkatesh et al sampled for heterogeneity across technologies, industries, business functions, and nature of use (voluntary vs mandatory) to test the model. The empirical validation of UTAUT in the longitudinal study (Venkatesh et al, 2003) found the theory to account for 70% of variance in usage intention.
Follow-up studies in recent years still portray the robustness of the model. Yu, Tao and Yang (2007) used UTAUT to explore the behavior of 3G mobile communication users, and found that three of its constructs, performance expectancy, social influence and facilitating conditions were significant in predicting the behavior of users. A study by Alawadhi and Morris (2008) on the use of UTAUT model in the adoption of e-government services in Kuwait also validated three key factors of the model as predictors of intention to adopt the service. Research study by Oshlyansky, Carins and Thimbley (2007) validated UTAUT tool cross-culturally. These studies point to the effectiveness of the model.
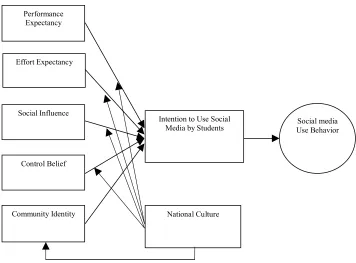
Based on the insight derived from venkatesh et al (2003) theorizing and empirical analysis, and the recent validation of the key constructs of UTAUT, we will utilize three of UTAUT constructs (performance expectancy, effort expectancy and social influence) in our study. We will build upon Venkatesh et al (2003) framework to develop a Basic Social Media Model of scholars’ usage of social media for educational purpose by adding two constructs (control belief, and community identity) as additional factors that influence the intention to use social media in higher education. We belief that accessibility to the Internet, cost effectiveness of IT and access, relaxed ethical regulations and government policy will induce European students to use the social media in education. On the other hand, the tendency of students’ identifying a community identity by their common interests and needs in web 2.0 environment will motivate them to use the social media in learning.
Unlike Venkatesh et al, we introduce cultural dimensions to conceptualize the basic social media model that will elaborate the mediating effects of those dimensions on intentions to use the social media in higher education. Considering the mediating effects of culture on the use of social media in distance higher education is imperative because of the cultural significance of our study that is comparing the perspectives of Dutch institutions and United Kingdom institutions on issues relating to use of social media in higher institutions. Researchers in the past have acknowledged the role as well as the value of culture on the attitudes of individuals towards information technology. Culture is considered a vital factor that influences individuals’ acceptance and use of Internet based learning resources (Collis, 1999) in (Li & Kirkup, 2007). Researchers, who study cross-cultural factors in IT use, agree that understanding a national culture (NC) is paramount to learning behavioral attitude towards information technology.
determining their attitude towards computers. Computer attitude scales developed to rate peoples’ attitude towards computers, showed a significance difference in the scores of college students from United States versus Kuwait (Omar, 1992). Research efforts to understand the cultural significance of several communication technologies, including electronic meeting systems, e-mail, support group systems (GSS), videoconferencing, and a new breed of systems providing asynchronous support for group collaboration was made by Clark, Downing and Coleman (1996) as appreciated in (Gallivan & Srite, 2003).
The cultural difference between countries as it pertains to information technology acceptance is a highly researched domain. Leider, Carlsson, Elam and Corrales (1999) examined the influence of cultural differences on perceptions of executive information systems (EIS) use and decision outcome. Png, Tan and Wee (2001) compared the adoption of frame relay, a type of IT infrastructure between Japan and U.S using Hofstede’s cultural framework, while Straub (1994) surveyed the effect of culture on IT diffusion of email and fax in U.S and Japan. These studies significantly show that culture is an important concept when it comes to the use of ICT. The concept of culture we are using in this study is based on the work of Dutch anthropologist Geert Hofstede who views culture as “a system of collectively held values.” Hofstede (1980) introduced a model of national culture founded on a survey of more 120,000 respondents among staff of IBM taken from more than 50 countries and submitted four dimensions as a model to explain behavioral differences between nations. These four dimensions are: (1) Uncertainty Avoidance (UDI), (2) Individualism vs Collectivism (IDV), (3) Power Distance Index (PDI), and (4) Masculinity vs Femininity (MI). He later added Long vs Short-Term Orientation (see table 1 for more information on the five dimensions).
Table 1: Hofstede's cultural dimensions adopted from Kovacic (2005)
Power Distance PDI Power distance index is a cultural dimension developed by Geert Hofstede and it relates to the level of equality or inequality among individuals in a given country.
Individualism IDV Individualism is a cultural dimension initiated by Hofstede and it explains the level a society reinforces and respect individual or collective achievement, and interpersonal relationships that exist among people in such a society.
Masculinity MAS Masculinity is a cultural dimension developed by Geert Hofstede and it refers to the level a society reinforces, or does not reinforce, the conventional masculine work role model of male power, control assertiveness and achievement.
Uncertainty Avoidance Index
UAI Uncertainty Avoidance Index is a cultural dimension developed by Geert Hofstede and it refers to the degree to which the individuals of a culture are made nervous by situations which the view unpredictable, unclear, unknown and unstructured.
Orientation Geert Hofstede and it refers to the society’s disposition with thrift, perseverance, savings and the willingness to deprive one’s self in order to achieve a goal.
Hofstede’s framework has been widely criticized for portraying only a western way of imagining, but it still remains the most appreciated cultural model among scholars. The model has been shown to be stable and useful for a lot of studies across various disciplines. Recent study by Merkin (2006), validated Hofstede uncertainty avoidance dimension to be a strong predictor of ritualistic, harmonious, and aggressive facework strategies in embarrassing situation. Study conducted by Sornes, Stephens, Saetre and Browning (2003) on the reflexivity between ICTs and business culture confirmed the efficacy of Hofstede’s four dimensional framework of national culture. The model predicted in Sornes et al the homogenizing of ICT among cultures.
2.6 Conceptual model
In developing a conceptual model for the use of social media in higher education, one approach is to postulate that a number of determinant factors and mediating variables act in combination to process the students’ intention to use (see Venkatesh et al, 2003). An alternative perspective, which builds upon this view, and the one that we adopt in this study, is that, whereas Venkatesh et al (2003) three key factors (performance expectancy, social influence, and effort expectancy) influences intention to use, two additional factors (community identity) as explained in a proposed model for usage of social networks in education (Mazman & Usluel,2009), and (control belief) consistent with integrated research model (see Tetiwat & Huff, 2002) are also important predictors of intention to use the social media in higher education. Using this approach, we will explain these sets of factors that influence scholars’ intention to use social media in higher education. To the level that these factors can influence individual’s intention is moderated by cultural dimensions. Our theoretical framework (view fig.3) is developed in detail next.
National Culture Performance
Expectancy
Effort Expectancy
Social Influence
Control Belief
Community Identity
Social media Use Behavior Intention to Use Social
[image:20.595.130.486.366.629.2]Media by Students
2.5.2 Performance Expectancy factor
Performance expectancy factor as envisioned by Venkatesh et al (2003) is the level to which an individual thinks that using a system will aid him or her to achieve gains in job performance. Five key constructs from the different models that relate to performance expectancy are perceived usefulness (TAM/TAM2 and C-TAM-TPB), relative advantage (IDT), extrinsic motivation (MM), job-fit (MPCU) and outcome expectation (SCT). These constructs within each single model is the strongest predictor of intention and have being found to be consistently significant across studies (Venkstesh et al, 2003; Yu et al, 2007; Oshlyansky et al, 2007; Alawadhi & Morris, 2008). However, from a theoretical view point, we have reasons to expect that the relationship between performance expectancy and intention to use social media in higher education among students’ in EU higher institutions will be mediated by the cultural dimension of individualism. Van Birgelen et al (2002) in Sornes et a l., (2003) are of the view that individualistic cultures are more innovative and trusting in exchange relationships with external parties. Veiga, Floyd and Deschants (2001) in Sornes et al., (2003) adjudged that individualistic culture will perceive a new IT to be useful if it enhances performance. Individualistic cultures pay more attention to performance of the individual, and attach importance to time management. As a result any technology that can help people be more effective and productive such as the social media will be regarded highly and attractive to use in education. Studies also show that individuals in individualistic countries are at liberty to express their opinion, and therefore have the propensity to innovate and adopt ideas. Thus, we expect that the influence of performance expectancy on intention to use social media will be mediated by individualism.
2.5.2 Effort Expectancy factor
2.5.3 Social Influence Factor
Social influence is the level to which an individual comprehends that important others think he or she should use a new system. Social factor in (MPCU), image (IDT) and subjective norm (TRA, TAM2, TPB/DTPB and C-TAM-TPB) represents constructs found in social influence. Studies have shown that social influence has been a strong predictor of intention at early adoption of technology which makes the construct somewhat controversial. Study by Zmud (1982) suggests that the rate of innovation adoption is higher among culture with low power distance. Europe is a continent of low power distance. This cultural characteristic is anticipated will mediate the relationship between social influence effect on the intention to use the social media in higher education. The European scholars will be more attracted to use the social media in higher education because they feel others are using it, and by implication are expected to use it too. In a low power culture equality is the order of the day, but image is equally appreciated.
2.5.4 Control beliefs factor
Control beliefs have being described by Teliwat and Huff (2002) as one of the major factors that influence the adoption of technology for educational purpose. Control belief is the presumed feelings that access, availability and compatibility of technology with the existing value will enhance intention to use information technology. The key constructs that formed the control beliefs factor are accessibility to IT, cost of IT, availability of IT, language barrier, ethical consideration, institution policy, management support and government policy. Control belief was found to be significant in predicting intention to adopt web-based educational technology among New Zealand educators (Teliwat & Huff, 2004). The effort made by EU and the crash in the market cost of ICT related facilities, coupled with increased access to the Internet among EU nations have increased technological experience among citizens. This factor will impact on the relationship between control belief and intention to use the social media in higher education. Thus, we propose that control belief and intention to use of social media in higher education will be mediated by technological experience.
2.5.5 Community identity factor
(Mazman & Usluel, 2009). The constructs that make up community identity includes, identification, self-discovery, and maintenance of interpersonal connectivity. Although not yet subjected to much empirical test to validate the significance of the construct, we are of the opinion that masculine nature of European nations will mediate the relationship between community identity and intention to use the social media in higher education. Being a masculine continent, scholars will like to use the social media to assert their educational abilities, and maintain interpersonal connection among peers.
2.5.6 Hypotheses
To test our model we hypotheses that;
H1: We can predict that a significant number of students’ in European higher institutions use the social media for educational goals.
H2: There are significant differences in the distribution of social media use across national institutions.
Chapter Three
Research Methodology
3.0 Introduction
This chapter reports methods and techniques used in the collection and analysis of data. These comprise the research design, study population, sample and pilot testing of research instrument, data collecting instruments, and collection procedure and the method of data analysis.
3.1 Research Design
A research design is the binding factor that keeps the research project together. According to McMillan (2000), a research design is used to structure the research, and to portray how component major parts of the research function together to try to address the central research questions. The design adopted for this study comprises of analytical survey design, the correlational and causal-comparative research design.
The analytical survey according to (Gray, 2004) seeks to test a theory in the field, its goal being to test and explore associations among variables. Analytical survey as Oppenheim (1992) in (Gray, 2004) highlights assume a typical features of experimental research when it comes to handling these variables. The design approach is most suitable in a study such as this that the anticipated sample size will be relatively large.
Correlational research design as McMillan (2000) points out is used to report the statistical association between two or more variables. The correlational research design helps the researcher to establish if there is a relationship between two or more variables. In addition, it helps in determining the strength of relationship. Correlational research design will be used to establish the kind of association between the key determinant factors and the moderating factors and how they impact on behavioral intention to use social media in higher education.
According to (Creswell, 2002) causal-comparative research design is a kind of non-experimental design in which researchers attempts to discover cause-effect relationships by targeting groups of people in whom the independent variable is absent or present and then ascertaining if the groups differ on the dependent variables. This type of research design is relationship focused. Therefore the causal-comparative research design will address the differences in perceptions, motivation, and the use of the social media in higher education among the European nations.
3.2 Target Population
The target populations for this study cover undergraduate students and Master students in selected higher institutions in The Netherlands, Great Britain and Ireland. There are altogether five institutions, University of Twente, Saxion University of Applied Sciences, University of Teesside, University of Aberdeen, and University College Cork Ireland.
3.3 Sampling and sampling procedure
The sampling units are full time undergraduate students and master students of any of the departments of media and communication studies, marketing, business studies, psychology, and education department of the selected institutions. Purposive sampling was adopted in selecting the participants for the study. The purposive sampling according to Gray (2004) can give one or more trait representative of sample, which can lead to true cross section of the population. With a purposive sample, a researcher is likely to get the opinions of his target population; he also has the tendency to overweight subgroups in his population that are more readily accessible. The nature of the current study makes it the most suitable.
3.4 Limitations of sample
The sampling model, specific to institutions in the Netherlands, Great Britain, and Ireland, is not representative of other higher institutions of learning in entire Europe. Thus the results of the study and any inferences drawn may be implied only with reference to these countries surveyed.
The sample selection for the survey allows for generalizability, only to the point of these countries involved. The study measures the attitude of the students of the selected institutions in these countries and hence the imposition of the outcome of the study with reference to the three countries on entire European higher institutions is not valid. However, data available in the form of response compatibility among students from other European countries whose nations are not captured in this present study may serve to allow for generalization to other European countries.
3.5 Research Instruments
go without some advantages and disadvantages, thus, Weiss (1998) points that the quantitative method has the benefit of permitting the researcher to attain conclusions with a known level of confidence about the extent and making of exact statements. The positive advantage of the method will be utilized in this study.
Research instrument used for this study was questionnaire. The questionnaire was used to elicit reliable and valid data as far as perceptions of social media in higher education in European countries are concerned.
3.6 Questionnaire
The questionnaire was composed largely of closed-ended questions focusing on factors that contribute to the use, and use of social media applications in higher institutions. It is grouped into three sections. The first part consists of validated instruments adapted from prior studies used to measure performance expectancy, effort expectancy, social influence, control belief, community identity and behavioral intention. The items used to measure performance expectancy, social influence and effort expectancy, were adapted from Venkatesh et al., (2003). Some of the items used in this section include items like, I find the social media useful, using the social media enables me to accomplish most of my educational task quickly, I find social media easy to use etc. Students are required to rate these items in a 5 point scale raging from strongly disagree = 1 to strongly agree = 5. The items for behavioral intention and user behavior constructs were adapted from Moon and Kim (2001) research work. These items have been modified to make them relevant to the social media context.
The second part of the questionnaire includes questions adapted from Hofstede’s cultural dimensions items, altered to suit social media context. Students are expected also to rate items in this section on a 5 point scale raging from strongly disagree = 1 to strongly agree = 5. Some of the items used in this section include; it is important to me that I contribute more than others in group discussion of my social network, I am skillful in using the web to download podcast, an institutions’ ICT policy can be broken when a students think it is to his best interest, Both men and women are often rationale in contributions they make in a social networking group.
3.7 Piloting and Validation of questionnaire
Researchers have expressed concern on the relevance of piloting and validating research questionnaire. Gillham (2000) in Gray (2004) propose that it is proper to pilot at least 50 per cent more questions than one requires so that unreliable and incomprehensible questions can be eliminated. Gray (2004) further stresses the importance of piloting, and argued that basically all the content of the questionnaire should be taken into consideration when piloting a questionnaire.
For the purpose of this research study, the questionnaire was tested using 10 students that shares similar characteristics with the target respondents, who filled the questionnaire in the presence of the researcher and made valuable suggestions that could improve the quality of the questions. The questionnaire was further scrutinized by two experts that raised relevant issues bordering on the length of the questionnaire, quality of questions on individual items, redundancy of questions, tone, presentation, and formality or informality of the questions. Adjustments were made accordingly before the questionnaire was administered.
3.8 Data collection procedure
In order to solicit maximum cooperation from the respondents, contacts were made with University researchers who have interest in social media to enlist students for participation. The link to the online questionnaires was delivered to participants through the email address of the students enlisted. This method helped to reduce cost and ensured high response rate as most participants’ prefer online response compared to pencil and paper method.
3.9 Reliability of instruments
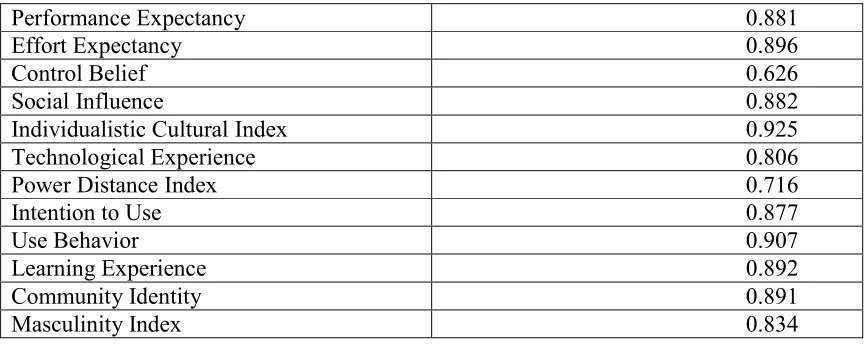
The first analysis is to measure the reliability of the instruments. Data from 385 respondents were used for this purpose. There are some respondents who did not give answers for some items. These missing values are replaced by the mean score of the data on that item and used for statistical analysis. The reliability of all scales was probed by computing a cronbach’s alpha. Represented in Table 2 is the result of the reliability test
Table 2: The reliability of subscales
Scale Reliability: Cronbach’s alpha
Performance Expectancy 0.881 Effort Expectancy 0.896 Control Belief 0.626 Social Influence 0.882 Individualistic Cultural Index 0.925 Technological Experience 0.806 Power Distance Index 0.716 Intention to Use 0.877 Use Behavior 0.907 Learning Experience 0.892 Community Identity 0.891 Masculinity Index 0.834
Chapter Four
Data Analysis
4.0 Participants
The online questionnaires were administered to University students in Germany, the Netherlands, United Kingdom and Ireland. The students were recruited through the help of researchers who agreed to collaborate in the study.
A total of 385 respondents made attempt or filled the online questionnaire. Only those institutions that had up to 18 respondents that completed the questionnaire were left in for our analysis (View table 3). This meant that Northumbria University with (9) respondents, Hamburg University (7), and Bochum University (4) were not used in for further analysis. Of the remaining sample, participants were included in the analysis if their questionnaires were completed and no suspect data pattern were found; that is questionnaires with more than five questions missing or questionnaires were the participants gave the same answer to all questions were thrown away. In the same manner, only European native participants in the institutions sampled were used in the analysis to ensure a true representative, homogenous European culture in the sample. In all, a total of 237 participants representing (61.6%) met our selection requirements. Table 3 gives a resume of the data collected from those institutions that met the selection requirements.
Table3: Distribution of participants across Participating institutions.
Name of the Institution Total sample Rejected data Used data
Saxion University of Applied Science 115 68 47
University College Cork Ireland 84 11 73
University of Teesside 44 26 18
University of Twente 101 24 77
University of Aberdeen 21 1 20
Total 365 128 237
males with mean age of (M = 2.4956) and (SD = 0.53659) fully completed the questionnaire among participants of Dutch institutions.
4.1 Data analysis
The analysis was done at the participant’s level with scores for each participant against each measurement constituting the unit of analysis. The key determinant factors, cultural dimension indexes, use intention, use behavior, and learning outcome scores are represented by independent scores for each participant.
The analysis was based on the summary measures of Dutch institutions participants’ assessment, and United Kingdom institutions participants’ assessment. The grading on the 73 rating items was summarized as a total score for each participant. The expression of responses to scores was based on the preset and evaluated scale of 1- 5, where the response strongly disagree = 1, disagree = 2, neutral = 3, agree = 4, and strongly agree = 5. The participants’ rating was hence computed over a total weighting for each of the item. Averages were computed for rating items on the participant questionnaire matching to the indicators represented in the questionnaire.
4.2 Overall analysis of relationships
In order to investigate if students of European higher institutions use the social media for educational goals, their perceptions of the social media as it relates to learning, and to assess similarities and differences across higher institutions, the following analyses were carried out.
A descriptive analysis was done to find the percentage of students that testify to the current use of the social media in European higher institutions, and actual usage. The mean scores of the students were computed for learning outcomes associated with social media to gauge their perceptions about the impact of the social media applications on their learning abilities. Comprehensive descriptive analysis comparing institutions was done to see if discrepancies exist among institutions.
4.3 Regression analysis to study the mediating effect of Hodstede
dimensions
Exploration of the predictive powers of the determinant factors on intention to use social media was carried out using correlation analysis. Regression analyses were further undertaken to establish the mediating effects of Hofstede’s dimensions on the association between the determinant factors and intention to use.
4.4 Limitation of the study
Although concerted effort was made through the procedures undertaken in collection of the data to ensure the validity and reliability of the responses described. Issues relating to comparability of the study to entire higher institutions in European countries demand in depth probe beyond the scope of this study. For the fact that the survey is a one time measure of participating institutions’ perceptions, and motivations, the measurements are at best valid only with regards to the specific target populations represented by the sample. Care should be exercised in inference of the findings beyond the limit of the study to indicate trends across nations, in consideration of comparability issues of the findings across higher institutions in other European countries. In addition, the issue of multiple completions cannot be ruled out as the questionnaire was administered online.
4.5 Ethical consideration
Chapter Five
Results
5.0 Introduction
We presented the results of the descriptive analysis in section one relating to the analysis undertaken to address the first two research questions. The second section presented the reports of regression analysis that evaluated mediating effect of culture in the association between determinant factors and intention to use social media for education.
5.1 Current use of social media in higher education
What is the current use of the social media applications for education in your institution?
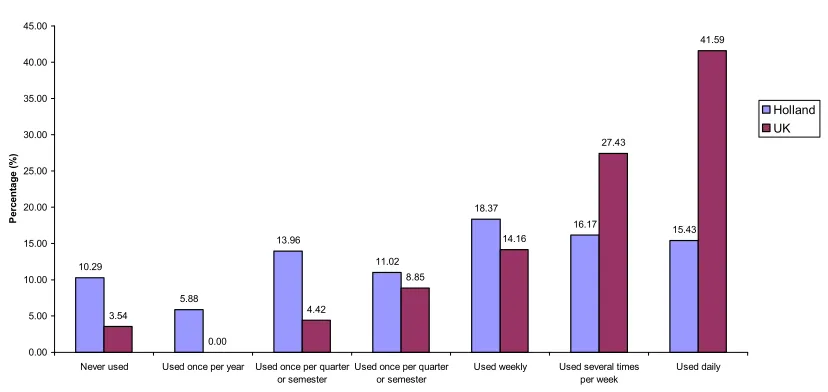
[image:32.595.95.509.488.684.2]To provide answer to this question, students were asked to testify, if at all they observe the use of web 2.0 applications for educational goals in their institutions.
Figure 3: Current use of social media in higher institutions
10.29 5.88 13.96 11.02 18.37 16.17 15.43 3.54 0.00 4.42 8.85 14.16 27.43 41.59 0.00 5.00 10.00 15.00 20.00 25.00 30.00 35.00 40.00 45.00
Never used Used once per year Used once per quarter or semester
Used once per quarter or semester
Used weekly Used several times per week Used daily P e rc e n ta g e ( % ) Holland UK
several times weekly or daily utilization of social media is the institution of the students (see figure 4). Most Netherland institutions’ students have observed several times (16.17%) to daily (15.43%) use of the social media for educational goals, but more students of Great Britain institutions’ students reported higher observation of its utilizations several times weekly (27.43%) to daily (41.95%) use of social media for learning purpose.
5.1.1 Frequency with which students use social media for educational activities
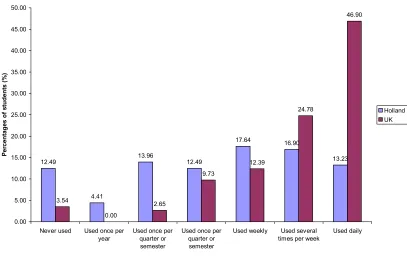
[image:33.595.96.503.323.579.2]How frequent do you use the social media for educational activities? To answer this question, students were asked to indicate the rate with which they use social media to attend to issues relating to their education.
Figure 4: Frequency of use of the social media for educational activities
12.49 4.41 13.96 12.49 17.64 16.90 13.23 3.54 0.00 2.65 9.73 12.39 24.78 46.90 0.00 5.00 10.00 15.00 20.00 25.00 30.00 35.00 40.00 45.00 50.00
Never used Used once per year
Used once per quarter or semester
Used once per quarter or semester
Used weekly Used several times per week
Used daily P e rc e n ta g e s o f s tu d e n ts ( % ) Holland UK
5.1.2. The Web 2.0 applications European students like to learn through
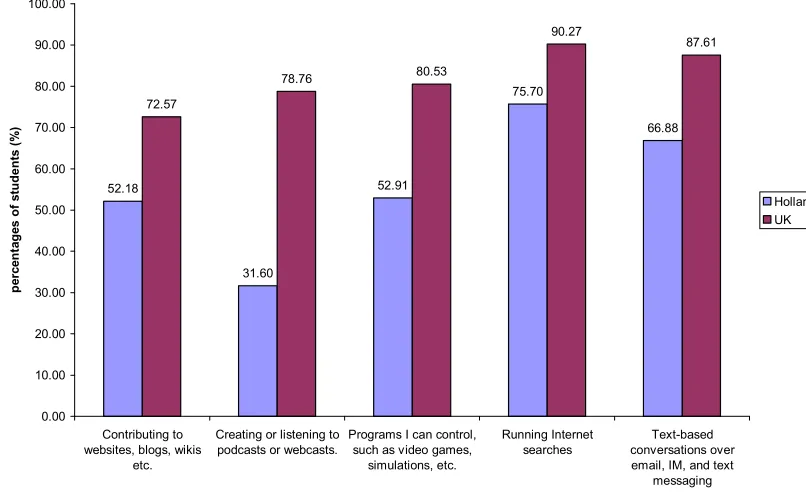
[image:34.595.93.496.208.455.2]Which of the following web 2.0 applications would you like to learn through? In order to provide solution to the question, students were asked to indicate the applications they would want to learn through.
Table 5: Students' prefrence of applications to learn through
52.18 31.60 52.91 75.70 66.88 72.57 78.76 80.53 90.27 87.61 0.00 10.00 20.00 30.00 40.00 50.00 60.00 70.00 80.00 90.00 100.00 Contributing to websites, blogs, wikis
etc.
Creating or listening to podcasts or webcasts.
Programs I can control, such as video games,
simulations, etc.
Running Internet searches
Text-based conversations over email, IM, and text
messaging p e rc e n ta g e s o f s tu d e n ts ( % ) Holland UK
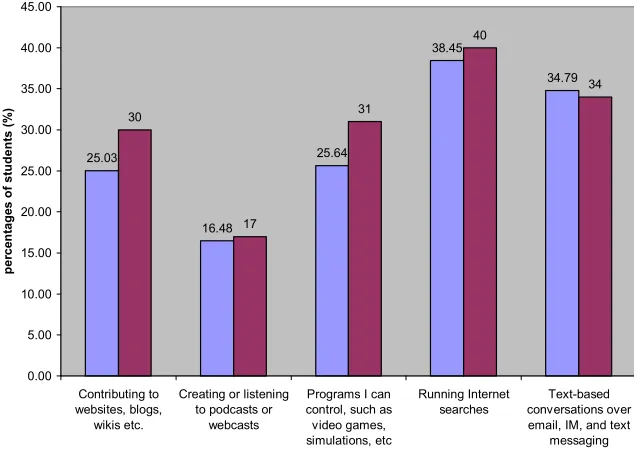
Table 6: Students prefernce of applications to learn through 25.03 16.48 25.64 38.45 34.79 30 17 31 40 34 0.00 5.00 10.00 15.00 20.00 25.00 30.00 35.00 40.00 45.00 Contributing to websites, blogs, wikis etc.
Creating or listening to podcasts or
webcasts
Programs I can control, such as video games, simulations, etc Running Internet searches Text-based conversations over email, IM, and text
messaging p e rc e n ta g e s o f s tu d e n ts ( % )
Unversity of Twente Saxion University
5.1.3. The most used social media application in educational activities.
Figure 7: Most used social media applications in institutions 0.15 0.06 0.03 0.25 0.24 0.38 0.01 0.35 0.99 0.39 0.19 0.42 0.52 0.30 0.35 0.41 0.00 0.20 0.40 0.60 0.80 1.00 1.20
Webcast Podcasts E-portfolios Instant messaging
Social networking
Wikis h.del.iciou youTube
P e rc e n ta g e s o f s tu d e n ts ( % ) Holland Uk
The results indicate that the most used social media application vary according to institutions. For United Kingdom institutions, students use the webcast most (0.99%), followed by social networking applications (0.52%). Unlike the United Kingdom, Dutch students prefer to contribute to wikis and use youTube for educational purposes than using the webcast (see figure 6).
5.1.4. Students perceptions of the impact of social media applications on learning outcomes.
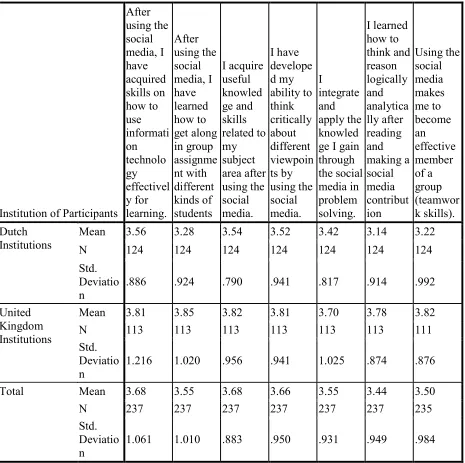
Table 4: Students’ perceptions of the impact of social media applications on learning (Dutch and UK institutions compared).
Institution of Participants After using the social media, I have acquired skills on how to use informati on technolo gy effectivel y for learning. After using the social media, I have learned how to get along in group assignme nt with different kinds of students I acquire useful knowled ge and skills related to my subject area after using the social media. I have develope d my ability to think critically about different viewpoin ts by using the social media. I integrate and apply the knowled ge I gain through the social media in problem solving. I learned how to think and reason logically and analytica lly after reading and making a social media contribut ion Using the social media makes me to become an effective member of a group (teamwor k skills).
Mean 3.56 3.28 3.54 3.52 3.42 3.14 3.22
N 124 124 124 124 124 124 124
Dutch Institutions
Std. Deviatio n
.886 .924 .790 .941 .817 .914 .992
Mean 3.81 3.85 3.82 3.81 3.70 3.78 3.82
N 113 113 113 113 113 113 111
United Kingdom Institutions Std. Deviatio n
1.216 1.020 .956 .941 1.025 .874 .876
Mean 3.68 3.55 3.68 3.66 3.55 3.44 3.50
N 237 237 237 237 237 237 235
Total
Std. Deviatio n
1.061 1.010 .883 .950 .931 .949 .984
**scale: Strongly agree = 1, Disagree = 2, Neutral = 3, Agree = 4, strongly agree = 5.
Table 5: Students’ perceptions of the impact of social media applications on learning (UT and Saxion Compared).
Institution of Participants
I acquire useful knowledge and skills related to my subject area after using the social media. I have developed my ability to think critically about different viewpoints by using the social media. After using the social media, I have learned how to get along in group assignment with different kinds of students I integrate and apply the knowledge I gain through the social media in problem solving. I learned how to think and reason logically and analyticall y after reading and making a social media contributio n Using the social media makes me to become an effective member of a group (teamwork skills).
Mean 3.57 3.55 3.38 3.43 3.17 3.21
N 47 47 47 47 47 47
Saxion University of Applied
sciences. Std.
Deviation .744 .829 .874 .773 .940 .883
Mean 3.65 3.58 3.34 3.49 3.21 3.34
N 77 77 77 77 77 77
University of Twente
Std.
Deviation .823 1.005 1.008 .868 .978 1.071
Mean 3.62 3.57 3.35 3.47 3.19 3.29
N 124 124 124 124 124 124
Total
Std.
Deviation .792 .939 .956 .831 .960 1.002
**scale: Strongly agree = 1, Disagree = 2, Neutral = 3, Agree = 4, strongly agree = 5.
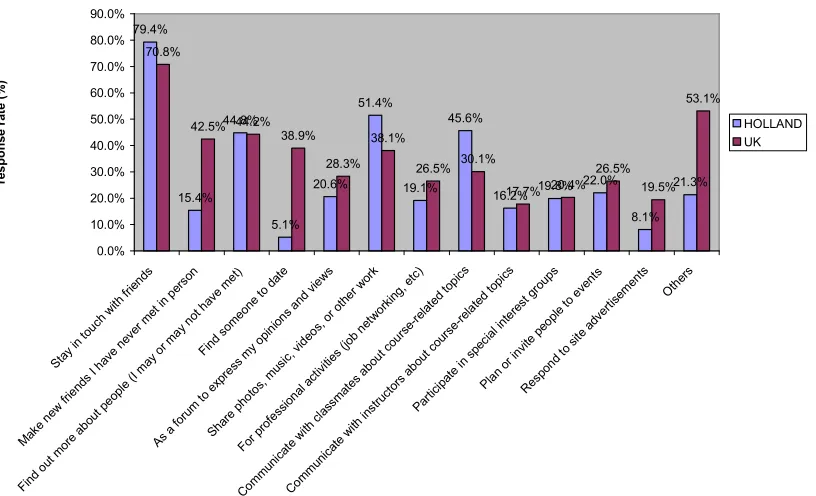
5.1.5. How students use the social networking websites
[image:39.595.100.508.203.451.2]What do students of European higher institutions use the social networking sites for? To provide answer to this question, students were asked to indicate purposes for which they are using the social networking sites.
Table 8: what students use the social networking sites for
79.4% 15.4% 44.8% 5.1% 20.6% 51.4% 19.1% 45.6%
16.2% 19.8% 22.0% 8.1% 21.3% 70.8% 42.5% 44.2% 38.9% 28.3% 38.1% 26.5% 30.1% 17.7% 20.4% 26.5% 19.5% 53.1% 0.0% 10.0% 20.0% 30.0% 40.0% 50.0% 60.0% 70.0% 80.0% 90.0% Stay in to
uch with
frie nds
Mak e ne
w fr iend
s I h ave
neve r met
in p erso
n
Find out
mor e ab
out p eopl
e (I may
or m ay n
ot h ave met ) Find som eone to d
ate
As a foru
m to exp ress my opin ions and vie ws Sha re p
hoto s, m
usic , vid
eos, or o
ther wor
k
For p rofe
ssio nal a
ctiv ities (job net wor king
, etc )
Com mun
icat e w
ith c lass
mat es a
bout cou rs e-rela ted topi cs Com mun icat e w
ith in stru
ctor s ab
out c ours
e-re late
d to pics
Parti cipa
te in spe cial inte rest gro ups Plan or i
nvite peo
ple to e
vent s
Res pond
to s ite a
dver tisem ents Oth ers re s p o n s e r a te ( % ) HOLLAND UK
The results indicate inconsistencies in the use of social networking sites across European higher institutions. Both United Kingdom students (70.8%) and Dutch students (79.4%) use the social networking sites most to stay in touch with friends. The students from both countries also share common interest when it comes to the issue of using the sites to find more about their friends (44.3% vs 44.2%). On the contrary, Dutch students (51.4%) use the social networking sites more to communicate with their classmate about course related issues than United Kingdom students (36.1%). The United Kingdom students relate more with their instructors using the social networking sites than their Dutch counterparts (view table 8).
5.2Testing for the mediating effects of Hofstede’s dimensions
Sobel test calculator for significance of mediation, we will check whether Hofstede’s dimensions have significant mediating effects.
5.2.1 Analysis of whether the five determinant factors correlate with intention to use.
The correlations analyses of the five determinant factors with the outcome variable (Intention to use) were computed using SPSS to assess the degree and direction of relationship.
We based the results of the correlation analysis on the individual mean scores of participants in each of determinant factors’ measurements. Pearson’s correlation coefficient “r” is used to report the results of the correlation.
The outputs of the correlation analysis show significant correlations between some of determinant factors and intention to use (view the appendix for details). The correlation coefficient for each of the part, that is the link between each of the determinant factors with intention to use, is statistically significant except for Effort Expectancy that failed to correlate with intention to use, and will not be used for further analysis. The association between intension to use and the determinant factors were not all that strong and for this reason will not result to multicollinearity.
5.2.2 Regression analysis to test the predictive power of the determinant factors on Hofstede’s dimensions.
In all cases, the regression analyses indicate that each of the determinant factors has predictive power on the accompanying Hofstede’s dimension. The regression coefficient for the association between Performance Expectancy and Individualism Index (mediator) is .59 with standard error of regression coefficient .07. The regression analysis investigating the association between social influence and power distance shows that the regression coefficient for the association is .15, and the standard error of the regression coefficient is 0.05. Similar regression analysis reports that the regression coefficient for the association between control belief and technological experience (mediator) is .16 with standard error of regression coefficient of 0.10. Finally, the regression analysis evaluating the predictive power of community identity on masculinity index indicates that the regression coefficient for the association is 0.27, and the standard error of the regression coefficient is .05.
5.2.3 Regression analysis to test the predictive power of Hofsede’s dimensions on intention to use social
The results of the regression analyses for the associations between Hofstede’s dimensions and intentions to use clearly indicate that all the four dimensions have predictive power on intention to use. The regression coefficient for the association between individualism index and intention to use while controlling for performance expectancy is 0.10, while the standard error for regression coefficient is 0.04 (view the appendix for diagram). The regression coefficient for the association between power distance index and intention to use controlling for social influence is 0.3 and the standard error of regression coefficient is 0.6. The regression analysis investigating the predictive power of technological experience on intentions to use while controlling for control belief is 0.3, and the standard error of regression coefficient is 0.05. Similar analysis aimed at assessing the predictive power of masculinity controlling for community identity indicates that the regression coefficient for the association is 0.3, with the standard error for regression coefficient of .06.
5.2.4 Using Sobel test calculator for the significance of mediation
The calculator is used to test to assure whether the mediators significantly conveys the effect of the determinant factors on intention to use, that is, if
[image:41.595.193.481.454.530.2]the indirect influence of each determinant factors on the intention to use through the mediators (Hofstede’s dimensions) are significant.
5.2.5 Parameters used to test the mediating effect of Individualism index on the association between performance expectancy and intention to use
A: 0.6 The regression weight (regression
coefficient) for the relationship between
the performance expectancy
(independent variable) and individualism index (mediator).
SEA: 0.07 The standard error of the relationship
between the performance expectancy and the individualism dimension.
B: 0.10 The regression weight (regression
coefficient) for the relationship between the individualism index and intention to use (dependent variable).
SEB: 0.04 The standard error of the relationship
between individualism index and intention to use.
Calculate Sobel test statistics = 7.442084 with associated
p- value of 0.001 significant at α = 0.05.
Chapter Six
Discussions
6.0 Introduction
Based on the theory of User Acceptance of Information Technology (UTAUT) offered as a unified view of technology acceptance, this study explored the predictive power of UTAUT constructs relative to its relationship with Hofstede’s cultural framework as mediator variables that affect students’ intention to use social media in higher education. It also studied students’ perceptions and use of the social media for educational purposes.
The discussi