Abstract—Exploration with impregnated diamond drill bits is the key operation in the mining and mineral industry. Demand for deep exploration drilling has significantly increased recently due to the rapid depletion of near surface mineral deposits globally. One of the main problems encountered during drilling operation is to infer bit wear in great depth remotely as the optimal performance of the drill still relies heavily on operator experience. This paper aims to assess the feasibility of Acoustic Emission (AE) monitoring of the impregnated diamond drilling process and establish relationships between AE and diamond drill bit wear, as well as establishing AE relationships with various drilling parameters. A full drill rig, Echidna drill apparatus, simulating field exploration diamond drilling on a small scale, were used to monitor AE during rock bit interaction. AE sensors were attached to both the drill and the rock to record acoustics being emitted during drilling. Initial tests on the Echidna drill involved stepping down the depth of cut from 130µm to 0µm, whilst keeping revolutions per meter (RPM) constant. Secondary tests performed on the Echidna drill involved accelerating the wear rate of the drill bit via two different types of wear in highly abrasive rock. Based on step test results, a series of linear relationships were developed which are capable of estimating the depth of cut, force by simply using time spectrum of the AE signals. Wear tests also showed that AE amplitudes start to trend down over the time of accelerated wear.
Index Terms— Acoustics, Impregnated Diamond Bits, Bit
wear, Deep Exploration Drilling
I. INTRODUCTION
SE of impregnated diamond drill bits is a key technology employed in the exploration industry which has a significant impact on global economies in Manuscript received March 27, 2013; revised April 11, 2013. The work has been supported by the Deep Exploration Technologies Cooperative Research Centre whose activities are funded by the Australian Government's Cooperative Research Centre Programme. This is DET CRC Document 2013/183.
Murat Karakus is with Deep Exploration Technologies CRC, School of Civil, Environmental and Mining Engineering at the University of Adelaide, SA, 5005 AUSTRALIA (corresponding author: Tel.: +61 8 8303 6471 Fax: +61 8 8313 4359; [email protected]).
Todd May is with Deep Exploration Technologies CRC, School of Civil, Environmental and Mining Engineering at the University of Adelaide, SA, 5005 AUSTRALIA ([email protected]).
David Ollerenshaw is with Deep Exploration Technologies CRC, School of Civil, Environmental and Mining Engineering at the University of Adelaide, SA, 5005 AUSTRALIA
expanding existing resources and discovering new mineral deposits as such total mineral exploration expenditure for example in Australia, increased to $944.7 Million in the first quarter of 2011 from $200 Million in 2003 [1]. Currently diamond drill operators use operational parameters such as weight on the bit, cutting speed, depth of cut, torque and mud pressure to control drilling performance. However, drill operators tend to rely on experience to predict changes in drilling conditions associated with different diamond wear states and rock formations. The process is subjective and prone to errors and the these errors will increase in deep explorations, which is a global transition as near surface mineral deposits are rapidly being depleted, at rates significantly higher than mineral deposit discoveries. Given that the direct measurement and visualisation of the impregnated diamond drilling process is extremely difficult in rock exploration drilling, AE monitoring can be a viable technique to remotely assess the interaction at the impregnated diamond drilling interface including the diamond bit wear state. AE monitoring has been extensively used to monitor different aspects of drilling in manufacturing and to better understand the mechanisms behind the drilling process. However, AE monitoring has not yet been applied to impregnated diamond drilling to assess drilling conditions remotely. Given the importance of mining in today’s global market and global growth, it is imperative that improvements are made on current practices in order to achieve optimal drilling performance. The ultimate goal in this research is to initiate steps towards developing drill bit monitoring technology capable of providing the operator with live information about the condition of the down-hole drill bit. Successful implementation of this technology will lead to increased efficiency, extended drill bit life and reduced drilling costs.
II. IMPREGNATED DIAMOND DRILL BITS
An impregnated diamond drill bit is typically constructed of a steel, cylindrical body with a metal matrix attached to form a cutting tip. The matrix, commonly made from mixtures of tungsten, tungsten carbide and bronze, contains dispersed synthetic diamonds [18]. The cylindrical design of the bit allows the recovery of a solid rock core, providing information regarding the underlying geology.
Impregnated diamond drilling utilises a rotary drilling mechanism; a normal force is applied to the bit, whilst another, torsional force, rotates the bit parallel to the rock
Acoustic Emission (AE) Signatures of Rock
Cutting Response of an Impregnated Diamond
Drill Bit
M. Karakus, T. May, D. Ollerenshaw
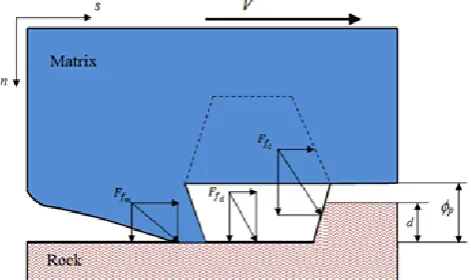
surface as shown in Fig 1. This generates both tensile and shear stresses in the adjacent material [13]. The bit rotates causing the face of the diamond to move along the rock surface, inducing failure via a combination of scratching, grinding, crushing and cutting mechanisms [12]. As the bit rotates, the diamonds initially in contact with the rock surface begin to wear. The process continues until these diamonds break away from the matrix and are removed by the flushing media, allowing new diamonds with fresh cutting faces to be exposed [17].
Fig 1. Cutting action of a single diamond in which Ffm and Ffd are the
resultant forces in the matrix and diamond respectively. Ffc is the resultant
cutting force, d is the depth of cut and p is the diamond protrusion and V is the cutting speed. (Reconstructed from [16])
Baranov, Kudryavtsev, Sarychev and Schavelin [2] stated that materials of friction pass through three different stages of wear. These stages can be classified as: the running-in, steady state and catastrophic wear. The running-in stage shows changes in friction surface relief and physical-chemical characteristics during the initial period of operation. At constant external parameters, these changes will consist in the decrease of the friction force, temperature of mating materials, and wear rate. The second wear stage, steady state, is characterised by constant values on the average of practically all friction characteristics, (eg. friction coefficient, wear rate, temperature and roughness etc.). At this stage the processes of friction and wear are stationary, where the geometry of friction surfaces is continuously reproduced. The third stage of wear, catastrophic wear stage, can be characterised by sharp changes in friction characteristics, where the friction coefficient, wear rate and constant temperature increase [2].
Diamond particles can wear via two major wear modes; the formation of wear flats and diamond microfracturing [14]. In lower than optimal drilling conditions, the exposed diamonds develop large wear flats. These wear flats can become stable and do not protrude far from the matrix surface, greatly reducing the effectiveness of the drill bit. Increases in thrust alone is not sufficient to cause fracturing, and only by physically breaking the diamonds or re-dressing the bit face can facilitate the bit operate efficiently again [3]. In optimal drilling conditions, the sharp edges of the diamond are worn to transitionary wear flats which then begin to fracture [14]. Eventually this leads to entire failure of the diamond and its removal from the surrounding matrix. Therefore, the wear process of the impregnated diamond bits depends not only on the properties of the bit,
but also on the operational drilling parameters [18].
When performing drilling, there are number of controllable operational parameters which are chosen according to the drilling conditions in attempt to optimise drilling performance. The penetration rate is defined as the penetration, or distance from the hole collar, over a particular time period. In this report, a unit defined as the depth of cut, measured in micrometers per revolution (µm/rev) of the drill bit is used frequently.
Torque is the rotational moment applied to the drill bit and is conventionally stated in Newton metres (Nm). The normal force, also known as thrust or weight on the bit, is the axial load applied in the direction of drilling. The weight on the bit is a major drilling parameter and has been stated to be the most influential wear factor when compared to rotational speed and rock type [8]. The thrust is responsible for maintaining rock-bit interaction and helps to uphold penetration.
III. ACOUSTIC EMISSION
Acoustic emissions are simply transient stress waves, which are generated when the deformation state of a body changes [7]. Other variations in this definition exist to be the elastic stress waves generated as a result of the rapid release of strain energy during martensitic transformation, fracture, plastic deformation and changes in the internal structure of a material [4].
Acoustic emissions can produce two types of signals, burst (discrete) emissions or continuous emissions; the continuous emissions are of lower amplitude and of high frequency (minimal separation of occurrence). In this case, the energy released in a single event is small where the energy state of solid changes insignificantly [2]. The burst emissions signal consists of pulses with amplitudes substantially larger than the background noise and well separated in time of occurrence [7]. The energy of the elastic wave may exceed several orders of magnitude to that of elastic waves in continuous emission. These emissions are characterised by an increase in amplitude of acoustic pulses and is therefore registered as a discrete (or burst) AE [2].
The stress waves formed from the wear event will propagate throughout the material and, therefore, it is not necessary to mount the sensor at the source of the waves [6].
IV. AESIGNALANALYSIS
The recorded acoustic emissions contain large amounts of information, it is therefore important to be able to distinguish between relevant data and background noises. Signal processing is an operation, which can both extract and enhance the valuable data from a busy signal. Due to the stochastic nature of acoustic emission signals, the use of statistical methods and signal analysis tools are required [5].
The Root Mean Square method (RMS), described in Equation 1, provides a measure of magnitude of the signal, despite the shape of the waveform [10];
where T = period of the waveform and A is the instantaneous amplitude. RMS is similar to a moving average, capable of ‘smoothing’ out the data, helping to make any present trends in the data more obvious. In a study by Jemielniak and Otman [9], the RMS value was considered as a useful mean of tool failure detection. Further studies revealed that this may not be the case. Dornfeld and Kannatey-Asibu [5] concluded that the RMS values and associated distribution parameters can be very sensitive in regards to the degree of tool wear. Williams and Hagan [19] found that drilling with a worn bit produced a signal with lower RMS amplitude.
The Fast Fourier transform (FFT) is a mathematical tool which separates a series of values into discrete frequencies. This tool is regularly used to convert a signal in the time domain, to one in the frequency domain, highlighting characteristic frequencies which would not have been clear otherwise [15]. The FFT has been extensively used by engineers across a variety of applications. Li [11] performed an extensive study on AE analysis to monitor bearing conditions. He used a number of observations which were based on the characteristic frequencies related to the failure of bearings, found by using the FFT. Williams and Hagan [19] studied the AE levels present with changes in rock cutting conditions. They found that due to their relatively low sampling rate, FFT did not produce any worthwhile results.
Sun [17] used acoustic emission to monitor bit wear during drilling using two different types of rocks and concluded that different drilling situations may be identified by the characteristics of AE signals generated at the rock/bit failure. He had extracted useful information pertaining to the degree of bit-wear, impending bit failure and formation change. The experimental setup consisted of a tricone rotary drill bit in a field drilling scenario. The experiment proved that the AE signals collected during drilling with the worn bit were higher and rougher compared with signals from drilling with the new bit.
V. EXPERIMENTAL WORK:ECHIDNA DRILL TESTING AND AEMONITORING
All Tests for this project were performed at the Australian Resource Research Centre (ARRC) at the CSIRO in Perth using Echidna drill rig. The Echidna rig is capable of accurately maintaining operational drilling parameters such as depth of cut, force, torque and revolutions per minute (RPM) via computer. The rig uses 36mm diameter drill bits, which drill into approximately 32x32x32cm rock samples. Throughout the tests a constant RPM was maintained while rock type, drill bit type and other drilling parameters were manipulated to promote a relation between AE and certain variables.
Two different rock types were used: ‘American Black’, unconfined compressive strength (UCS) of 300MPa with a quartz content of 3%, and ‘Radiant Red’, UCS of 180MPa with a quartz content of 35%. Two different drill bits were also used, both sourced from Dimatec Inc. They were, ‘HR14’ which has a soft matrix for hard, fine grained cutting and ‘D2’ which has a hard matrix for cutting soft,
[image:3.595.305.546.52.326.2]fracture rocks.
Fig 2. Acoustic Emission monitoring system on the Echidna drill rig
Figure 2 shows the AE system used consisting of one WDI sensor and one PICO sensor (with pre-amplifier) along with a data acquisition card (DAQ) and a LabView program developed at the University of Adelaide. The WDI AST wide band integral preamplifier sensors have 40 dB integrated pre-amplifiers and a frequency bandwidth of 200-900 kHz. The PICO AE sensors have a frequency range of 200 kHz to 800 kHz and require the use of external pre-amplifiers to magnify the signals. The DAQ is a NI PCI-61333 (16M Samples) S Series Multifunction DAQ device which was used to sample the AE data. The DAQ card has eight analogue channels each of which was able to collect up to 3 million samples per second. Sampling rate for the AE was 800kHz during all tests.
The PICO sensor was placed on a stationary part of the rig platform, as close as possible to the drill bit and as far away as possible from the machine motor. While the WDI sensor was placed on the upper surface of the rock sample, and for safety reasons, at the edge furthest from drilling. Silicon gel was used as a medium between the sensors and the rock for even AE distribution across the sensors. However, due to the high amount of drilling fluid outflow, the WDI sensor need to be attached with epoxy adhesive glue.
For each test, data was initially saved in a binary ‘.dat’ format. For ease of use, the files were converted to a double columned ASCII text format with each column containing the voltage recorded from each sensor. An executable file written in Fortran 95 was then developed to split the rock sensor column and rig sensor column into two separate text files. From here, files were imported into Matlab, where signal analysis could be performed.
A. Step Tests
depth of cut was steadily decreased. They were performed at 1600 RPM using a HR14 bit in American Black, with the force and torque varying in order to change the depth of cut. The depth of cut started at 130 µm and was reduced to 50 µm by steps of 10 µm and then reduced further to 5 µm in steps of 5 µm. The drill bit was sharpened prior to the commencement of each test. In order to relate these tests to bit wear, similar tests were repeated using a worn D2 drill bit. These tests allowed the development of AE-drilling parameter relationships. These tests had been programmed identically to the previous tests however the force limit was exceeded, ceasing drilling instantly. Due to the bluntness of the bit, the rig had to exceed the force/ torque limit in order to maintain the same depth of cut. Two quick tests were done to determine a depth of cut that would not again exceed limits. 90µm was found to be achievable, thus making the blunt step test step down from 90µm to 50µm by 10µm, and 50µm to 5µm by 5µm. All of these preliminary tests are summarised in Table 1.
TABLE 1. STEP TEST PROPERTIES (ROCK TYPE: AMERICAN BLACK; DRILL
FUID=WATER)
Test Name Bit RPM Depth of Cut, Micron
Step Test 1 Sharp HR14 1600 130 to 50 by 10, 50 to 5 by 5
Step Test 2 Sharp HR14 1600 130 to 50 by 10, 50 to 5 by 5
Step Test 3 Sharp HR14 1600 130 to 50 by 10, 50 to 5 by 5
Step Test 4 Sharp HR14 1600 130 to 50 by 10, 50 to 5 by 5
Step Test 1 Worn D2 1600 90 to 50 by 10, 50 to 5 by 5
Step Test 2 Worn D2 1600 90 to 50 by 10, 50 to 5 by 5
Step Test 3 Worn D2 1600 90 to 50 by 10, 50 to 5 by 5
B. Wear Tests
Secondary testing was aimed at wearing the drill bits as much as possible in order to relate bit wear to AE. In wear tests, the rock type was changed to Radiant Red which has higher abrasivity resulting in an increased wear rate. Two types of wear tests were performed; one aiming to induce matrix wear, while the other, promoting diamond wear. At high depths of cut, matrix wear increases as there is more contact between the matrix and the rock as well as more displacement of particles. Whereas at low depths of cut, diamond wear flat development is more prominent due to the grinding like behavior of the bit. The matrix wear test utilised a HR14 drill bit while the diamond wear test was performed with the D2 bit. Due to the hardness of the matrix and the relatively low depth of cut, it was assumed that the matrix would experience minimal wear, while hopefully causing a polishing effect on the diamonds. The bit was also sharpened and weighed before each of the tests. Force/torque limits were again reached, so the depth of cut had to be reduced to 50µm which provided a successful test. These wear tests are summarised in Table 2.
TABLE 2. WEAR TESTS PROPERTIES (DRILL FUID=WATER)
Test Name Bit RPM Depth of Cut (µ/rev) Rock
Matrix Wear HR14 1600 60 Radiant Red
Diamond Wear Flat
D2 1600 50 Radiant Red
VI. PRELIMINARY TEST RESULTS
The Echidna rig has the ability to preset and maintain particular drilling parameters during operation. For the majority of testing, the rig was instructed to maintain a constant RPM while also maintaining, or varying, the depth of cut. The machine then varies other drilling parameters, primarily the normal force and torque, in attempt to control the depth of cut. Sensors attached to the machine measure and record the variable magnitude for post-drilling analysis. While the operational parameters during drilling do not remain perfectly constant, the rig is capable of maintaining these parameters as precise as practically possible.
Prior to the analysis of the test results, the influence of background and machine noise had to be determined. As anticipated, both sensors were susceptible to background interference and detected vibrations coming from the rig motor. This error, when compared to measured signal voltage during later tests can be considered negligible.
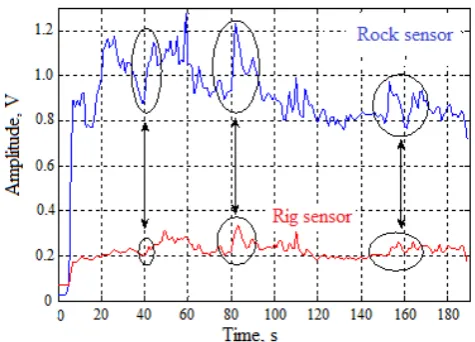
Fig 3. AE signals from matrix wear test
As both sensors were recording simultaneously, it was expected that they would produce similar signals. Figure 3 shows the direct correlation between the signals recorded by both sensors during the matrix wear test. Circled are sections of the data, which clearly highlight the relationship. While the signals are similar in structure, there exists a large, approximately constant, difference in amplitude. This is due to the distance between the two sensors, and the attenuation of the signals within the transferring mediums. The visual similarities of the two signals confirm the ability of a rig-based sensor to accurately detect rock-bit interaction.
A. Step Tests Results
[image:4.595.305.543.323.494.2] [image:4.595.41.289.324.448.2]level, the amplitude is more variable and is difficult to determine the stepping trend. This large drop in amplitude occurring at approximately 80 µm was present in each of the sharp step test results. A possible explanation for this is a change in cutting behaviour as the depth of cut decreases. For above 80 µm - 90 µm depth of cut the drill bit is cutting in an aggressive nature, causing microcracking in both the diamonds and rock.
Fig 4. Sharp step test results correlating signal amplitude with depth of cut.
There is also displacement of rock and diamond particles from within their respective surfaces. Once the depth of cut drops below approximately 80 µm, the bit may behave in a less aggressive nature, acting in more of a grinding/rubbing manner. This grinding would cause less dislocation of particles and more of a steady rock-bit interaction. The reduction in movement and vibrations would result in a decrease in signal amplitude. This would suggest that at the beginning of the signal, the wear mode of the bit is dominated by matrix wear, while once the depth of cut decreases, the major wear mode shifts to diamond wear.
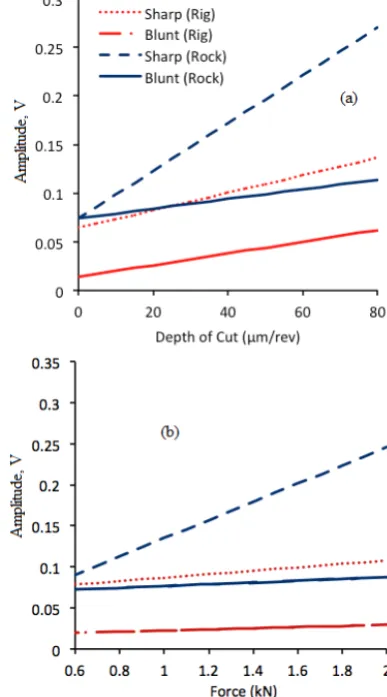
Although the depth of cut is the controlled parameter, it is simply a measurement of bit performance and is directly controlled by the force and torque. The variations in AE are therefore due to changes in force and torque applied to the bit. By plotting, direct relations between signal amplitude and operational drilling parameters were established. As the large increase in amplitude was common throughout every test, separate relations were developed for the data above and below this value. The threshold depth of cut estimated to be 80 µm, corresponding to an approximate normal force and torque of 2 kN and 14 Nm respectively. Figure 5a displays the relations between depth of cut and signal amplitude; Figure 5b shows relations between AE amplitude and the thrust for sharp and blunt step tests.
This plot (Fig 5) would allow an operator to estimate the depth of cut solely by analysing the AE produced. Similar relations were developed which could be used to estimate, or as a secondary measure to confirm, the force on the bit.
While these equations describe a direct relation between signal amplitude and drilling parameters, they are estimations for particular depth of cut ranges and the experimental set up only. Changing the rock type, bit, RPM and drilling fluid would likely alter the results and hence the accuracy of these relations. Further testing implementing the variation of these parameters is required to confirm their influence.
Fig 5. Sharp/Blunt step test Comparison
After the completion of the sharp step tests, the tests were repeated using a blunt bit in order to establish the effect of bit wear on AE. These tests revealed similar results, with well-defined step like features corresponding to decreases in depth of cut. The primary observation from these tests was that the worn bit results in a lower average signal amplitude and lower energy. This is likely due to the inability of the worn bit to aggressively cut the rock surface. While the worn bit used in these tests is of the same dimensions to the sharp HR14 bit, the matrix much harder, meaning it is difficult to confirm the change in AE is due solely to the different wear stages of the bit.
B. Wear Tests Results
[image:5.595.326.520.159.508.2]diamond wear flat development. Due to the small scale of bit wear incurred, it is difficult to quantify and assess the wear caused during drilling. It was decided that the most accurate and efficient way of assessing wear was to record the mass changes of the bit.
The signals recorded during the matrix wear test can be seen in Figure 6. Both amplitudes fluctuate during the length of the test with the small scale variations likely due to factors such as: small changes in drilling parameters such as force and torque; vibrations of particles at the cutting face or the encountering of irregularities in the rock.
As the drilling parameters remain constant throughout the test, the decrease in amplitude could be attributed to the worn bit condition and hence producing less AE. The bit incurred a total mass loss of 1.42 g during the 3 minute test. The cyclic trend of the amplitude may be due to the cyclic sharpening of the drill bit. For example, at the beginning of the test the matrix is worn away to reveal fresh cutting faces. The fresh diamonds begin cutting the rock aggressively resulting in a peak of signal amplitude. These diamonds are then stripped away by the abrasive rock, reducing the cutting efficiency and signal amplitude. This cycle then repeats with the matrix being worn away, fresh diamonds being revealed and another increase in amplitude. It is difficult to confirm this theory due to the small sample time.
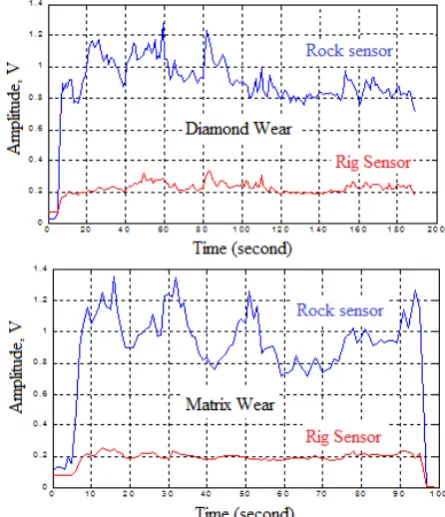
The aim of the next wear test was to cause diamond wear flat development while minimising matrix wear. The harder D2 bit lost 1.20 g over the 90 second drilling period. While the results appeared similar to that of the matrix test, four prominent peaks were detected by the rock sensor, as shown in Figure 6.
A possible explanation of this could be the progressive wear of the diamonds which have the highest protrusion. At the beginning of the test, only a small number of diamonds are in direct contact with the rock. As the test proceeds, these diamonds begin cutting, increasing the signal amplitude. Due to the high abrasiveness of the Radiant Red and the low depth of cut, these diamonds rapidly become wear flat, resulting in a reduction of signal amplitude. As these initial diamonds flatten out, their protrusion from the matrix surface decreases allowing other protruding diamonds to initiate contact with the rock surface. These fresh diamonds begin cutting until they too are worn flat, then allowing other diamonds to begin cutting. This cycle would repeat until all diamonds on the surface of the bit are worn flat, greatly reducing any remaining cutting efficiency. While this theory explains the continuous sharp fluctuations in signal amplitude, longer cutting times could possibly confirm this. Like the matrix wear test, frequency analysis performed on the diamond wear test was inconclusive. The wear mode of the drill bit had little effect on peak frequency. Despite the use of two different bits, and changes in depth of cut, it is possible that the bit was wearing in the same fashion in both tests, explaining the similarity of results.
VII. CONCLUSIONS
The outcomes of this project have indicated that AE monitoring techniques are a feasible option to optimise
[image:6.595.309.532.103.362.2]diamond drilling performance. Changes in drilling conditions and the effect of drilling parameters can be accurately mapped by analysing AE. The results from the findings can be concluded as follows:
Fig 6. Diamond wear and matrix wear tests
Preliminary ‘step tests’ have concluded a direct link between AE amplitude and drilling parameters. A series of linear relationships have concluded that the signal amplitude alone could accurately estimate the current depth of cut, force in real time.
Step tests also indicated that at a certain depth of cut, approximately 80 µm, AE amplitude behaves erratically before decreasing voltage suddenly. This can be explained as a change in cutting behaviour of the bit, from an aggressive nature, to a more stable, grinding mechanism.
Under accelerated wear, AE amplitude observed a decrease over drilling time. Although since other drilling parameters had not remained constant, a relationship could not be made since this decrease could be contributed to various other parameters.
Frequency analysis was performed on the AE at accelerated wear, which revealed that there was little variation in the AE’s peak frequency and frequency range over time. From the frequency spectrum, we found that fundamental frequencies range from 20kHz to 50kHz.
Further investigations performed under both laboratory and field conditions are required to accurately relate AE and bit wear. Overall, the conclusions drawn from this project shed further light on the field of AE monitoring of impregnated diamond drill bits.
ACKNOWLEDGMENT
Special thanks go to lab technicians Ian Cates and Simon Golding from School of Civil, Environmental and Mining Engineering, The University of Adelaide.
REFERENCES
[1] Australian Bureau of Statistics (ABS), 2011. Report on mineral and petroleum exploration [online], report number 8412.0. Available from: <http://www.abs.gov.au>.
[2] Baranov V., Kudryavtsev E., Sarychev G. and Schavelin V., (2007), “Acoustic Emission in Friction” Tribiology and Interface Engineering Series, 53 Elsevier.
[3] Bullen G.J., 1985. “Rock-hard Tribology”, Industrial Lubrication and Tribology. 37(2): 44–76.
[4] Dong W.P., Joe Au Y.H. and Mardapittas A., (1994), “Characteristics of acoustic emission in drilling” Tribiology International. 27(3): 169-170.
[5] Dornfeld D.A., Kannatey-Asibu, Jr E., (1982), “A study of tool wear using statistical analysis of metal-cutting acoustic emission” Wear, 76: 247-261.
[6] Everson C.E., Hoessein Cheraghi S., (1999), “The application of acoustic emission for precision drilling process monitoring,” International Journal of Machine Tools and Manufacture, 39: 371-387.
[7] Hanchi, J. and Klamecki, B.E., (1991), Acoustic Emission Monitoring of the Wear Process, Wear, 145: 1–27.
[8] Huang S.L. and Wang Z.W., (1997), “The mechanics of diamond core drilling of rocks.” Int. J. Rock Mech. & Min. Sci. 34(3-4), paper No. 134.
[9] Jemielniak K. and Otman O., (1998), ‘Catastrophic Tool Failure Based on Acoustic Emission Signal Analysis’, Annals of the CIRP, Vol. 47(1): 31-34.
[10] Jung S. J., Prisbrey K. and Wu G., (1994), “Prediction of rock hardness and drillability using acoustic emission signatures during indentation” International Journal of Rock Mechanics and Mineral Science- Geomechanics Abstracts, 31( 5): 561-567.
[11] Li J.C. and Li S.Y., (1995), ‘Acoustic emission analysis for bearing condition monitoring’, Wear, 185; 67-74
[12] Luo H. and Wang Y., 1988. Ways to Improve the Drilling Effectiveness of Rock Bits by a Tribological Method” American Society of Mechanical Engineers, No 110, 212 -215.
[13] Maurer W.C., (1966), “The state of rock mechanics knowledge in drilling”, Chapter 15;pp. 355-395
[14] Miller D. and Ball A., (1991), ‘The wear of diamonds in impregnated diamond bit drilling’, Wear, 141: 311-320.
[15] Reddy V.U., (1998), ‘On Fast Fourier Transform – A Popular Tool for Spectrum Analysis’, Resonance: October, 79-88
[16] Richard, T., (2011), DET-CRC internal report, Australian Resource Research Centre, CSIRO Perth.
[17] Sun, X, 1999. A study of acoustic emission in drilling, Rock Mechanics for Industry, Amadei, Kranz, Scott& Smeallie(eds), Balkema, Rotterda, pp. 983-990.
[18] Tian X. and Tian S., (1994), ‘The wear mechanics of impregnated diamond bits’, Wear, 177; 81-91