Effects of Compaction Types and Compaction
Efforts on Structural and Functional Properties of
Pervious Concrete Paving Mixtures
Mr. Arun Malik1, Mr. Ajit Singh2 2
Professor, 1Department of Civil Engineering, CBS Group of Institutions, Jhajjar-125120
Abstract: Pervious concrete is regarded as an environmentally sustainable pavement material for its storm-water management and urban heat island mitigation abilities. The single sized aggregates mainly used in pervious concrete are prone to abrasion loss and lower structural capacity due to increased porosity. In order to increase the structural capacity and reduce abrasion losses, there is a need to study pervious concrete with modified gradations. However, the effect of compaction type and effort are least studied on such mixtures and hence requires special attention to identify optimum compaction levels without hampering the perviousness in the mixtures. Further, it will also be required to match the laboratory density with field density in order to compact future mixtures that represents field density. The objective of this study is to investigate pervious concrete cylinders prepared using combinations of coarse aggregates (> 4.75 mm) compacted using 4 different compaction types and efforts. The compaction characteristics of twenty mixtures will be studied to identify threshold values of compaction energies, which provide porosity within acceptable limits of pervious concrete. Further, the structural capacity and abrasion losses will be studied for pervious concrete two different graded mixtures, which will provide insights into the structural and functional performance of such pervious concrete mixtures. An effort will also be made to compare the field density of pervious concrete mixtures studied in the laboratory and compare with actual laboratory density so as to identify appropriate compaction energies and validate laboratory pervious concrete mixture properties with respect to field parameters.
Keywords: Pervious concrete, Density, void content, abrasion loss,Compressive stremgth.
I. INTRODUCTION
In recent times, pervious concrete (PC) has become a promising field because of its immense practical applications and porous nature.
The depletion of significant portions of natural land to allow for urban growth is altering entire ecosystems due to the large areas covered with flat and impervious surfaces such as parking lots and paved roads. Those areas covered by urban infrastructure can reach daytime temperatures of up to 65 °C, storing heat that is then released during the night, which contributes to the phenomenon known as urban heat island effect.
A decrease in the replenishment of ground-water along with the rise in temperature generate problems such as increased energy consumption, the need for higher capacity storm water sewer systems, impaired water quality, and contaminated local water streams.
The advantages of PC over conventional concrete are numerous, but are specific to location and prevalent conditions. PC rose to popularity in the 1980s mostly in the United States of America, which was developed during World War II to compensate the scarcity in cement (Ghafoori and Dutta, 1995).
Due to its high permeability, assisting in reducing storm water runoff, and helping recharge ground water, it has been considered as one of the best management practices (BMP) to harness storm water runoff (Tennis et al, 2004). Owing to the high porosity, PC reduces the storm water runoff in urban areas and causes an enhancement in the quality of water near the pavements leading to sustainable growth of urban areas.
Thus, PC is an effective measure to explain the important hydro-environmental issues (Chandrappa and Biligiri, 2016a). Absorption properties of PC are generally higher than conventional concrete, which also results in quieter pavements attributed to high porous nature of the PC.
II. NEED OF OPTIMIZATION
Compaction energy plays an important role in influencing the properties of pervious concrete. The porosity in PC being in the range of 15-35%, the compaction energies utilized should not compact PC below 15% porosity level rendering it impervious. The abrasion characteristic of PC consisting of dense gradation is essential to be quantified since the existing standards are based on single sized mixtures with abrasion loss being as high as 95%. Limited studies are available on the dense-graded pervious concrete mixtures and investigating them will help in understanding the tradeoffs between the various properties, and possible selection of field implementable mixtures based on strength and functional performance characteristics.
III. RESPONSE PARAMETER
Effects of compaction methods, Modifiers, mix variables and Gradations are selected as a response parameter because there are dominant parameter as strength property are concern.
IV. EXPERIMENTAL INVESTIGATION
1) Determination of aggregate physical properties
2) Selection of feasible compaction methods
3) Pervious concrete sample preparation using four different compaction methods: Rodding, Standard Proctor hammer, Marshall Hammer, and vibration with each compaction method having different efforts
4) Determination of density and porosity of PC mixtures
5) Determination of unconfined compressive strength
6) Determination of abrasion resistance
7) Evaluating the influence of compaction methods and effort on PC properties
8) Identifying optimum compaction effort for different PC mixtures
A. Material
Around 500 kg of coarse aggregates of sizes ranging from 4.75 to 19.0 mm were procured from an aggregate source near Jhajjar. The aggregates were sieved to obtain following size fractions: 19-13.2 mm; 13.2-9.5 mm; 9.5-6.7 mm; 6.7-4.75 mm and using these aggregate size fractions, two gradations were prepared, whose details are given below:
Gradations of Aggregates:
1) P4 Gradation: 50% 9.5 - 6.7 mm + 50% 6.7 - 4.75 mm
2) P6 Gradation: 25% 19 - 13.2 mm + 25% 13.2 - 9.5 mm + 25% 9.5 - 6.7 mm + 25% 6.7 - 4.75 mm.
RMC 53 grade cement confirming IS 12269: 2013 was used as binding material, which was procured directly from RMC cement plant.
B. Sample Preparation
In 12 samples of P4 gradations and 12 samples of P6 gradation using different combination of different compactions types and efforts were cast for each Los Angeles abrasion resistance and compressive strength test. After preparation, all the 48 samples were cured by keeping those in water for 14 days.After curing the weight of each of the samples prepared were measured and fresh density was calculated using the volume of the mold.
Fresh Density = Weight of Mixture / Volume of molds
Compaction energy of each compaction types and efforts were determined. By using a scatter plot of fresh density vs. compaction energy, the trend was determined.
Compaction Energy:
V. RESULT AND ANALYSES:
1700 1750 1800 1850 1900 1950
D
en
si
ty
K
g
/m
[image:3.612.186.424.79.326.2]3
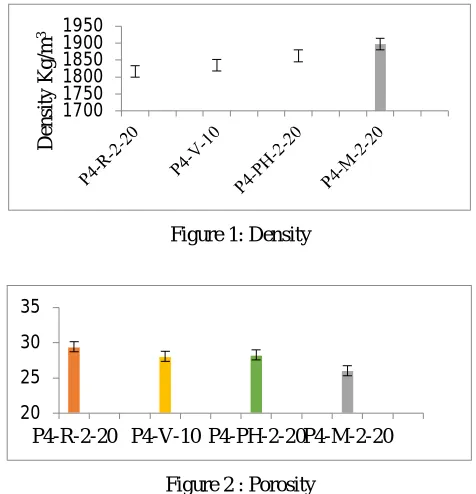
Figure 1: Density
20 25 30 35
P4-R-2-20 P4-V-10 P4-PH-2-20P4-M-2-20
Figure 2 : Porosity
As observed from the plot, P4-M-2-20 has minimum porosity and P4-R-2-20 has maximum porosity, indicating that compaction by rodding will result in the maximum porosity.
R² = 0.8609
24 26 28 30
1800 1820 1840 1860 1880 1900 1920
P
o
ro
si
ty
%
Density kg/m3
[image:3.612.181.435.374.487.2]P4 Mixture
Figure 3: Density vs. Porosity
Plot shows porosity changes with compaction types and efforts and it is observed that R-2L-20 shows maximum porosity percentage with minimum density and M-2L-20 shows minimum percentage porosity with maximum density.
2) For P6 Gradation Mixture: As observed from the plot, P6-M-2-20 has maximum density and R-2-20 has minimum density, indicating that compaction by rodding will result in the minimum density.
1700 1800 1900 2000 2100 2200
P6-R-2-20 P6-V-10 P6-PH-2-20P6-M-2-20
D
e
n
si
ty
K
g/
m
[image:3.612.185.429.568.663.2]3 P6 Mixture
10 15 20 25 30 35
P
o
ro
si
ty
[image:4.612.186.427.78.211.2]% P6 Mixture
Figure 5: Porosity
As observed from the plot, P6-M-2-20 has minimum porosity and R-2-20 has maximum porosity, indicating that compaction by rodding will result in the maximum porosity. Errors bars indicate one standard deviation
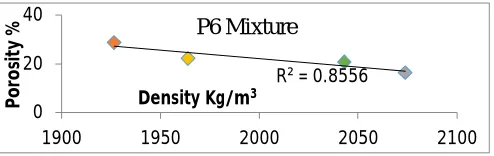
R² = 0.8556
0 20 40
1900 1950 2000 2050 2100
P
o
ro
si
ty
%
Density Kg/m3
[image:4.612.184.431.256.334.2]P6 Mixture
Figure 6: Density vs. Porosity
From Plot it is clear that as the density increases, porosity gradually decreases and porosity also changes with different compaction types and efforts. It is observed that R-2L-20 shows maximum porosity percentage with minimum density and M-2L-20 shows minimum percentage porosity with maximum density.
B. Abrasion Loss or Cantabro Loss
1) For P4 gradation mixture: Abrasion loss in each mixture compacted at different compaction energies. It was observed that the abrasion loss ranged from 45 – 68% and that R-2L-20B had maximum abrasion resistance percentage and M -2L-20B has minimum percentage abrasion resistance.
0 50 100
P4-R-2-20 P4-V-10 P4-PH-2-20 P4-M-2-20
A
b
ra
si
o
n
R
e
si
st
an
ce
%
Figure 7: Abrasion Loss (P4 graded Mixture)
[image:4.612.189.426.475.565.2]R² = 0.9043
0 20 40 60 80
24 26 28 30 32
A
b
ra
si
o
n
R
es
is
ta
n
c
e
%
[image:5.612.179.436.79.202.2]Porosity % P4 Mixture
Figure 8: Abrasion Loss vs. Void content
As the density increases, abrasion loss decreases. Increment in density refers to lesser void content or lesser pore volume. Compaction technique (P4-R-2-20, P4-V-10, P4-PH-2-20, and P4-M-2-20) with mean dry density ranging from 1800 - 1900k g/m3 has more abrasion loss as compared to compaction techniques. It is indicated that R-2-20 has more abrasion loss
R² = 0.9223 0
50 100
1750 1800 1850 1900 1950
A
b
ra
si
o
n
R
e
si
st
an
ce
%
[image:5.612.179.441.277.364.2]Density kg/m3 P4 Mixture
Figure 9: Abrasion Loss vs. Density
2) For P6 Gradation Mixture
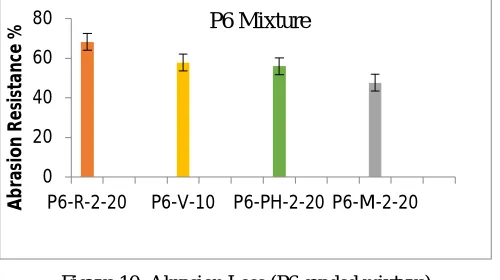
a) Abrasion Loss or Cantabro Loss: The graph signifies the abrasion loss of each sample when compacted differently with different efforts. Here the abrasion loss ranges from 47%- 69%. And it is observed that R-2L-20B has maximum abrasion loss and M-2L-20B has minimum percentage abrasion loss. PH-2-20 shows abnormally low abrasion loss.
0 20 40 60 80
P6-R-2-20 P6-V-10 P6-PH-2-20 P6-M-2-20
A
b
ra
si
o
n
R
e
si
st
a
n
ce
% P6 Mixture
Figure 10: Abrasion Loss (P6 graded mixture)
[image:5.612.183.433.440.580.2]R² = 0.9973
30 40 50 60 70 80
14 19 24 29 34
A
b
ra
si
o
n
r
e
si
st
a
n
ce
%
[image:6.612.187.426.77.205.2]Porosity % P6 Mixture
Figure 11: Abrasion Loss vs. void Content
As the density increases, abrasion loss increases initially, then after a particular mean density abrasion loss tends to decrease. Increment in density refers to lesser void content or lesser volume. Except P6-M-2-20, all other Marshall Compaction types are outliers and deviate from the normal trend, giving higher abrasion loss than expected.
R² = 0.8451
0 20 40 60 80
1900 1950 2000 2050 2100
A
b
ra
si
o
n
r
e
si
st
a
n
ce
%
Density kg/m3
[image:6.612.183.430.276.393.2]P6 Mixture
Figure 12: Abrasion Loss vs. Density
C. Compressive Strength 1) For P4 Gradation Mixture
a) Density and Porosity: As observed from the plot, P4-M-2-20 has maximum density and R-2-20 has minimum density, indicating that compaction by rodding will result in the minimum density. Density of all the consolidated samples with different efforts ranges from 1920 to 2080 kg/m3.
1850 1900 1950 2000 2050
D
e
n
si
ty
k
g/
m
[image:6.612.180.433.483.711.2]3
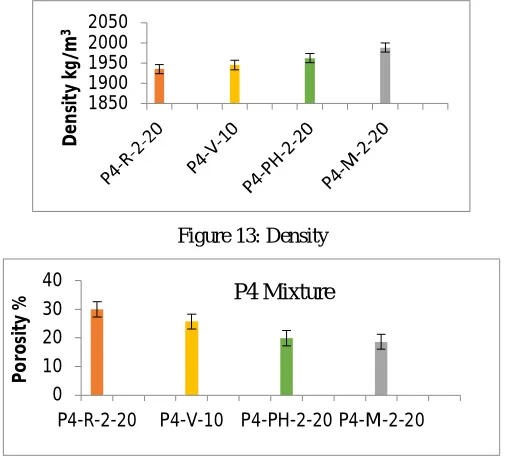
Figure 13: Density
0 10 20 30 40
P
o
ro
si
ty
It is observed from the plot, P4-M-2-20 has minimum porosity and R-2-20 has maximum porosity, indicating that compaction by rodding will result in the maximum porosity. Porosity of all the consolidated samples with different efforts ranges from 18-30 %. Errors bars indicate one standard deviation.
Trend of density vs. porosity, it is clear that as the density increases, porosity gradually decreases. Trend shows that with different compaction types and efforts porosity also changes. Here it is observed that R-2L-20 shows maximum porosity percentage with minimum density and M-2L-20 shows minimum percentage porosity with maximum density.
R² = 0.8508
0 10 20 30 40
1920 1940 1960 1980 2000
P
o
ro
si
ty
%
[image:7.612.178.434.161.281.2]Density kg/m3
Figure 15: Density vs. Porosity
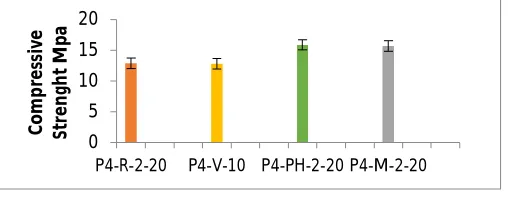
The graph of compressive strength of each sample when compacted differently with different efforts, it is observed that R-2L-20B has minimum compressive strength and M-2L-20B has maximum compressive strength. PH-2-20 shows abnormally high compressive strength. Error bars indicates one standard deviation.
0 5 10 15 20
P4-R-2-20 P4-V-10 P4-PH-2-20 P4-M-2-20
C
o
m
p
re
ss
iv
e
St
re
n
gh
t
M
p
[image:7.612.181.435.349.448.2]a
Figure 16: Compressive Strength
Plot shows that as the density increases, compressive strength increases for P4 graded mixtures. Increment in density refers to lesser void content or lesser pore volume. The outliers in this plot are vibrations for 10 seconds which show that in this case, strength loss increase more than expected. Error bars indicate one standard deviation.
Figure 17: Compressive strength vs. Density
Increment in void content of the mix results in decrement in compressive strength, it can also be observed that if void content is within the specified range of 18-30% then the strength loss is maximum.
R² = 0.7065
0
5
10
15
20
1920
1940
1960
1980
2000
C
o
m
p
re
ss
iv
e
S
tr
e
n
g
th
M
p
a
[image:7.612.192.436.524.647.2]R² = 0.8566
10 15 20
15 20 25 30 35
C
o
m
p
re
ss
iv
e
St
re
n
gt
h
M
P
a
[image:8.612.180.433.80.170.2]Porosity % P4 Mixture
Figure 18: Compressive Strength vs. Porosity
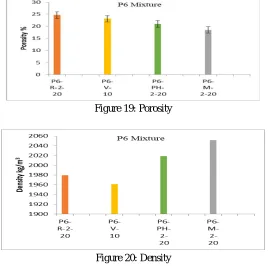
2) For P6 Gradation Mixture
[image:8.612.173.441.243.509.2]a) Density and Porosity: It is observed from the plot, P4-M-2-20 has minimum porosity and R-2-20 has maximum porosity, indicating that compaction by rodding will result in the maximum porosity.
Figure 19: Porosity
Figure 20: Density
The density as observed from the plot, P4-M-2-20 has maximum density and R-2-20 has minimum density, indicating that compaction by rodding will result in the minimum density.
R² = 0.8279
0 10 20 30
1950 2000 2050 2100
P
o
ro
si
ty
%
Density Kg/m3
[image:8.612.186.426.556.645.2]P6 Mixture
Figure 21: Density vs Porosity
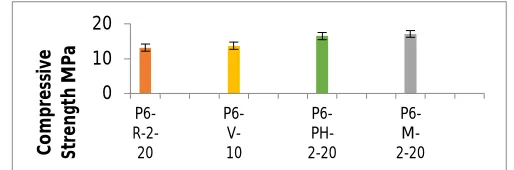
0 10 20 P6- R-2-20 P6- V-10 P6- PH-2-20 P6- M-2-20 C o m p re ss iv e St re n gt h M P a
Figure 22: Compressive Strength of differently compacted samples
As the density increases, compressive strength increases and it refers to lesser void content or lesser pore volume. It is indicated that R/2/20 have lesser compressive strength. This indicates that the past studies that have utilized rodding as compaction technique have over-estimated the strength loss, since rodding may not be appropriate as it may create rod holes in the specimen.
R² = 0.8671
0 10 20
1940 1960 1980 2000 2020 2040 2060
Co m p r es si v eS t re n g th M p a
Density Kg/m3
[image:9.612.176.433.80.165.2]P6 Mixture
Figure 23: Compressive Strength vs Density
Increment in void content of the mix results in decrement in compressive strength, it can also be observed that if void content is within the specified range of 18-25% then the strength loss is maximum. And if it crosses both the upper limit, it leads to decrement in the compressive strength, and if it is below the lower limit, it leads to imperviousness, causing functional failure. When the porosity increases, the compressive strength drops.
R² = 0.9184
0 5 10 15 20
0 10 20 30
C o m p re ss iv e St rn gh t M p a Porosity % P6 Mixture
Figure 24: Compressive strength vs. Porosity
VI. CONCLUSION
Based on the this report following are the observations
A. There is a strong correlation between the density and porosity of pervious concrete mixtures. This indicates that the control of the pavement density, and porosity, is important during placement of pervious concrete mixture.
B. Consolidation of pervious concrete cylinders by rodding produced cylinders that had a greater degree of variability than the cylinders consolidated using the Proctor hammer and Marshall Hammer and Vibration. A major cause of the increased variability was the creation of rod holes in the cylinders.
C. Consolidation by means of the standard Proctor hammer produced cylinders having porosity and density closest to that of the pavement. However, because 20 blows of the hammer was only used on project, it can be concluded that 20 blows of the Proctor hammer replicate the in situ pavement properties better.
[image:9.612.179.433.423.531.2]VII.ACKNOWLEDGEMENTS
I am very grateful to Prof. Ajit Singh, Faculty of Civil Engineering Department, CBS Group of Institutions, Jhajjar for the support rendered.
REFERENCES
[1] American Concrete Pavement Association. Stormwater Management with Pervious Concrete Pavement.
[2] Chandrappa, A, K., Biligiri, K, P., (2016a), Pervious concrete as a sustainable pavement material – Research findings and future prospects: A state-of-the-art review, Construction and Building Materials, Elsevier, Vol.111
[3] Chandrappa, A, K., Biligiri, K, P., (2016b), Comprehensive investigation of special permeability characteristics of pervious concrete: A hydrodynamic approach, Construction and Building Materials, Elsevier, UK
[4] Chen, Y., Wang, K., Wang, X., Zhou, W., Strength, Fracture and Fatigue of Pervious Concrete. Construction and Building Materials 42 (2013) 97–104. [5] Crouch, L. K., Cates, M.A., Dotson, V. J., Honeycutt, K.R, Badoe D. Measuring the effective air void content of Portland cement pervious pavements. Cement
Concrete Aggregate 2003; 25(1):16–20
[6] Cosic K, Korat L, Ducman V, Netinger I, and Influence of aggregate type and size on properties of pervious concrete 2015.
[7] Deo, O., Neithalath, N., Compressive Response of Pervious Concretes Proportioned For Desired Porosities. Construction and Building Materials 25 (2011) 4181–4189.
[8] E. Khankhaje, M.W. Hussin, J. Mirza, M. Rafieizonooz, M.R. Salim, Properties of sustainable lightweight pervious concrete containing oil palm kernel shell as coarse aggregate 2016.
[9] Gesoglu, M., Güneyisi, E., Khoshnaw, G., Ipek, S., Abrasion And Freezing–thawing Resistance of Pervious Concretes Containing Waste Rubbers. Construction and Building Materials 73 (2014) 19–24.
[10] Ghafoori, N., Dutta, S., Building and Non pavement Applications of No-Fines Concrete. Journal of Materials in Civil Engineering, Vol. 7, No.4, November, 1995
[11] Ghafoori, N., Dutta, S., Laboratory investigation of compacted Nofines concrete for paving materials, J. Struct. Eng., ASCE, Vol. 7, No. 3, 1995, p 183-191. [12] Haselbach, L. M., Valavala, S., Montes, F., Permeability Predictions For Sand-Clogged Portland Cement Pervious Concrete Pavement Systems. Journal of
Environmental Management 81 (2006) 42 – 49
[13] Huang B, Xiang Shu WH, Burdette GE, Laboratory evaluation of permeability and strength of polymer-modified pervious concrete 2009
[14] Ibrahim, A., Mahmoud, E., Yamin, M., Patibandla. V., Experimental Study on Portland cement Pervious Concrete Mechanical and Hydrological Properties. Construction and Building Materials 50 (2014) 524–529
[15] Lian, C., and Zhuge, y., Optimum mix design of enhanced permeable concrete - an experimental investigation. Journal of Construction and Building materials, Dec, 2010.