Abstract— The system for multispectral acquisition and inspection of anatomical structures of an eye is presented. It is dedicated to the diagnoses of retinal and external eye structures. The basic components of the system are a slit lamp, liquid crystal tunable filter, high sensitivity monochrome camera and specialized control software. Multispectral image processing procedures to the visualization and further processing purposes are proposed. Dimensionality reduction techniques are used to reduce spectral space into three dimensional ones by linear and non linear transformations. On the basis of three dimensional spaces color images are constructed. To reduce the impact of non uniform lightening of captured spectra, two methods of spectra normalization are proposed. The examples of collected multispectral images containing eye structures and the results of their processing are presented.
Index multispectral imaging, retina diagnosis, dimensionality reduction, unsupervised learning, manifold learning, Principal Component Analysis, Kernel Principal Component Analysis
I. INTRODUCTION A. Multispectral imaging
isible light is caused by electromagnetic radiance which reaches a human eye. The radiance passing the lens of a human eye is focused on a retina. The three types of photoreceptors are located on human retina. They aggregate captured radiance and send aggregated data to the human brain, which reconstructs color image. This is the reason why color spaces are three dimensional. The dimensions of a basic color space correspond to the aggregation of radiance intensities of retina photoreceptors. Because of hardware limitations, the color acquisition is usually performed by RGB detectors. They aggregate electromagnetic radiance intensities according to the spectra of red, green and blue colors. RGB detectors are very
Manuscript received January 11, 2012; revised January 18, 2012. This work was financed from the Polish Ministry of Science and Higher Education resources in 2009-2012 years as a research project.
Adam Switonski is with the Polish-Japanese Institute of Information Technology, Aleja Legionów 2, 41-902 Bytom, Poland and Silesian University of Technology, ul. Akademicka 16, 41-100 Gliwice, Poland; (e-mail: [email protected], [email protected]).
Tomasz Błachowicz is with the Silesian University of Technology, ul. Akademicka 16, 41-100 Gliwice, Poland; (e-mail: [email protected]).
Marcin Zieliński is with the Wrocław Medical University, ul. Borowska 213, 50-556 Wrocław, Poland
Henryk Josiński is with the Polish-Japanese Institute of Information Technology, Aleja Legionów 2, 41-902 Bytom, Poland and Silesian University of Technology, ul. Akademicka 16, 41-100 Gliwice, Poland; (e-mail: [email protected], henryk.josinski@polsl,pl).
similar to retina photoreceptors, but they do not fully correspond. It results in the impossibility to obtain complete color palette visible by a human.
Much more detailed information of an electromagnetic radiance is stored by multispectral images. They contain direct spectral data of its every pixel, represented by radiance intensities captured for successive wavelengths. A multispectral image has a form of three dimensional cube. Two dimensions are responsible for a spatial domain and the third one is of spectral domain. Its structure can be divided into spectral channels, each of them containing intensities of selected wavelength and represented by a monochromatic image. The spectral resolution depends on number of spectral channels.
Multispectral imaging gives detailed spectrum data about its every pixel, in contrast to the color image, which contains only spectrum aggregation. Thus, objects indistinctive in color spaces still could be discriminated in spectral spaces. This gives new possibilities to applications of imaging systems, but also makes processing and the analysis of such multichannel images much more complex and difficult. There are many applications of multispectral imaging: Biomedicine: The methods of tumor and cancer detection based on spectral data can be found in [1],[2],[3],[4]; Geography and geology: Multispectral imaging improves objects detection and classification, for instance of rocks, soils and vegetation [5]; Agriculture and forestry: Evaluation of plants state population, ocean flora or forest stands is more detailed thanks to multispectral imaging. For instance in [6] spectral imagery is applied to the detection of vegetation of ten different classes; Archeology and art history: It is used in verifying the authenticity of works of art, as for instance paintings or books, and in detecting some hidden contents. In [7] 16th century paintings are analyzed to characterize the paint layers. There are also multiple applications in such areas as biology, crime detection, salvage service, meteorology, etc.
B. Retinal diagnosis based on color imaging
The idea of application of multispectral imaging to ophthalmic diagnosis is based on our earlier experience of multispectral imaging in cancer detection and experience and the analysis of the methods proposed in the literature for diagnoses of glaucoma and diabetic retinopathy diseases, based on color fundus eye images. These diseases are two most often causes of blindness in current population. In case of glaucoma, the increased pressure causes optic disc degeneration, damaging eyecup shape, especially in comparison to the shape of the optic disc [8]. In [9] the method which uses shape coefficients of the segmented eyecup and optic disc, genetic feature selection technique and multilayer perceptron classifier is proposed for
Dimensionality Reduction of Multispectral
Images Representing Anatomical Structures of
an Eye
Adam Świtoński, Tomasz Błachowicz, Marcin Zieliński, Henryk Josiński
glaucoma diagnosis. Numerous methods were proposed for automatic retina segmentation, which is a crucial step of glaucoma diagnosis. They are based on watershed transformation [9], Hough transform [10],[11], active contours [12], mathematical morphology [13], template matching [14],[15] or adaptive thresholding [16]. However, all of the above mentioned methods lack high contrast between retina anatomical structures in color spaces. Diabetic retinopathy results in retina degenerations. In the first stage of the disease the structure of capillaries is damaged. Local dilations occur, visible as small red spots on retina images. Further, the artery strokes appear. The accumulations of lipids and protein cause other lesions called exudates. They are represented by bright, reflective, white or cream colored areas of different sizes on retina, similar to optic disc and eyecup, but with irregular shapes. In the last stage of diabetic retinopathy, the structure of vascular network is degenerated, forming shapes with greater curvature. There are numerous methods meant to detect diabetic retinopathy symptoms based on the color retina images. The microaneurysm can be located by HitMiss operator and watershed transform [17], blood vessels by top-hat applied to the contrast enhanced image [18] or top-hat followed by toggle mapping technique [13] and exudates by geodesic reconstruction [19]. Similarly to glaucoma, there is no strict distinction in color spaces of detected abnormalities and anatomical structures.
II. MULTISPECTRAL CAPTURING DEVICE FOR OPHTHALMIC DIAGNOSIS
In multispectral acquisition of eye structures we use our prototype multispectral capturing device [20]. Its main components are liquid crystal tunable filter [21], high sensitivity monochrome camera and dedicated control software. The tunable filter can control spectral transmission by proper polarization of crystal plates. It removes electromagnetic radiance outside narrow specified range. High sensitivity monochrome camera is responsible for capturing radiance passing through the filter. It summarizes the intensities from the visible light range. Thus, it registers only the radiance of the specified wavelength. The camera and the filter are synchronized by dedicated control software. The control software iterates the acquisition of successive spectral channels. It sets the filter with the specified wavelength, waits until the “ready” reply and communicates with the camera to take photograph. Suitable device interfaces for the filter and camera are designed, hence the software implementation is not limited to applied hardware
[image:2.595.319.547.127.227.2]To be able to capture anatomical eye structures, a slit lamp is placed at the front of the multispectral device. It has to be extended with a Volk lens or substituted by a fundus camera in the case of retina acquisition. Optical systems of a slit lamp or fundus camera and the proposed multispectral device are connected by means of interconnective objective, which focuses the radiance on the CCD detector of a camera. The resolution of the spectral domain depends on the ability of the filter – the size of the filtered window. The structure of the proposed capturing device is presented in Fig. 1.
While constructing the device, we have chosen a Varispec liquid crystal tunable filter [22] and an Andor Luca monochrome camera [23]. The above mentioned window size of the filter gives 21 different disjoint spectral channels
[image:2.595.308.538.251.399.2]from the range of the visible light. The average switch time for the filter is about 50ms. The Andor camera has a low noise CCD matrix, VGA resolution and a 16 bit grayscale. The prototype model of our multispectral capturing device is presented in Fig. 2 [24].
Fig. 1 The structure of the proposed multispectral capturing device
Fig. 2 The prototype multispectral capturing device
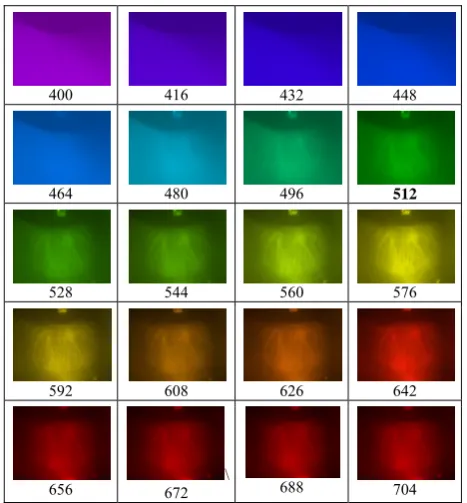
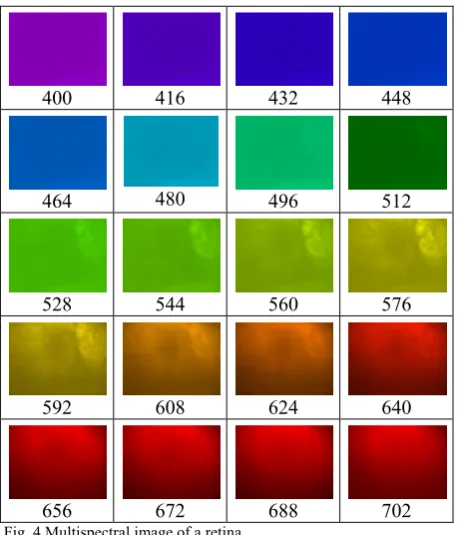
In Fig. 3 and Fig. 4 the first 20 spectral channels of example multispectral images of external eye structures and retina are presented. Channels are colorized by corresponding channels’ wavelength color. Such images are visible after passing the filter. In Fig 3 small fragment of an iris, celiary body and eye lid can be seen. In Fig. 4 optic disc located in the upper right region of the image, macula in the center and blood vessels are visible.
400 416 432 448
464 480 496 512
528 544 560 576
592 608 626 642
656 672 \ 688 704
Fig. 3 Multispectral image of a front part of an eye
Slit Lamp
Interconnect objective
LCD Tunnable Filter
Image Objective Interconnect
[image:2.595.310.544.503.755.2]. We can notice much greater noise for the shorter wavelengths, especially for the retina image. It is caused by non uniform characteristics of the filter which smothers radiance differently in the following spectral windows, much stronger for shorter wavelengths [25],[20]. The second reason is the fact of lower contrast of retina for blue color range.
On the basis of spectral channels analysis, we can evaluate their distinctiveness to selected anatomical structures. There are no great differences between spectral channels for the front part of an eye. For the retina image the greatest contrast is visible for green and yellow color ranges. That is what we have expected. Dominant colors of a retina are red, orange and yellow. The red color has strong intensity for all parts of the retina, but low variation, which means it is not very distinctive.
400 416 432 448
464 480 496 512
528 544 560 576
592 608 624 640
[image:3.595.55.285.243.511.2]656 672 688 702
Fig. 4 Multispectral image of a retina
III. DIMENSIONALITY REDUCTION
The least complex visualization of a multispectral image, which stores all pieces of information, contains every multispectral channel as a separate monochrome image, as shown in Fig. 3 and Fig. 4. The main disadvantage of such a visualization is the inconvenience of the inspection for a human. We are not able to observe simultaneously such a large set images, hence the analysis of relations between spectral wavelengths of the following image points is limited. It is still possible to reconstruct the original color image. It requires calibration process, which determines the transformation between spectral space of the device and RGB color space. The results of calibration of our device on the basis of supervised learning can be found in [20]. However, the transformation of multispectral images to RGB color space causes significant loss of information stored by spectral spaces and makes the device a default color camera. In practice it should be applied only to the quick preview purposes, for instance to localize region of interest. Detailed analysis has to be carried out taking into
consideration all spectral data.
Some of the attributes of high dimensional spaces are very often correlated with each other and some of them are meaningless. It makes it possible to reduce them into lower dimensional spaces, retaining the majority of the information. Crucial is the technique of dimensionality reduction which should be able to explore the original feature space by determining the independent, most significant transformations of the input attributes.
Taking that into consideration, we have decided to color a multispectral image artificially on the basis of the spectral space dimensionality reduction to three dimensions. The new space components are considered to be RGB color values. The proper choice of the reduction method would store most of the data of the spectral space. What is more, a single color image can be easily interpreted and analyzed by a human.
There are numerous dimensionality reduction techniques. We can divide them into two main categories: the linear methods which linearly transform input feature space and non linear methods. Non linear methods assume the existence of low dimensional manifolds on the basis of which the input data is localized and describe the transformed data by their positions on the discovered manifolds.
The best well known examples of linear methods are: 1) Principal Component Analysis (PCA) [26], which finds the linear combinations of input variables with the greatest variances, 2) Independent Component Analysis (ICA) minimizing statistical dependency between transformed components [27], and 3) Linear Discriminant Analysis (LDA). LDA is a supervised method, which means that the input data has to be grouped into classes. LDA finds linear combinations with best possible discrimination between the input vectors of different classes [28]. It is strongly related to the class selections and cannot be performed automatically – the multispectral images have to be labeled by class values, prior to the reduction.
The extension of the PCA is the Kernel Principal Component Analysis (KPCA). KPCA maps the original space on the basis of kernel function, which allows us to take its non linear properties. into consideration [29]. Other most often used nonlinear reduction methods are Isomap and Local Linear Embedding (LLE). Isomap applies Multidimensional Scaling (MDS), which preserves the distances between objects in the lower dimensional spaces. The geodesic distances in the original space are considered by the Isomap. LLE assumes local linearity of the input space and reconstructs each sample by the linear combination of its neighbors. In the final step of LLE, the determined weights are mapped on the embedding global coordinates.
images we can prepare two types of the trainsets: the local and global ones. The local trainset contains spectral signatures only for the reduced image and the global one is constructed on the basis of multiple images. The local trainset is suited to the reduced image better, it means that the reduction would preserve more details and the visualization would reveal stronger the invisible regions. Unfortunately, it has also one important disadvantage – the generated color images representing different multispectral photographs are not directly comparable – the same colors in different images may correspond to other regions in the spectral space. For the global trainset, the selection of the images is crucial. The representation of the reduced spectral regions in the trainset is necessary for the proper reduction. There is one limitation of the Isomap and LLE reductions. The discovered manifolds by them are not general, because they are directly associated with the trainset samples. It means that only samples of the trainset can be reduced. It causes a restriction for the global trainset, which has to contain spectral signatures of the reduced image. There is no such a constraint for other described techniques.
There are many applications of dimensionality reductions. We briefly enumerate only a few of them. In [30] and [31] the linear PCA and ICA methods are used for the motion capture skeleton model parameters and binary silhouettes extracted from the video images. In [32] the silhouettes are reduced by Isomap. The sequences of reduced human poses are classified by Dynamic Time Warping, Hiden Markov Models and on the basis of extracted sequence features. The application of Kernel PCA to pose classification is presented in [33]. Dimensionality reduction is a major step in the most system of face recognition: linear [34] and non linear [35] methods are used. Dimensionality reduction is also applied in areas such as: analysis of the stock market [36], detection of the network attacks [45], biomedical datasets analysis [37], palmprint recognition [38], hand and finger tracking [39] and many others.
There are of course numerous examples of spectral dimensionality reductions. In [40] spectrally segmented regions of hyperspectral plant images are transformed by PCA for further classification. In [41] ICA method is used for the hypersepctral remote sensing imagery classification. Similar approaches dedicated to land cover detection and geological investigations by Isomap and LLE are presented in [42] and [43].
We apply classical linear Principal Component Analysis and nonlinear Kernel Principal Componet analysis. The Isomap and LLE are rejected because of the limitation associated with the global trainset.
A. Principal Component Analysis
The PCA method calculates linear independent combinations Y of the inputs attributes X with the greatest variances, which are called principal components. In fact it determines new base T
V
of the vector space. It turns out, that the base created by the eigenvectors of the covariance attributes matrix satisfies the demands.
1 1 0 1 1 0 1 1 0 n T n T T T nx
x
x
v
v
v
x
V
y
y
y
y
The variances of the new attributes are determined by corresponding eigenvalues. Thus, we can sort the new attributes according to their variances and remove the less informative ones.
We can calculate the variance cover for the principal components which gives information about the percentage of variance of the input feature space, explained by the component. It is equal to the ratio of corresponding eigenvalue to the total sum of all eigenvalues.
The weights of the linear combinations reflect an impact of successive wavelengths on the given principal component. They are further called eigenspectra.
A. Kernel Principal Component Analysis
In the Kernel PCA method [29], the nonlinear transformation , of the input feature space into output space is considered:
Φ: → (1)
Similarly as in PCA, the new space is reduced on the basis of eigenvectors of covariance matrix. It turns out that if we know the matrix M of the dot products in the space F, the problem is simplified to determination of the eigenvectors and eigenvalues of the matrix M in the training phase and performing linear combinations on the basis of calculated dot products in F in the reduction phase:
M Φ x ∙ Φ x (2)
∙ Φ x ∑ ∙ Φ x ∙ Φ x (3)
where is the k-th eigenvector of M and is its i-th component. It means that we do not have to know direct mapping , only the way to calculate the dot products in F is required. They can be determined on the basis of the kernel functions [29], [45]. The most often used ones are radial basis functions k x , x e
‖ ‖
and polynomial k x , x x ∙ x kernels.
IV. SPECTRA NORMALIZATION
There is one more issue to consider before performing dimensionality reduction. It is non uniform lighting condition during the acquisition process. It usually has greater intensity in the center area and is weaker in the neighborhood of boundaries. It is possible that dimensionality reduction discovers this fact and would construct new spaces on the basis of spectrum intensity rather than its shape.
To minimize the impact of non uniform lightening on dimensionality reduction of spectral space we propose two spectral normalization approaches N1 and N2. Both of them work independently for each image pixel.
In N1 a spectrum is fitted to (0,1) range in a linear way. It means the smallest and greatest values of spectral components are determined, and linear scaling is performed:
. I x, y, λ s x, y ∙ I x, y, λ c x, y (4)
c x, y min I x, y, λ
In N2 the spectrum components form a vector, which is resized to default unit length:
I x, y, λ , ,
‖ , ,: ‖ (5)
where ‖I x, y, : ‖ is a spectrum norm. We use Euclidean metric:
‖I x, y, : ‖ ∑ I x, y, λ (6)
V. RESULTS AND CONCLUSIONS
[image:5.595.310.541.100.386.2]Because of limited paper size only results obtained for local trainsets and polynomial kernel function of KPCA method are presented.
Fig. 5 and Fig. 6 contain aggregated variance covers of the first n principal components for the front part of an eye and retina images respectively. The dimensionality reduction is much more efficient for the eye image - three PCA components store almost 93% of variance. Spectral channels of a retina image are much less correlated. However, in that case, three dimensional space obtains still acceptable level of 53% of variance cover.
Fig. 5 Variance cover of PCA components for image from Fig. 3. (Raw – without normalization, N1 – normalization N1, N2 – normalization N2)
[image:5.595.48.289.311.383.2]Normalization N1 for the front eye image makes the dimensionality reduction more difficult. There is no such an observation for the retina image – the results are very similar to the raw spectra. Normalization N2 improves variance cover for a retina image and does not have an impact on variance cover of eye image.
Fig. 6 Variance cover of PCA components for image from Fig. 3. (Raw – without normalization, N1 – normalization N1, N2 – normalization N2)
Fig. 7. PCA Eigenspectra for images from Fig 3 and Fig. 4
In Fig. 7 the PCA eigenspectra for both analyzed in the paper images are presented. The absolute values of
coefficients are visualized. First, most informative, PCA component covers green and red color range for the retina image and almost all visible light range for the front eye image. This is what we expected. Dominant colors of a retina are red and green and front eye is mainly grayscale.
PCA PCAN1
-PCAN2 KPCA
[image:5.595.312.539.430.707.2]KPCA N1 KPCA N2
Fig. 8. Dimensionality reduction results of the eye multispectral image from Fig. 3 (PCA – Principal Component Analysis, KPCA Kernel Principal Component Analysis with Polynomial Kernel, N1 – Normalization N1, N2 Normalization N2)
PCA PCA N1
PCAN2 KPCA
KPCA N1 KPCA N2
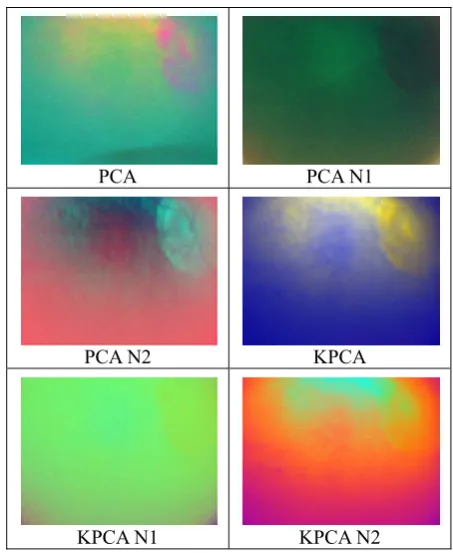
Fig. 9. Dimensionality reduction results of the retina multispectral image from Fig. 4 (PCA – Principal Component Analysis, KPCA Kernel Principal Component Analysis with Polynomial Kernel, N1 – Normalization N1, N2 Normalization N2)
Fig. 8 and Fig. 9 contain color images representing the first three components of reduced feature spaces for the front eye and retina images respectively. The results are satisfactory.
20.00% 40.00% 60.00% 80.00% 100.00%
Raw
N1
N2
20.00% 40.00% 60.00% 80.00% 100.00%
Raw
N1
N2
0 0.1 0.2 0.3 0.4 0.5 0.6
400 450 500 550 600 650 700
PCA 1 Retina PCA 2 Retina
PCA 3 Retina PCA 1 Eye
[image:5.595.45.285.493.755.2]For the front eye image there are visible boundaries between basic anatomical structures. Especially the contrast of the celiary body is enhanced. In the case of retina image, optic disc, macula and vascular network regions can be discriminated. In our subjective opinion the best result for the front eye image is KPCA N1 and for the retina image is PCA N2.
The normalization minimizes non uniform lighting conditions, but in some cases it also removes discriminative data of anatomical structure from a spectral space. It can be noticed for an iris of the front eye image.
We are going to continue the work. On the basis of reduced spectral spaces we would like to design and implement the system for automatic or semiautomatic detection of anatomical structures of an eye.
REFERENCES
[1] Świtoński A., Michalak M., Josiński H., Wojciechowski K.: Detection of Tumor Tissue Based on the Multispectral Imaging, in Computer Vision and Graphics, Lecture Notes in Computer Science, Part 2, p. 325-333, Springer 2010.[4] Bieda R.,
[2] Bieda R., Świtoński A., , Kwiatek S., Latos W., Cieślar G., Sieroń AK lasyfikator jądrowej wersji maszyny wektorów podpierających wspomagający diagnostykę obszarów nowotworowych w wielospektralnym obrazowaniu endoskopowym, Przegląd Elektrotechniczny, (Electrical Review), 2010, R. 86 nr 12, s. 13-16, [3] Woolfe F., Maggioni M., Davis G., Warner F.,Coifman R., Zucker S.:
Hyperspectral microscopic discrimination between normal and cancerous colon biopsies.,IEEE Transactions on Medical Imaging, VOL. 99, NO. 99, 1999
[4] Rajpoot K., Rajpoot N. SVM Optimization for Hyperspectral Colon Tissue Cell Classification, in Medical Image Computing and Computer Assisted Intervention, 2004
[5] Carvalho, O.A., Carvalho, A.P.F. Guimaraes, R.F., Lopes, R.A.S., Guimaraes, Souza Martins, E. Pedreno, J.N., Classification of hyperspectral image using SCM methods for geobotanical analysis in the Brazilian savanna region, Geoscience and Remote Sensing Symposium, 2003. IGARSS '03. Proceedings. IEEE International, 2003
[6] P.H. Hsu, Feature extraction of hyperspectral images using matching pursuit, in ISPRS Journal of Photogrammetry and Remote Sensing Volume 62, Issue 2, p. 78-92 , 2007
[7] Lau D. Villis C., Furman S., Livett M.: Multispectral and
hyperspectral image analysis of elemental and micro-Raman maps of cross-sections from a 16th century painting, in Analytica Chimica Acta Volume 610, Issue 1, p. 15-24, 2008
[8] Kanski J. et al. Glaucoma: a color manual of diagnosis and treatment. Butterworth-Heinemann
[9] Stąpor K., Świtoński A.: Automatic analysis of fundus eye images using mathematical morphology and neural networks for supporting glaucoma diagnosis. Machine Vision and Graphics, 2004 [10] Tamura S., Okamoto Y.: Zero-crossing interval correction in tracing
eye-fundus blood vessels. Pattern, Recognition, Vol. 21, No. 3, 227-233, 1988
[11] Pinz A., et al.: Mapping the human retina. IEEE Trans. Medical Imaging, Vol.1, 210-215. 1999
[12] Morris D.T., Donnison C.: Identifying the Neuroretinal Rim Boundary Using Dynamic Contours. Image and Vision Computing, Vol. 17, 169-174.
[13] Walter T., Klein J.: Segmentation of color fundus images of the human retina: detection of the optic disc and the vascular tree using morphological techniques. Proc. 2nd Int. Symp. Medical Data Analysis, 282-287, 2001
[14] Osareh A. et al.: Classification and Localisation of Diabetic-Related Eye Disease. 7th European Conference on Computer Vision (ECCV), Springer LNCS 2353, May, 502-516.2002
[15] Lowell J.: Optic nerve head segmentation. IEEE Trans. Medical Imaging, Vol.23, 256-264, 2004
[16] Stapor K, Pawlaczyk L., Chrastek R., Michelson G., Automatic Detection Of Glaucomatous Changes Using Adaptive Thresholding And Neural Networks, 2004
[17] Stąpor K., Świtonski A, Automatic detection of early sympthoms of diabetic retinopathy from fundus images using mathemathical morphology, Studia Informatica, , 2004
[18] Stąpor K., Świtonski A, Blood vesssles segmentayion from fundus images using mathemathical morphology, Studia Informatica, 2004 [19] Sopharak A, Uyyanonvara B, Barman S., VongkittIrux S.,
Wongkamchang N, Fine Exudate Detection using Morphological Reconstruction Enhancement, International Journal of Applied Biomedical Engineering, vol. 1, no. 1, 2
[20] Świtoński A., Błachowicz T., ,Zieliński M,,, Misuk-Hojło M., Wojciechowski K., Ophthalmic diagnosis based on multispectral imaging, Electrical Review) Vol 2011, No 12b
[21] Ophthalmic diagnosis based on multispectral imagingGat N.: Imaging spectroscopy using tunable filters: a review., Proc SPIE-Int SocOpt Eng. 2000
[22] Varispec Filters, http://www.spectralcameras.com/varispec Accessed 31 December 2011
[23] Andor Luca Website, http://www.andor.com/scientific_cameras/luca, Accessed 3 january 2012
[24] Website of the PJWSTK Multispectral Group http://as.pjwstk.edu.pl , Accessed 3 January .2012
[25] Switonski A., Bieda R., Wojciechowski K, Multispectral imaging for supporting colonoscopy and gastroscopy diagnosis, monograph Human-Computer Systems Interaction. Backgrounds and Applications 2, Spriger-Verlag, 2011
[26] Witten I., Frank E.: Data Mining: Practical Machine Learning Tools and Techniques, Morgan Kaufmann, 2005
[27] Common P., Independent component analysis, A new concept?, Signal Processing 36 (1994
[28] Martinez A, Member, Kak A., PCA versus LDA, IEEE Transaction on Pattern Analysis and Machine Intelligence, Vol. 23, No. 2, 2001 [29] Scholkopf B. , Smola A., Müller K. , Kernel principal component
analysis, , Advances in Kernel Methods – Support Vector Learning, 1999
[30] Switonski, A.; Polanski, A.; Wojciechowski, K., Human identification based on the reduced kinematic data of the gait, Image and Signal Processing and Analysis (ISPA), 2011 7th International Symposium on
[31] M. Pushpa Rani and G.Arumugamz, An Efficient Gait Recognition System For Human Identification Using Modified ICA, International Journal of Computer Science and Information Technology, vol. 2, no. 1, 2010
[32] Cheng, M. Ho, C.Huang, Gait Analysis For Human Identification Through Manifold Learning and HMM, Pattern Recognition, vol. 41, no. 8, pp. 2541–2553, 2008
[33] Switonski, A., Josinski, H., Jedrasiak, K., Polanski, A., and Wojciechowski, K.W. Classification of Poses and Movement Phases. In Proceedings of ICCVG (1). 2010, 193-200.
[34] Turk M.A., Pentland A.P., Face Recognition Using Eigenfaces, IEEE Conf. on Computer Vision and Pattern Recognition, 1991.
[35] Li R., Hao W., Tu Y., Wang C., Face Recognyion Using KFD-Isomap, Proceedings of the Fourth International Conference on Machine Learning and Cybernetics, Guangzhou, 18-21 August 2005 [36] Matematik J, Principal Component Analysis in Modelling Stock
Market Returns,. Matematika, 2004
[37] Weng S., Zhang C., Lin Z., Zhang X.,Mining the structural knowledge of high-dimensional medical data using Isomap, Medical and Biological Engineering and Computing Volume 43, Number 3, 2005 [38] Connie T., Teoh A., Goh M., Ngo D., Palmprint Recognition with PCA
and ICA, Lecture Notes in Computer Science, 2010
[39] Kato M., Chen Y., Xu G., Articulated Hand Tracking by PCA-ICA Approach, Proc of the IEEE Conf on Automatic Face and Gesture Recognition, Southampton, 2006
[40] Tsai F., Lin E.-K., Yoshino K.., Spectrally segmented principal component analysis of hyperspectral imagery for mapping invasive plant species, International Journal of Remote Sensing, 2006 [41] Du Q., Kopriva J., Independent-component analysis for hyperspectral
remote sensing imagery classification, Optical Engineering, 2006 [42] Chen y., Crawford m. , Ghosh J., Applying Nonlinear Manifold
Learning to Hyperspectral Data for Land Cover Classification, International Geosci. and Remote Sens. Symposium, Seoul, , 2005 [43] Doster T., Benedetto J., Czaja W., Nonlinear Dimensionality
Reduction for Hyperspectral Image Classification, Project Final Report 2011
[44] Aizerman A., Braverman E. M., Rozoner L. I., Theoretical foundations of the potential function method in pattern recognition learning , Automation and Remote Control, Vol. 25, 1964 [45] Labib K., Rao Vemuri V. An Application of Principal Component