ORIGINAL RESEARCH
ADULT BRAIN
High Signal Intensity in the Dentate Nucleus and Globus
Pallidus on Unenhanced T1-Weighted MR Images:
Comparison between Gadobutrol and Linear
Gadolinium-Based Contrast Agents
XF.G. Moser,XC.T. Watterson,XS. Weiss,X M. Austin,XJ. Mirocha,XR. Prasad, andXJ. Wang
ABSTRACT
BACKGROUND AND PURPOSE: In view of the recent observations that gadolinium deposits in brain tissue after intravenous injection, our aim of this study was to compare signal changes in the globus pallidus and dentate nucleus on unenhanced T1-weighted MR images in patients receiving serial doses of gadobutrol, a macrocyclic gadolinium-based contrast agent, with those seen in patients receiving linear gadolinium-based contrast agents.
MATERIALS AND METHODS: This was a retrospective analysis of on-site patients with brain tumors. Fifty-nine patients received only gadobutrol, and 60 patients received only linear gadolinium-based contrast agents. Linear gadolinium-based contrast agents included gadoversetamide, gadobenate dimeglumine, and gadodiamide. T1 signal intensity in the globus pallidus, dentate nucleus, and pons was measured on the precontrast portions of patients’ first and seventh brain MRIs. Ratios of signal intensity comparing the globus pallidus with the pons (globus pallidus/pons) and dentate nucleus with the pons (dentate nucleus/pons) were calculated. Changes in the above signal intensity ratios were compared within the gadobutrol and linear agent groups, as well as between groups.
RESULTS:The dentate nucleus/pons signal ratio increased in the linear gadolinium-based contrast agent group (t⫽4.215,P⬍.001), while no significant increase was seen in the gadobutrol group (t⫽ ⫺1.422,P⫽.08). The globus pallidus/pons ratios followed similarly, with an increase in the linear gadolinium-based contrast agent group (t⫽2.931,P⬍.0001) and no significant change in those receiving gadobutrol (t⫽0.684,P⫽.25).
CONCLUSIONS: Successive doses of gadobutrol do not result in T1 shortening compared with changes seen in linear gadolinium-based contrast agents.
ABBREVIATIONS:DN⫽dentate nucleus; GBCA⫽gadolinium-based contrast agent; GP⫽globus pallidus
T
he use of gadolinium-based contrast agents (GBCAs) has be-come an important adjunct for MR imaging examinations. Although GBCAs are considered extremely safe in patients with-out renal failure, it is known that free gadolinium (Gd3⫹) is toxicto humans. The ability of a chelating agent to retain the gadolinium and therefore maintain its safety profile has been shown to correlate with the structure and stability of the chelating molecule.1As
dem-onstrated by both in vivo and in vitro studies, macrocyclic chelating
agents are generally more stable than linear ones, bind Gd3⫹more
tightly, and have lower dissociation rates.1-5
Recent data indicate that patients exposed to multiple admin-istrations of certain GBCAs may exhibit dose-related T1 shorten-ing in the globus pallidus (GP) and dentate nucleus (DN).6-12
Moreover, these imaging findings have correlated with gadolin-ium deposition in the GP and DN on postmortem examinations, even in patients with relatively normal renal function.13,14
In-creased signal intensity in the GP and DN on unenhanced T1-weighted MR images has been positively correlated with prior exposure to both ionic and nonionic linear GBCAs in patients.6
Results regarding macrocyclic agents have been more varied. In 2015, Kanda et al10found that hyperintensity in the DN was
associated with past administration of the linear GBCA gadopen-tetate dimeglumine (Magnevist; Bayer HealthCare Pharmaceuti-cals, Wayne, New Jersey) but not with the macrocyclic GBCA gadoteridol (ProHance; Bracco Diagnostics, Princeton, New Jer-sey). While Radbruch et al9did not find a significant signal
inten-Received June 26, 2017; accepted after revision November 15.
From the Department of Imaging (F.G.M., C.T.W., S.W., R.P.), S. Mark Taper Foundation Imaging Center, and Samuel Oschin Comprehensive Cancer Institute (J.M.), Cedars Sinai Medical Center, Los Angeles, California; Department of Radiology (M.A.), Lahey Clinic, Burlington, Massachusetts; and Bayer Healthcare (J.W.), Whippany, New Jersey. This work was supported by Bayer Healthcare, Project No. 00042369. Please address correspondence to Franklin G. Moser, MD, MMM, Department of Imaging, S. Mark Taper Foundation Imaging Center, Cedars Sinai Medical Center, 8700 Beverly Blvd, Los Angeles, CA 90048; e-mail: Franklin.Moser@cshs.org; @fgmosermd
sity increase in the DN and GP after progressive applications of the macrocyclic GBCA gadoterate meglumine (Dotarem; Guer-bet, Aulnay-sous-Bois, France), Stojanov et al12found a
signifi-cant increase in signal intensity within the DN and GP in patients with relapsing-remitting multiple sclerosis after multiple doses of the macrocyclic GBCA gadobutrol (Gadavist; Bayer Scher-ing Pharma, Berlin, Germany). The study of Stojanov et al suggests that deposition of gadolinium within the brain may occur not solely as the result of linear GBCA administration but also with some types of macrocyclic agents. To confuse matters, the reports of Stojanov et al were quickly disputed by multiple contradicting studies showing no T1 signal change following the administration of the widely used macrocyclic agent gadobutrol.15,16
Additionally, direct comparison between linear and macrocy-clic GBCAs still must be explored. For example, while Stojanov et al12have demonstrated T1 shortening in the GP and DN
fol-lowing repeat administration of gadobutrol, the relative degree of these changes compared with those seen in linear-based agents has not been determined, and the results have been since chal-lenged by a number of follow-up studies.16-18The purpose of this
study was to compare possible gadobutrol-related T1 signal in-tensity changes with those of linear agents in a similar population. Prior studies evaluating such T1 changes following the use of gad-obutrol have resulted in limited power or cumulative dose per patient.15,16
MATERIALS AND METHODS
Whole-brain MR imaging was performed using 1.5T (Symphony; Siemens, Erlangen, Germany) or 3T (Verio; Siemens) MR imag-ing units. Unenhanced T1-weighted MR images (3D MPRAGE) were obtained with the following parameters on 1.5T systems: TR⫽1330 ms; TE⫽4.8 ms; TI⫽800 ms; flip angle⫽15°; section thickness ⫽ 12.5 mm; matrix size ⫽ 256 ⫻ 192; echo-train length⫽1. T1-weighting parameters on 3T systems were the following: TR⫽2100 ms; TE⫽3.0 ms; TI⫽900 ms; flip angle⫽ 9°; section thickness⫽11 mm; matrix size⫽256⫻256; echo-train length⫽1.
Following institutional review board approval, patients were retrospectively selected from among neuroimaging patients at Cedars-Sinai Medical Center. Informed consent was waived given the retrospective nature of the study. The population selected for study consisted of patients who had undergone at least 7 prior contrast-enhanced MR imaging examinations. Due to the relative frequency of contrast-enhanced examinations associated with standard care, all patients had intra-axial malignancy, most com-monly anaplastic astrocytoma or glioblastoma multiforme. All patients receiving gadolinium contrast agents had been screened for renal failure with serum creatinine levels.
As a result of an institution-wide contrast formulary policy change, it was simple to determine which contrast agents patients received. Before 2011, our institution had exclusively used linear, nonionic contrast agents, gadoversetamide (OptiMARK; Covi-dien, Irvine, California) and, to a lesser extent, gadodiamide (Omniscan; GE Healthcare, Piscataway, New Jersey). Between 2011 and February 2012, gadobenate dimeglumine (MultiHance; Bracco Diagnostics), a linear, ionic GBCA, became the primary
contrast agent. After February 2012, we began to exclusively use gadobutrol (Gadavist), a macrocyclic GBCA, for all neuroimag-ing. This allowed us to have a population of patients who had received only the macrocyclic agent gadobutrol to compare against an earlier population who had received only linear GBCAs.
We used the following inclusion criteria: 1) Patients must have undergone at least 7 consecutive studies with gadobutrol or at least 7 scans with only linear contrast agents (OptiMARK, Multi-Hance, and Omniscan); 2) initial and final MRIs had both pre-and postcontrast T1-weighted images; 3) one class of contrast agent was exclusively used for all 7 examinations, either macrocy-clic (exclusively gadobutrol) or linear (any combination of those mentioned above); 4) at least 1 basal ganglion and the posterior fossa were spared tumor or radiation effects; 5) subjects had nor-mal renal function, defined as a glomerular filtration rate of⬎30; and 6) the seventh examination occurred at least 2 weeks follow-ing the sixth. Patients were excluded on the basis of the followfollow-ing: 1) tumor- or treatment-related change in the posterior fossa or bilateral globi pallidi; and 2) abnormal baseline T1 signal intensity ratio of⬎1:1 when comparing the DN with the pons.
The study population was divided into 2 groups: Group 1 cluded patients who received only gadobutrol, and group 2 in-cluded patients who received only linear contrast agents (Opti-MARK, MultiHance, Omniscan). Following exclusion, group 1 contained 59 patients while group 2 contained 60. Anonymized data for each group were collected using Excel (Microsoft, Red-mond, Washington) and were stored on-site in an encrypted fashion.
Two radiologists conducted a quantitative analysis of unen-hanced T1-weighted images using ROI measurements. Measure-ments were made on the baseline scan and the seventh scan. In keeping with previously described techniques, ROIs were drawn over the left globus pallidus, dentate nucleus, lateral ventricle, and pons, and average signal intensity was recorded.12,19Examples of
[image:2.594.325.507.46.258.2]lated the ratios of these intensities: dentate nucleus/pons (DN/ pons) and globus pallidus/pons (GP/pons).12If the left side could
not be evaluated due to artifacts or pathology, the right side was used.
Statistical Analysis
In keeping with other authors’ methods, it was decided that it would be best to compare ratios between the GP and pons as well as the DN and pons. Pairedttests were used to compare changes within a given group (ie, the gadobutrol group or the linear agent group) between the first and seventh examinations. Wilcoxon rank sum tests were used for between-group comparisons of the percentage change in the signal intensity ratio (either DN/pons or GP/pons) seen during the patients’ 7 examinations. All statistical analysis was performed with Statistical Analysis Software, Version 9.2 (SAS Institute, Cary, North Carolina).
RESULTS
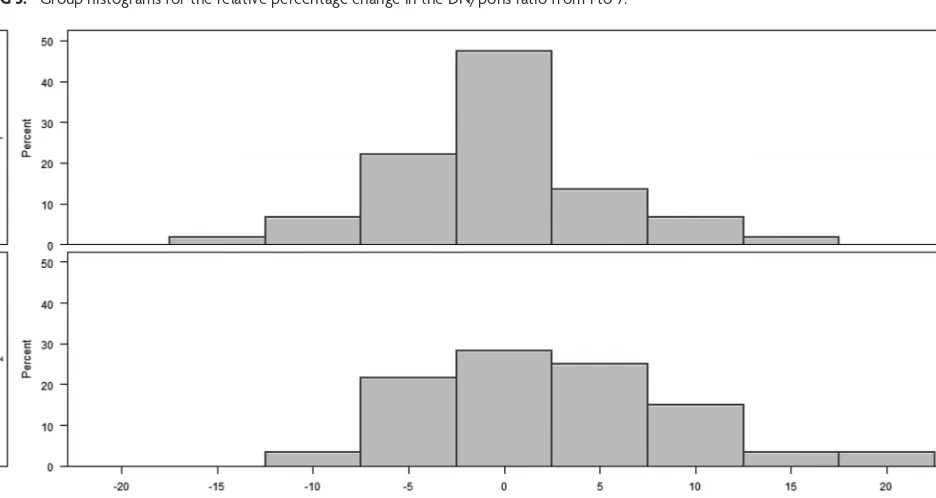
Consistent with expectations, a significant signal intensity in-crease was detected in the DN/pons ratio by the seventh examina-tion in the linear agent group (t⫽4.215,P⬍.001;Table 1). A sample pair of images showing the signal increase is shown in Fig 4. No significant change was demonstrated in the group re-ceiving gadobutrol (t⫽ ⫺1.422,P⫽.08;Table 1). The difference between the signal changes seen in these 2 groups was also signif-icant (⫹3.10% for those receiving linear GBCA;⫺0.8% for pa-tients receiving gadobutrol;P⬍.0001;Fig 5andTable 2).
Similarly, a significant increase was seen in the GP/pons ratio in the linear agent group between the first and seventh examina-tions (t⫽2.931,P⫽.002;Table 1), while no such increase was seen in the group receiving gadobutrol (t⫽0.684,P⫽.25;Table 1). Again, the difference in the percentage change between these groups was significant (⫹2.47% for the linear GBCA group;
⫺0.30% in the gadobutrol group,P⫽.033;Fig 6andTable 2).
DISCUSSION
The demonstration of a stable DN/pons T1 signal intensity ratio over subsequent administrations of gadobutrol supports the growing preponderance of evidence suggesting that macrocyclic GBCAs, as a class, are less likely to deposit gadolinium in the brain. As with previous examinations, the use of linear GBCAs was found to result in increased T1 signal in the globus pallidus and dentate nucleus.
There are several limitations to our study. Patient age was not controlled for, in favor of improving sample size. While all pa-tients were seen for malignancy, nearly all with anaplastic astro-cytoma or glioblastoma multiforme, the distributions of these FIG 2. Globus pallidus ROI selection.
[image:3.594.78.258.45.247.2]FIG 3. Pons ROI selection.
Table 1: Pairedttest comparing DN/pons and GP/pons at time 1 versus 7 within groups
DN/Pons GP/Pons
Group 1: Gadobutrol
Group 2: Linear Agents
Group 1: Gadobutrol
Group 2: Linear Agents
No. 59 60 59 60
Mean change ⫺0.01 0.03 ⫺0.01 0.03
SD ⬍0.005 ⬍0.005 ⬍0.005 0.01
t ⫺1.422 4.215 ⫺0.684 2.931
P .08 ⬍.001 .25 .002
[image:3.594.299.534.59.323.2] [image:3.594.78.258.276.500.2]malignancies and relative chemotherapy effects were not con-trolled for. The damage to the BBB caused by disease processes, treatment, or both is also a potential confounding variable be-cause most patients undergoing repeat brain MRIs have a known
intracranial malignancy. Both 1.5T and 3T systems were used. While most examinations were performed at 1.5T, differences in equipment may have resulted in slight variations on measure-ments. There was also no intra-/interobserver agreement separately FIG 5. Group histograms for the relative percentage change in the DN/pons ratio from 1 to 7.
[image:4.594.53.533.64.395.2]FIG 6. Group histograms for the relative percentage change in the GP/pons ratio from 1 to 7.
Table 2: Wilcoxon test comparing percentage change in DN/pons and GP/pons ratios from study 1 to study 7 between the gadobutrol and linear groups
Group No. Percentage Change (Mean) SD Median Lower Quartile Upper Quartile
DN/Pons
Gadobutrol (group 1) 59 ⫺0.80 4.78 ⫺0.66 ⫺4.24 2.21
Linear GBCAs (group 2) 60 3.10 5.56 3.70 ⫺0.52 6.76
GP/Pons
Gadobutrol (group 1) 59 ⫺0.30 5.44 0.72 ⫺3.56 2.26
[image:4.594.59.527.404.653.2]before this study because the average signal intensity measurement is normally less sensitive to intra-/interobserver variations.
Our study has only explored the contribution of gadobutrol to signal intensity change in up to 7 injections, so the possibility of observing a signal intensity increase cannot be excluded in pa-tients with even higher cumulative gadobutrol injection doses. Even though we tried to ensure the completeness of all partici-pants’ medical records, the possibility of any unknown prior GBCA usage cannot be excluded for all patients.
Although most studies in the literature on the gadolinium de-position topic are MR imaging– based, inductively coupled plasma mass spectrometry– based postmortem tissue sampling studies, which have much higher sensitivity to the existence of gadolinium atoms, have also been conducted in both preclinical and clinical studies. Because of the higher sensitivity of induc-tively coupled plasma mass spectrometry techniques, deposits from both linear and macrocyclic agents have been reported,20-23
though the amount of deposition from macrocyclic agents was found to be much lower than from linear counterparts. Presumably, they are not as easily detected by standard T1-weighted MR imaging be-cause of the lower deposition rate of macrocyclic agents.
Most interesting, while not statistically significant, patients re-ceiving gadobutrol showed an unexpected decrease in signal in-tensity in both the DN and GP between the first and seventh studies. The decrease in the DN/pons ratio was found to be nearly significant atP⫽.08. Because linear GBCA administration before 2012 was not controlled for in the gadobutrol group, it is possible that this decrease reflects the results of clearance of previously deposited gadolinium from prior administrations, which may corroborate developing research on clearance and the efficacy of a “gadolinium holiday.”24Alternatively, this nonsignificant signal
decrease could also be caused by the bias in patient sampling and in signal measurement inherent in ROI-based analysis.
CONCLUSIONS
Patients exposed to gadobutrol, a macrocyclic agent, failed to show a demonstrable change in T1 signal intensity in the regions of the brain classically susceptible to gadolinium deposition. This finding corroborates evidence suggesting that macrocyclic agents are less likely to cause signal increase on nonenhanced T1WI MR images than linear GBCAs.
Disclosures: Franklin G. Moser—RELATED:Grant: Bayer Healthcare,Comments: grant to conduct research.* Christopher T. Watterson—RELATED:Grant: Bayer Healthcare,
Comments: educational grant.* Sasha Weiss—RELATED:Grant: Bayer Healthcare.* James Mirocha—RELATED:Grant: Bayer Healthcare.* Jinnan Wang—UNRELATED: Em-ployment: Bayer Healthcare;Stock/Stock Options: Bayer Healthcare. *Money paid to the institution.
REFERENCES
1. Frenzel T, Lengsfeld P, Schirmer H, et al.Stability of gadolinium-based magnetic resonance imaging contrast agents in human se-rum at 37 degrees C.Invest Radiol2008;43:817–28CrossRef Medline
2. Morcos SK.Extracellular gadolinium contrast agents: differences in stability.Eur J Radiol2008;66:175–79CrossRef Medline
3. Kanal E, Maravilla K, Rowley HA.Gadolinium contrast agents for CNS imaging: current concepts and clinical evidence.AJNR Am J Neuroradiol2014;35:2215–26CrossRef Medline
4. Maravilla KR, Smith MP, Vymazal J, et al.Are there differences be-tween macrocyclic gadolinium contrast agents for brain tumor
im-aging? Results of a multicenter intraindividual crossover compari-son of gadobutrol with gadoteridol (the TRUTH study).AJNR Am J Neuroradiol2015;36:14 –23CrossRef Medline
5. Lin SP, Brown JJ.MR contrast agents: physical and pharmacologic basics.J Magn Reson Imaging2007;25:884 –99CrossRef Medline
6. Kanda T, Ishii K, Kawaguchi H, et al.High signal intensity in the dentate nucleus and globus pallidus on unenhanced T1-weighted MR images: relationship with increasing cumulative dose of a gadolinium-based contrast material.Radiology2014;270:834 – 41
CrossRef Medline
7. Errante Y, Cirimele V, Mallio CA, et al.Progressive increase of T1 signal intensity of the dentate nucleus on unenhanced magnetic resonance images is associated with cumulative doses of intravenously adminis-tered gadodiamide in patients with normal renal function, suggesting dechelation.Invest Radiol2014;49:685–90CrossRef Medline
8. Quattrocchi CC, Mallio CA, Errante Y, et al.Gadodiamide and den-tate nucleus T1 hyperintensity in patients with meningioma evalu-ated by multiple follow-up contrast-enhanced magnetic resonance examinations with no systemic interval therapy.Invest Radiol2015; 50:470 –72CrossRef Medline
9. Radbruch A, Weberling LD, Kieslich PJ, et al.Gadolinium retention in the dentate nucleus and globus pallidus is dependent on the class of contrast agent.Radiology2015;275:783–91CrossRef Medline
10. Kanda T, Osawa M, Oba H, et al.High signal intensity in dentate nucleus on unenhanced T1-weighted MR images: association with linear versus macrocyclic gadolinium chelate administration. Ra-diology2015;275:803– 09CrossRef Medline
11. Ramalho J, Castillo M, AlObaidy M, et al.High signal intensity in globus pallidus and dentate nucleus on unenhanced T1-weighted MR images: evaluation of two linear gadolinium-based contrast agents.Radiology2015;276:836 – 44CrossRef Medline
12. Stojanov DA, Aracki-Trenkic A, Vojinovic S, et al.Increasing signal intensity within the dentate nucleus and globus pallidus on unen-hanced T1W magnetic resonance images in patients with relapsing-remitting multiple sclerosis: correlation with cumulative dose of a macrocyclic gadolinium-based contrast agent, gadobutrol.Eur Ra-diol2016;26:807–15CrossRef Medline
13. McDonald RJ, McDonald JS, Kallmes DF, et al.Intracranial gadolin-ium deposition after contrast-enhanced MR imaging.Radiology
2015;275:772– 82CrossRef Medline
14. Kanda T, Fukusato T, Matsuda M, et al.Gadolinium-based contrast agent accumulates in the brain even in subjects without severe renal dysfunction: evaluation of autopsy brain specimens with induc-tively coupled plasma mass spectroscopy. Radiology 2015;276: 228 –32CrossRef Medline
15. Kromrey ML, Liedtke KR, Ittermann T, et al.Intravenous injection of gadobutrol in an epidemiological study group did not lead to a difference in relative signal intensities of certain brain structures after 5 years.Eur Radiol2017;27:772–77CrossRef Medline
16. Radbruch A, Weberling LD, Kieslich PJ, et al.High-signal intensity in the dentate nucleus and globus pallidus on unenhanced T1-weighted images: evaluation of the macrocyclic gadolinium-based contrast agent gadobutrol.Invest Radiol2015;50:805–10CrossRef Medline
17. Cao Y, Huang DQ, Shih G, et al.Signal change in the dentate nucleus on T1-weighted MR images after multiple administrations of gado-pentetate dimeglumine versus gadobutrol. AJR Am J Roentgenol
2016;206:414 –19CrossRef Medline
18. Schlemm L, Chien C, Bellmann-Strobl J, et al.Gadopentetate but not gadobutrol accumulates in the dentate nucleus of multiple sclerosis patients.Mult Scler2017;23:963–72CrossRef Medline
19. Moser FG, Hilal SK, Abrams G, et al.MR imaging of pseudotumor cerebri.AJR Am J Roentgenol1988;150:903– 09CrossRef Medline
20. Robert P, Violas X, Grand S, et al.Linear gadolinium-based contrast agents are associated with brain gadolinium retention in healthy rats.Invest Radiol2016;51:73– 82CrossRef Medline
high doses of linear and macrocyclic gadolinium-based contrast agents.Invest Radiol2017;52:324 –33CrossRef Medline
22. McDonald RJ, McDonald JS, Dai D, et al.Comparison of gadolinium concentrations within multiple rat organs after intravenous ad-ministration of linear versus macrocyclic gadolinium chelates. Ra-diology2017;285:536 – 45CrossRef Medline
23. Bussi S, Coppo A, Botteron C, et al.Differences in gadolinium
reten-tion after repeated injecreten-tions of macrocyclic MR contrast agents to rats.J Magn Reson Imaging2017 Jul 21. [Epub ahead of print]
CrossRef Medline