ORIGINAL RESEARCH
ADULT BRAIN
White Matter Abnormalities in Multiple Sclerosis Evaluated
by Quantitative Synthetic MRI, Diffusion Tensor Imaging,
and Neurite Orientation Dispersion and Density Imaging
A. Hagiwara, K. Kamagata, K. Shimoji, K. Yokoyama, C. Andica, M. Hori, S. Fujita, T. Maekawa, R. Irie, T. Akashi, A. Wada, M. Suzuki, O. Abe, N. Hattori, and S. Aoki
ABSTRACT
BACKGROUND AND PURPOSE:A number of MR-derived quantitative metrics have been suggested to assess the pathophysiol-ogy of MS, but the reports about combined analyses of these metrics are scarce. Our aim was to assess the spatial distribu-tion of parameters for white matter myelin and axon integrity in patients with relapsing-remitting MS by multiparametric MR imaging.
MATERIALS AND METHODS:Twenty-four patients with relapsing-remitting MS and 24 age- and sex-matched controls were pro-spectively scanned by quantitative synthetic and 2-shell diffusion MR imaging. Synthetic MR imaging data were used to retrieve relaxometry parameters (R1 and R2 relaxation rates and proton density) and myelin volume fraction. Diffusion tensor metrics (frac-tional anisotropy and mean, axial, and radial diffusivity) and neurite orientation and dispersion index metrics (intracellular volume fraction, isotropic volume fraction, and orientation dispersion index) were retrieved from diffusion MR imaging data. These data were analyzed using Tract-Based Spatial Statistics.
RESULTS:Patients with MS showed significantly lower fractional anisotropy and myelin volume fraction and higher isotropic volume fraction in widespread white matter areas. Areas with different isotropic volume fractions were included within areas with lower fractional anisotropy. Myelin volume fraction showed no significant difference in some areas with significantly decreased fractional anisotropy in MS, including in the genu of the corpus callosum and bilateral anterior corona radiata, whereas myelin volume frac-tion was significantly decreased in some areas where fractional anisotropy showed no significant difference, including the bilateral posterior limb of the internal capsule, external capsule, sagittal striatum, fornix, and uncinate fasciculus.
CONCLUSIONS:We found differences in spatial distribution of abnormality in fractional anisotropy, isotropic volume fraction, and myelin volume fraction distribution in MS, which might be useful for characterizing white matter in patients with MS.
ABBREVIATIONS:AVF¼axon volume fraction; EDSS¼Expanded Disability Status Scale; FA¼fractional anisotropy; ICVF¼intracellular volume fraction; ISO¼isotropic volume fraction; MNI¼Montreal Neurological Institute; MVF¼myelin volume fraction; NAWM¼normal-appearing white matter; NODDI¼ neurite orientation dispersion and density imaging; ODI¼orientation dispersion index; QRAPMASTER¼quantification of relaxation times and proton density by multiecho acquisition of a saturation-recovery using turbo spin-echo readout
M
S is a demyelinating disorder that mainly affects young individuals and involves inflammatory demyelination accompanied by axonal degeneration. Various quantitativemetrics, including myelin water imaging,1 quantitative syn-thetic MR imaging,2,3 diffusion tensor imaging,4and neurite orientation dispersion and density imaging (NODDI),5have revealed abnormalities in both WM lesions and the WM that appears normal on conventional T2WI.
Quantitative synthetic MR imaging simultaneously measures longitudinal T1 and transverse T2 relaxation times (and their inverse, R1 and R2 relaxation rates) and proton density in Received June 6, 2019; accepted after revision July 28.
From the Departments of Radiology (A.H., K.K., K.S., C.A., M.H., S.F., T.M., R.I., T.A., A.W., M.S., S.A.) and Neurology (K.Y., N.H.), Juntendo University School of Medicine, Tokyo, Japan; Department of Radiology (A.H., S.F., T.M., R.I., O.A.), Graduate School of Medicine, University of Tokyo, Tokyo, Japan; Department of Diagnostic Radiology (K.S.), Tokyo Metropolitan Geriatric Hospital, Tokyo, Japan; and Department of Radiology (M.H.), Toho University Omori Medical Center, Tokyo, Japan.
This work was supported by Japan Society for the Promotion of Science KAKENHI grant Nos. 19K17150, 19K17177, 18H02772, and 18K15643; grant No. JP16H06280, Grant-in-Aid for Scientific Research on Innovative Areas, resource and technical support platforms for promoting research“Advanced Bioimaging Support”; the Japanese Society for Magnetic Resonance in Medicine; and the program for Brain Mapping by Integrated Neurotechnologies for Disease Studies from the Japan Agency for Medical Research and Development.
Please address correspondence to Akifumi Hagiwara, MD, PhD, Department of Radiology, Juntendo University School of Medicine, 1-2-1, Hungo, Bunkyo-ku, Tokyo, Japan 113-8421; e-mail: [email protected]
Indicates open access to non-subscribers at www.ajnr.org Indicates article with supplemental on-line tables.
multiple slices,6with high repeatability and reproducibility across scanners.7 It allows creation of any contrast-weighted image, including T1-weighted, T2-weighted, and FLAIR images,8 with-out requiring additional scanning time. Furthermore, a 4-com-partment model was developed to estimate myelin volume fraction (MVF) in each voxel in the brain, based on the measured R1, R2, and proton density.9 The estimated myelin correlates with histology in healthy populations10and in patients with MS11 and with other MR imaging–based myelin measurements.12Even though synthetic myelin maps have shown tissue abnormalities in plaques and periplaque WM in patients with MS,2the voxel-level difference in the estimated myelin between patients with MS and healthy controls has not been investigated to date.
Diffusion-weighted imaging also provides information on microstructure, such as fiber density and orientation, by altering the diffusion-sensitization strength and direction of the encoding gradients.13Although used as a standard diffu-sion MR imaging technique, diffudiffu-sion tensor imaging lacks specificity for individual tissue microstructural features.14 Advanced diffusion models have been developed to quantify specific neurite morphology,13 such as NODDI, which assumes 3 compartments in the brain: an intracellular com-partment with restricted anisotropic non-Gaussian diffusion (intracellular volume fraction [ICVF]), an extracellular com-partment with hindered anisotropic Gaussian diffusion, and a water compartment with free isotropic Gaussian diffusion (isotropic volume fraction [ISO]).15ICVF is attributed to the axon and dendrite density and can be used for calculating axon volume fraction (AVF) when combined with myelin imaging.16 Notably, the myelin signal is negligible in diffu-sion MR imaging, and an additional technique is required to retrieve information about axons and myelin.16NODDI pro-vides directional neurite information as an orientation dis-persion index (ODI).
Despite the recent development of multiple advanced MR imaging techniques, reports of combined analyses are scarce. Granberg et al5found that NODDI was more sensitive than myelin-sensitive imaging to changes in normal-appearing WM (NAWM) in patients with MS. However, they used the T1-weighted/T2-weighted ratio as a measure of myelin, which has been reported to be less than optimal for evaluating myelin in WM.12,17Moreover, no previous study has performed voxelwise whole-brain analysis of tissue-damage distribution in patients with MS using NODDI or myelin-imaging techniques. Even though our previous work3combined quantitative synthetic MR imaging and NODDI for evaluating WM damage in patients with MS, we did not compare quantitative values in patients with MS with those in healthy controls.
Therefore, this study aimed to evaluate the distribution of WM damage in patients with MS compared with healthy con-trols by combining quantitative synthetic MR imaging and NODDI. We used Tract-Based Spatial Statistics (TBSS; http:// fsl.fmrib.ox.ac.uk/fsl/fslwiki/TBSS),18 which allows voxelwise analysis of the whole brain within core WM tracts, to compare patients with MS and healthy controls, and we used ROI analy-sis to compare NAWM and lesions in patients with MS with WM in healthy controls.
MATERIALS AND METHODS
Study ParticipantsWe prospectively recruited 24 patients with relapsing-remitting MS from August to November 2016 who were diagnosed according to the 2010 revised McDonald diagnostic criteria.19 Disability was assessed using the Expanded Disability Status Scale (EDSS) score.20 These patients were on stable disease-modifying treatment or no treatment for at least 3 months and had been free of clinical relapse within the 3 months and corti-costeroid use within 1 year before MR imaging. As a control group, we also recruited 24 age- and sex-matched healthy sub-jects without neurologic and psychological symptoms or a his-tory of neuropsychological disorders. Acquired images were confirmed not to include abnormalities such as moderate-to-severe WM ischemic lesions (Fazekas grade II or higher21), brain infarction, or tumor. This study was approved by the institutional review board of Juntendo University Hospital, Tokyo, Japan, and written informed consent was obtained from all participants. The patients in this study partially overlapped with a previously published study population.22
Image Acquisition and Processing
MR imaging was performed on a 3T scanner (Discovery MR750w; GE Healthcare, Milwaukee, Wisconsin) with a 19-channel head coil. All participants were scanned with a 2D axial quantification of relaxation times and proton density by multiecho acquisition of a saturation-recovery using turbo spin-echo readout (QRAPMASTER) pulse sequence and 2-shell diffusion MR imaging.
QRAPMASTER is a multislice, multiecho, multisaturation-delay saturation-recovery turbo spin-echo acquisition method in which images are collected with combinations of 2 TEs and 4 sat-uration-delay times. We used TEs of 16.9 and 84.5 ms and delay times of 146, 546, 1879, and 3879 ms. The other parameters were as follows: TR = 4.0 seconds, FOV = 240240 mm, matrix = 320320, echo-train length = 10, bandwidth = 31.25 kHz, sec-tion thickness/gap = 4.0 mm/1.0 mm, slices = 30, and acquisisec-tion time = 7 minutes 12 seconds. The 8 complex images acquired per section were postprocessed with SyMRI software (Version 8.0; SyntheticMR, Linköping, Sweden) to derive longitudinal R1 relaxation and transverse R2 relaxation rates and proton density and to estimate MVF per voxel. The myelin estimation model assumes 4 brain compartments: myelin, excess parenchymal water, cellular water, and free-water volume fractions.9The R1, R2, and proton density of each volume fraction in a voxel pre-sumably contribute to the effective R1, R2, and proton density of the voxel as a whole. Synthetic FLAIR images and T1WI were also created with the same software using the R1, R2, and proton density maps, with the following postprocessing parameters: TR = 15,000 ms, TE = 100 ms, TI = 3000 ms for FLAIR, and TR = 500 ms, TE = 10 ms for T1WI.
Diffusion MR imaging was performed with single-shot echo-planar imaging along 30 and 60 motion-probing gradient direc-tions for b-values of 1000 and 2000 s/mm2, respectively. Additionally, a volume of non-diffusion-weighted images was also acquired. The other sequence parameters were the following: TR = 5000 ms, TE = 88.2 ms, FOV = 256256 mm, matrix size =
256256, echo-train length = 128, bandwidth = 1953.12 kHz, section thickness/gap = 4.0 mm/1.0 mm, slices = 30, and acquisi-tion time = 7 minutes 40 seconds. All datasets were visually inspected for artifacts. We corrected in-plane and through-plane distortions of diffusion-weighted images caused by eddy currents and motion using affine brain registration to non-diffusion-weighted images.23Processed images were further denoised using multishell position-orientation adaptive smoothing based on the propagation-separation approach.24,25 On denoising, diffusion data with b-values of 1000 and 2000 s/mm2were handled simul-taneously to improve denoising stability.25Maps of fractional ani-sotropy (FA), mean diffusivity, axial diffusivity, and radial diffusivity were computed using diffusion data with b-values of 0 and 1000 s/mm2by fitting a tensor model. A NODDI model15 was applied to the whole 2-shell diffusion data to produce ICVF, ISO, and ODI maps, while processing was accelerated using an Accelerated Microstructure Imaging via Convex Optimization algorithm.26
The AVF and g-ratio maps were acquired using the following equations:
AVF¼ ð1 MVFÞð1 ISOÞICVF;
gratio ¼
ffiffiffiffiffiffiffiffiffiffiffiffiffiffiffiffiffiffiffiffiffiffiffiffiffi
AVF
MVFþAVF
r
;
assuming that the signal of myelin is almost negligible in diffu-sion-weighted imaging but that the volume of myelin is not,16— that is, the volume fractions calculated by NODDI correspond to nonmyelinated tissues. Postprocessing was performed with an in-house program in Matlab (MathWorks, Natick, Massachusetts). Affine transformation was performed to register the acquired images using Statistical Parametric Mapping software (SPM12; http://www.fil.ion.ucl.ac.uk/spm/software/spm12).
TBSS Analysis
We performed whole-brain voxelwise analysis of the quantitative maps using TBSS implemented in the FMRIB Software Library (FSL; http://www.fmrib.ox.ac.uk/fsl).18,27 First, FMRIB58_FA (https://fsl.fmrib.ox.ac.uk/fsl/fslwiki/FMRIB58_FA) in the Mon-treal Neurological Institute (MNI) common space was used as the target image for nonlinear registration of all subjects’ FA maps, using the FMRIB Nonlinear Registration Tool (FNIRT;
http://fsl.fmrib.ox.ac.uk/fsl/fslwiki/FNIRT/). The transformed FA
images were averaged and skeletonized, representing the centers of all WM tracts common to all subjects. The mean FA skeleton was thresholded at 0.2 to include major WM tracts and to exclude peripheral tracts and gray matter.18Each participant’s aligned FA map was then projected onto this skeleton by assigning to each voxel the maximum FA in a line perpendicular to the local skele-ton. The R1, R2, proton density, MVF, mean diffusivity, axial dif-fusivity, radial difdif-fusivity, ICVF, ISO, ODI, AVF, and g-ratio maps were projected onto the mean FA skeleton after applying the warping registration field of each subject to the standard space.
Comparisons between patients with MS and healthy controls were performed by voxelwise statistics of the skeletonized
quantitative maps using nonparametric statistical thresholding (FSL Randomise permutation algorithm; https://fsl.fmrib.ox.ac.
uk/fsl/fslwiki/Randomise). The thresholded mean FA skeleton
was used as a mask. Five thousand permutations and statistical inference using threshold-free cluster enhancement were per-formed,28withPvalues<.05 after family-wise error correction for multiple comparisons considered significant. Age and sex were used as covariates. The anatomic locations of regions with significant group differences on the WM skeleton were identified from the Johns Hopkins University WM labels atlas.29For pa-rameters showing significant differences, correlations with dis-ease duration and EDSS were also examined using Randomise (P<.05, corrected for age and sex).
Lesion Maps
For all patients, hyperintense lesions were automatically seg-mented on synthetic FLAIR images using the lesion-prediction algorithm30implemented in the Lesion Segmentation Toolbox, Version 2.0.15 (http://www.applied-statistics.de/lst.html)31 run-ning in SPM 12. All lesion maps were visually inspected and manually corrected by an experienced neuroradiologist (A.H.). The whole-brain WM lesion volume in each patient was calcu-lated by multiplying the lesion area by the section thickness. Synthetic T1WI in each patient was spatially normalized to MNI space, and warping fields were saved and subsequently applied to lesion maps. Because synthetic images derived from QRAPMASTER are inherently aligned,32no prior registration between synthetic T1WI and lesion maps created on synthetic FLAIR was required. Normalized lesion maps in all patients were aggregated to create group lesion maps.
ROI Analysis
To investigate tissue damage in NAWM and lesions separately, we performed ROI analysis using the WM skeleton and lesion maps. We registered the skeleton in the MNI space to each sub-ject’s space by applying the warping field created for TBSS analy-sis after inversion of the field. Next, we enlarged each patient’s lesion map by 4 voxels. We segmented the synthetic T1WI for each subject to extract WM segmentation maps using FMRIB’s Automated Segmentation Tool (FAST;http://fsl.fmrib.ox.ac.uk/
fsl/fslwiki/fast). WM segmentation maps were then thresholded
at 0.9 to minimize the partial volume effects and were used as WM masks. We created NAWM masks by subtracting the enlarged lesion maps from the thresholded WM masks for each patient. Overlapping areas between the warped skeleton and WM masks in healthy controls, NAWM masks in patients, or lesion maps in patients were used as ROIs to extract metrics from each quantitative map for the WM of healthy controls, the NAWM of patients with MS, or the lesion areas of patients with MS, respectively.
Statistical Analysis
FA, mean diffusivity, axial diffusivity, radial diffusivity, ICVF, ISO, ODI, AVF, and g-ratio values between the WM of healthy controls and the NAWM or lesion areas of patients with MS. A 2-sided P <.05 was considered statistically significant. These statistical analyses were performed with the software package R, Version 3.2.1 (http://www.r-project.org/).
RESULTS
The demographic and clinical data of patients with MS and of healthy controls are provided in theTable. Age and sex did not differ significantly between groups.
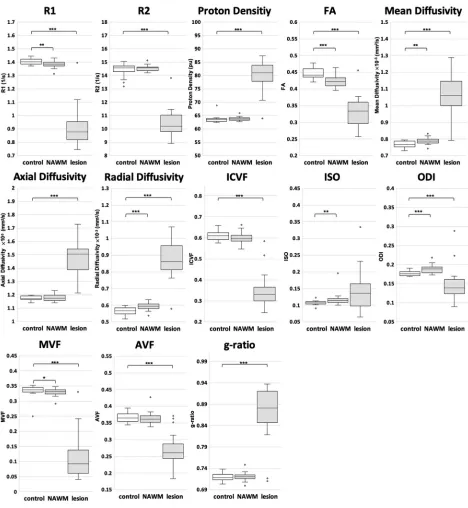
[image:4.585.53.286.197.302.2]On TBSS analysis, patients with MS showed significantly lower FA and MVF and higher ISO values in the corpus cal-losum, cingulate gyri, and corona radiata (Fig 1and On-line Table 1). The MVF differed between patients with MS and healthy controls in the most widespread areas, and only MVF showed significant differences (lower values in patients with MS) in the inferior longitudinal fasciculus, inferior fronto-occipital fasciculus, uncinate fasciculus, fornix, and external capsule. Conversely, only FA showed significantly different values (lower in patients with MS) in the genu of the corpus callosum and anterior corona radiata. All areas with significant ISO differences were included within areas that showed a sig-nificant FA difference. No sigsig-nificant correlation was found between EDSS or disease duration and FA, ISO, or MVF. R1, R2, proton density, mean diffusivity, axial diffusivity, radial diffusivity, ICVF, ODI, AVF, and g-ratio maps did not differ statistically significantly in the WM between patients and controls.
Figure 2and On-line Table 2 show ROI analysis results. All quantitative metrics except ISO differed significantly between the healthy control WM and the WM lesions in patients with MS. R1, FA, mean diffusivity, radial diffusivity, ISO, ODI, and MVF differed significantly between healthy control WM and NAWM of patients with MS.
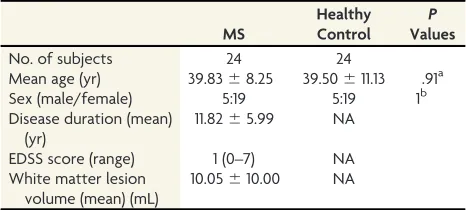
Demographic and clinical details of all participants
MS HealthyControl ValuesP
No. of subjects 24 24
Mean age (yr) 39.8368.25 39.50611.13 .91a
Sex (male/female) 5:19 5:19 1b
Disease duration (mean) (yr)
11.8265.99 NA
EDSS score (range) 1 (0–7) NA
White matter lesion volume (mean) (mL)
10.05610.00 NA
Note:—NA indicates not applicable. aTwo-samplettest.
bx2test.
FIG 1. TBSS results are shown for FA, ISO, and MVF maps, which show significant differences between patients with MS and healthy controls. Green represents the mean FA skeleton of all participants thresholded at 0.2. Blue–light blue represents lower values in patients with MS com-pared with healthy controls in FA (first row) and MVF (third row) maps; red-yellow represents higher values in ISO maps (second row) (family-wise error-correctedP <.05). The significant regions are thickened for better visibility. The mean lesion probability distribution in patients with MS, thresholded at 20%, is shown in thefourth rowin purple.
[image:4.585.52.534.346.674.2]DISCUSSION
We here compared the WM of patients with MS and healthy controls using a combination of synthetic MR imaging and dif-fusion MR imaging by implementing TBSS and ROI analysis. To our knowledge, no previous study has performed voxelwise analysis of whole-brain WM using synthetic MVF or NODDI. We showed a lower FA in widespread WM areas in patients with MS, consistent with previous findings.33-35The distribu-tion of abnormality in MVF value in patients differed from
those of FA and ISO values. Even though the mechanisms underlying these differences are unclear, we can assume that various disease processes such as demyelination, axonal degen-eration, gliosis, and edema36play a role. Because FA is nonspe-cific for demyelination and other pathologic processes37 and ISO reportedly shows inflammatory free-water or edema,5this combination of synthetic MR imaging and diffusion MR imag-ing may allow more detailed evaluation than is achieved usimag-ing FA only.
[image:5.585.58.526.51.559.2]TBSS analysis did not show statistically significant differen-ces in the AVF, ICVF, and g-ratio between patients with MS and healthy controls, while MVF differed significantly. Furthermore, in a comparison between the NAWM of patients and the WM of healthy controls, ROI analysis showed signifi-cant differences in MVF, but not in the AVF, ICVF, and g-ratio. These results agreed with those of our previous study3reporting that MVF was more sensitive than AVF to WM damage in pla-que and periplapla-que WM than in NAWM. Even though TBSS analysis showed no significant difference in axial and radial dif-fusivity between patients with MS and healthy controls in our study, ROI analysis revealed higher radial diffusivity in the NAWM of patients with MS than in healthy control WM, whereas axial diffusivity did not differ significantly, even in ROI analysis. Our observation was consistent with previously reported findings that radial diffusivity showed more wide-spread abnormalities in the WM of patients with MS than axial diffusivity,34 where radial diffusivity and axial diffusivity are considered surrogate markers for myelin and axon integrity, respectively. The widespread decrease in MVF, without a signif-icant AVF decrease in this study, supported the notion that de-myelination is a key pathologic element in MS and that MVF can be a biomarker for monitoring progression and treatment response in MS.
In ROI analysis, the ODI was higher in the NAWM of patients with MS than in the healthy control WM, but it was lower in WM lesions in patients with MS than in healthy con-trol WM. This was congruent with the findings of Schneider et al38 involving 5 patients with relapsing-remitting MS, which indicated a loss of fiber coherence (ie, increased dispersion) in the NAWM. They found a lower ODI in WM lesions, as in our study, even though another study involving early-stage MS (dis-ease duration,<5 years) showed higher ODI in WM lesions.5 These results might suggest that NAWM and early plaques show a loss of fiber coherence with relatively maintained neuro-nal fiber density, leading to an increase in ODI, whereas loss of neuronal fibers, with fewer signals from fibers, may cause a decrease in ODI in chronic plaques.
ISO values were higher in the WM of patients with MS on TBSS analysis and in the NAWM of patients with MS on ROI analysis, than in healthy control WM, possibly indicating edema with free diffusion in patients’NAWM. However, patients’WM lesion values were not significantly higher than those of healthy control WM, in contrast to the findings of Schneider et al.38This difference could be attributed to the high variability of ISO in lesions in our study (Fig 2), which is partly explained by the par-tial volume effects of lesion ROIs. Chung et al39 previously revealed that NODDI metrics showed higher variability at tissue boundaries. Hence, future investigations with higher resolution are warranted.
In TBSS, R1, R2, and proton density, as opposed to the MVF derived from these metrics, did not differ significantly between the patients with MS and healthy controls, agreeing with a previ-ous observation showing the higher sensitivity of MVF than R1, R2, and proton density for revealing WM damage in plaque and periplaque WM.2On ROI analysis, only R1 differed significantly between the NAWM of patients with MS and the WM of healthy
controls. Previous reports have inconsistently reported differences between healthy WM and NAWM revealed by these metrics,40-43 and 1 previous study showed significant differences in T2 and proton density, but not in T1, between healthy WM and NAWM.43These metrics are thus nonspecifically affected by path-ologic processes; hence, MVF and AVF may be more suitable for capturing changes in tissue microstructure in patients with MS.
In our study, no correlation was found between quantitative metrics and EDSS or disease duration. This could be due to the small sample size and the low EDSS scores (median, 1). Larger studies including a wider range of clinical disabilities are needed.
This study had some limitations. First, the study design was cross-sectional. Future longitudinal studies are required to under-stand intraindividual variation and the trajectory of metric changes during disease progression. Second, we used a 4-mm sec-tion thickness with a 1-mm gap. A future combinasec-tion of 3D syn-thetic MR imaging44 and high-resolution diffusion-weighted imaging in a larger study population would facilitate a more ro-bust analysis.
CONCLUSIONS
We compared the metrics acquired by synthetic MR imaging and NODDI in the WM between patients with MS and healthy con-trols. Compared with healthy controls, patients with MS showed significantly lower FA, lower MVF, and higher ISO in large WM areas. Furthermore, a decrease in FA and MVF showed different spatial distributions; combined, these quantitative values can facilitate better WM characterization in patients with MS.
Disclosures: Akifumi Hagiwara—RELATED: Grant: Japan Society for the Promotion of Science KAKENHI, Comments: grant No, 19K17150;UNRELATED:
Travel/Accommodations/Meeting Expenses Unrelated to Activities Listed: GE Healthcare, Comments: SIGNA Masters Series Neuro Summit (Singapore) October 2018. Keigo Shimoji—UNRELATED: Grants/Grants Pending: MEXT KAKENHI, grant No. 18H02772. Shigeki Aoki—RELATED:Grant: Japan Society for the Promotion of Science KAKENHI, ABiS, Branding Project*; UNRELATED:
Grants/grants Pending: Japan Society for the Promotion of Science KAKENHI, ABiS, Branding Project, Daiichi Sankyo, Mediphysics, Fuji Film RI, Eisai, Guerbet*;
Payment for Lectures Including Service on Speakers Bureaus: GE Healthcare, Siemens, Canon, Bayer, Daiichi Sankyo, Mediphysics, FujiRI, Fujifilm Medical Systems, Eisai, Guerbet. *Money paid to institution.
REFERENCES
1. Vavasour IM, Huijskens SC, Li DK, et al.Global loss of myelin water over 5 years in multiple sclerosis normal-appearing white matter. Mult Scler2018;24:1557–68CrossRef Medline
2. Hagiwara A, Hori M, Yokoyama K, et al.Utility of a multiparamet-ric quantitative MRI model that assesses myelin and edema for evaluating plaques, periplaque white matter, and normal-appear-ing white matter in patients with multiple sclerosis: a feasibility study.AJNR Am J Neuroradiol2017;38:237–42CrossRef Medline 3. Hagiwara A, Hori M, Yokoyama K, et al.Analysis of white matter
damage in patients with multiple sclerosis via a novel in vivo MR method for measuring myelin, axons, and g-ratio. AJNR Am J Neuroradiol2017;38:1934–40CrossRef Medline
4. Guo AC, MacFall JR, Provenzale JM.Multiple sclerosis: diffusion tensor MR imaging for evaluation of normal-appearing white mat-ter.Radiology2002;222:729–36CrossRef Medline
5. Granberg T, Fan Q, Treaba CA, et al.In vivo characterization of cortical and white matter neuroaxonal pathology in early multiple sclerosis.Brain2017;140:2912–26CrossRef Medline
6. Warntjes JB, Leinhard OD, West J, et al.Rapid magnetic resonance quantification on the brain: optimization for clinical usage.Magn Reson Med2008;60:320–29CrossRef Medline
7. Hagiwara A, Hori M, Cohen-Adad J, et al.Linearity, bias, intrascan-ner repeatability, and interscanintrascan-ner reproducibility of quantitative multidynamic multiecho sequence for rapid simultaneous relax-ometry at 3 T: a validation study with a standardized phantom and healthy controls.Invest Radiology2019;54:47–39CrossRef Medline 8. Wallaert L, Hagiwara A, Andica C, et al.The advantage of synthetic
MRI for the visualization of anterior temporal pole lesions on dou-ble inversion recovery (DIR), phase-sensitive inversion recovery (PSIR), and myelin images in a patient with CADASIL.Magn Reson Med Sci2018;17:275–76CrossRef Medline
9. Warntjes M, Engstrom M, Tisell A, et al.Modeling the presence of myelin and edema in the brain based on multi-parametric quanti-tative MRI.Front Neurol2016;7:16CrossRef Medline
10. Warntjes JBM, Persson A, Berge J, et al.Myelin detection using rapid quantitative MR imaging correlated to macroscopically reg-istered luxol fast blue-stained brain specimens. AJNR Am J Neuroradiol2017;38:1096–102CrossRef Medline
11. Ouellette R, Warntjes M, Forslin Y, et al.Rapid estimation of myelin for diagnostic imaging (REMyDI): a clinical and histopathological validation in multiple sclerosis. In: Proceedings of the Annual Meeting of the International Society for Magnetic Resonance in Medicine and the European Society for Magnetic Resonance in Medicine, Paris, France, June 16-21, 2018;Abstract 1864
12. Hagiwara A, Hori M, Kamagata K, et al.Myelin measurement: com-parison between simultaneous tissue relaxometry, magnetization transfer saturation index, and T1w/T2w ratio methods.Sci Rep 2018;8:10554CrossRef Medline
13. Alexander DC, Dyrby TB, Nilsson M, et al.Imaging brain micro-structure with diffusion MRI: practicality and applications.NMR Biomed2019;32:e3841CrossRef Medline
14. Pierpaoli C, Jezzard P, Basser PJ, et al.Diffusion tensor MR imaging of the human brain.Radiology1996;201:637–48CrossRef Medline 15. Zhang H, Schneider T, Wheeler-Kingshott CA, et al.NODDI:
practi-cal in vivo neurite orientation dispersion and density imaging of the human brain.Neuroimage2012;61:1000–16CrossRef Medline 16. Stikov N, Campbell JS, Stroh T, et al.In vivo histology of the myelin
g-ratio with magnetic resonance imaging. Neuroimage 2015; 118:397–405CrossRef Medline
17. Arshad M, Stanley JA, Raz N.Test-retest reliability and concurrent validity of in vivo myelin content indices: myelin water fraction and calibrated T1 w/T2 w image ratio. Hum Brain Mapp 2017;38:1780–90CrossRef Medline
18. Smith SM, Jenkinson M, Johansen-Berg H, et al.Tract-based spatial statistics: voxelwise analysis of multi-subject diffusion data. Neuroimage2006;31:1487–505CrossRef Medline
19. Polman CH, Reingold SC, Banwell B, et al.Diagnostic criteria for multiple sclerosis: 2010 revisions to the McDonald criteria.Ann Neurol2011;69:292–302CrossRef Medline
20. Kurtzke JF.A new scale for evaluating disability in multiple sclero-sis.Neurology1955;5:580–83CrossRef Medline
21. Fazekas F, Chawluk JB, Alavi A, et al.MR signal abnormalities at 1.5 T in Alzheimer’s dementia and normal aging. AJR Am J Roentgenol1987;149:351–56CrossRef Medline
22. Andica C, Hagiwara A, Kamagata K, et al.Gray matter alterations in early and late relapsing-remitting multiple sclerosis evaluated with synthetic quantitative magnetic resonance imaging. Sci Rep 2019;9:8147CrossRef Medline
23. Mohammadi S, Moller HE, Kugel H, et al.Correcting eddy current and motion effects by affine whole-brain registrations: evaluation of three-dimensional distortions and comparison with slicewise correction.Magn Reson Med2010;64:1047–56CrossRef Medline 24. Becker SM, Tabelow K, Voss HU, et al.Position-orientation
adapt-ive smoothing of diffusion weighted magnetic resonance data (POAS).Med Image Anal2012;16:1142–55CrossRef Medline
25. Becker SM, Tabelow K, Mohammadi S, et al.Adaptive smoothing of multi-shell diffusion weighted magnetic resonance data by msPOAS.Neuroimage2014;95:90–105CrossRef Medline
26. Daducci A, Canales-Rodriguez EJ, Zhang H, et al. Accelerated Microstructure Imaging via Convex Optimization (AMICO) from diffusion MRI data.Neuroimage2015;105:32–44CrossRef Medline
27. Smith SM, Jenkinson M, Woolrich MW, et al.Advances in func-tional and structural MR image analysis and implementation as FSL.Neuroimage2004;23(Suppl 1):S208–19CrossRef Medline 28. Keihaninejad S, Ryan NS, Malone IB, et al. The importance of
group-wise registration in tract based spatial statistics study of neurodegeneration: a simulation study in Alzheimer’s disease. PLoS One2012;7:e45996CrossRef Medline
29. Mori S, Wakana S, Nagae-Poetscher LM, et al.MRI Atlas of Human White Matter. Amsterdam: Elsevier; 2005
30. Egger C, Opfer R, Wang C, et al.MRI FLAIR lesion segmentation in multiple sclerosis: does automated segmentation hold up with man-ual annotation?Neuroimage Clin2017;13:264–70CrossRef Medline 31. Schmidt P, Gaser C, Arsic M, et al.An automated tool for detection
of FLAIR-hyperintense white-matter lesions in multiple sclerosis. Neuroimage2012;59:3774–83CrossRef Medline
32. Hagiwara A, Warntjes M, Hori M, et al.SyMRI of the brain: rapid quantification of relaxation rates and proton density, with syn-thetic MRI, automatic brain segmentation, and myelin measure-ment.Invest Radiology2017;52:647–57CrossRef Medline
33. Sbardella E, Tona F, Petsas N, et al.DTI measurements in multiple sclerosis: evaluation of brain damage and clinical implications. Mult Scler Int2013;2013:671730CrossRef Medline
34. Liu Y, Duan Y, He Y, et al.Whole brain white matter changes revealed by multiple diffusion metrics in multiple sclerosis: a TBSS study.Eur J Radiology2012;81:2826–32CrossRef Medline 35. Huang J, Liu Y, Zhao T, et al.White matter microstructural
altera-tions in clinically isolated syndrome and multiple sclerosis.J Clin Neurosci2018;53:27–33CrossRef Medline
36. Miller DH, Barkhof F, Frank JA, et al.Measurement of atrophy in multiple sclerosis: pathological basis, methodological aspects and clinical relevance.Brain2002;125:1676–95CrossRef Medline 37. Inglese M, Bester M. Diffusion imaging in multiple sclerosis:
research and clinical implications. NMR Biomed2010;23:865–72 CrossRef Medline
38. Schneider T, Brownlee W, Zhang H, et al.Sensitivity of multi-shell NODDI to multiple sclerosis white matter changes: a pilot study. Funct Neurol2017;32:97–101CrossRef Medline
39. Chung AW, Seunarine KK, Clark CA.NODDI reproducibility and variability with magnetic field strength: a comparison between 1.5 T and 3 T.Hum Brain Mapp2016;37:4550–65CrossRef Medline 40. Barbosa S, Blumhardt LD, Roberts N, et al. Magnetic resonance
relaxation time mapping in multiple sclerosis: normal appearing white matter and the“invisible”lesion load.Magn Reson Imaging 1994;12:33–42CrossRef Medline
41. Davies GR, Hadjiprocopis A, Altmann DR, et al.Normal-appearing grey and white matter T1 abnormality in early relapsing-remitting multiple sclerosis: a longitudinal study.Mult Scler2007;13:169–77 CrossRef Medline
42. Shepherd TM, Kirov II, Charlson E, et al.New rapid, accurate T2 quantification detects pathology in normal-appearing brain regions of relapsing-remitting patients with MS.Neuroimage Clin 2017;14:363–70CrossRef Medline
43. Reitz SC, Hof SM, Fleischer V, et al.Multi-parametric quantitative MRI of normal appearing white matter in multiple sclerosis, and the effect of disease activity on T2. Brain Imaging Behav 2017;11:744–53CrossRef Medline