1
The measurement of arousal by the means of electrodermal activity
during an actually performed balance beam routine and
observational learning of the same routine
Melanie Knufinke
Bachelor Thesis
Faculty of behavioral sciences University of Twente
Enschede, 01 February 2012 Subject: Bachelorthesis HFM
2
Summary
The aim of this study was to gain insight into arousal patterns of gymnasts during actual performance (AP) and observational learning (OL) of a beam routine. Arousal was measured by the means of electro dermal activity (EDA) with a wireless, logging sensor. A second aim was to get insight in EDA recordings obtained from different anatomical sensor locations (wrist, forearm, palm). EDA was measured three times when five regional level gymnasts were performing their beam routines, as well as during OL of these routines. EDA was recorded from the wrist and forearm. During the last OL condition, EDA was recorded on the palm. A control group was formed of 11 non-gymnasts to examine whether arousal patterns are due to the stimulus or other factors. Non-gymnasts participated in the OL condition as well when EDA was measured at the palm. Women artistic gymnastics (WAG) employ short intervals of high skilled and demanding exercises eliciting varying levels of arousal. Arousal regulation has become important to enhance performance and prevent injury in WAG and OL is often used to regulate arousal. Comparison of arousal patterns during OL and AP revealed higher skin conductance responses (SCR) during AP. Sensors attached to the forearm during AP had less motion artifacts and showed comparable EDA sensitivity to the sensor attached to the wrist. During OL, the palm has shown to be the most sensitive location when measuring EDA. Although correlations between the conditions and locations were low, some similar trends have been found in EDA waveform. More appropriate statistical methods are needed to further analyze arousal in both conditions. Recommendations for further research are outlined in the discussion. This study gave some insight into arousal patterns during AP an OL and has significant importance in fields as sport psychology, psychophysiology as well as sport physiology.
Keywords: Arousal, electrodermal activity, SCR, observational learning, women artistic
3
Samenvatting
Het doel van deze studie was om inzicht te krijgen in arousal patronen van turnsters tijdens een daadwerkelijk uitgevoerde balkoefening (engels: actual performance, AP) en observational leren van dezelfde oefening. Arousal (opwinding) werd gemeten aan hand van huidgeleiding (engels: electrodermal activity, EDA) met een draadloze sensor die opnames meteen kan opslaan. Een ander doel was om inzicht te krijgen in huidgeleiding opnames, die genomen werden op verschillende anatomische locaties (pols, arm, palm). Huidgeleiding werd drie keer gemeten bij vijf turnsters die hun balkoefening op regionaal niveau turnden en tijdens observational leren van dezelfde oefening. Huidgeleiding werd aan de pols en arm gemeten tijdens de daadwerkelijk uitgevoerde oefening. Alleen tijdens de laatste OL conditie werd huidgeleiding aan de palm gemeten. Een controlegroep van 11 niet-turnsters was opgezet om te onderzoeken of patronen in opwinding ook echt door de stimulus (Balk element in AP en OL) veroorzaakt werden en niet door andere, niet relevante stimuli. De niet-turnsters participeerden alleen in de OL conditie waarbij huidgeleiding uitsluitend aan de palm werd gemeten. Turnen was gekozen als relevante sport omdat het korte, intensieve en inspannende momenten met hoge moeilijkheid heeft, die vaak tijdens het uitvoeren tot hogere opwinding leiden. Het reguleren van deze opwinding heeft belangstelling gevonden in de turnwereld om prestaties te verhogen en blessures te voorkomen. Observational leren wordt daarbij vaak als middel gebruikt. Het vergelijken van opwinding in allebei de condities heeft hogere ‘skin conductance response’s’ (SCR’s) tijdens AP gevonden, vergeleken met OL. Sensoren die EDA aan de arm hebben gemeten hadden minder bewegings-artifacten, dan sensoren die aan de pols hadden gemeten. Tijdens OL bleek de palm het meest sensitief te zijn voor EDA en daarom de betere plek om EDA te meten. Hoewel correlaties tussen de condities en meetlocaties erg laag waren, konden er wat overeenkomsten in EDA-golven worden gezien. Het onderzoek heeft getoond dat beter statistische methoden nodig zijn om goede conclusies te kunnen trekken. Aanbevelingen voor vervolgonderzoek worden in de discussie behandeld. Deze studie heeft enig inzicht gegeven in patronen van opwinding tijdens AP en OL en heeft daarom significante waarde voor gebieden als sportpsychologie, sportfysiologie, psycho-fysiologie en sport fysiologie
4 Contents
1. Introduction 5
1.1 Women Artistic Gymnastics (WAG) 5
1.2 The concept of arousal 7
1.3 Electrodermal activity (EDA) as a mean to measure arousal 8
1.4 Observational learning (OL) 9
1.5 Hypotheses 11
2. Method 14
2.1 Participants 14
2.2 Design and procedure 15
2.3 Instrument and Task 17
2.4 data analysis 20
3. Results 21
3.1 Visual analogue scale 21
3.2 Quantity of mean SCR 22
3.2.1 Mean SCR quantity during AP and OL 23
3.2.2 Habituation effects during OL 23
3.2.3 Palm measures 25
3.2 Mean amplitude of SCR 26
3.3.1 Mean amplitude during AP and OL 26
3.3.2 Habituation effects during OL 27
3.3.3 Palm measures 29
3.4 Gymnasts - non-gymnasts 30
3.5 Correlations 32
3.5.1 Correlations of wrist and forearm EDA recordings during AP 32 3.5.2 Correlations of EDA recordings between AP and OL 34
3.6 Motion artifacts 36
4. Discussion 38
4.1Limitations 45
4.2Conclusion 46
Acknowledgements 38
References 49
5
1. Introduction
The aim of this study is to measure arousal by the means of electrodermal activity (EDA) in a high demanding setting outside of the laboratory with a new wireless, logging sensor. Women artistic gymnastics (WAG) was chosen as sport, because of its short intervals of high skilled and demanding exercises. The nature of the sport and the importance of arousal regulation in injury prevention and performance enhancement will be outlined in detail. Many techniques such as imagery and observational learning (OL) have already been employed to regulate arousal and enhance performance. Due to the significant of OL and its benefits concerning arousal regulation, is the aim of this study to examine arousal in (1) a physical demanding task, namely during a balance beam routine, and (2) during a cognitive task, namely observational learning of the same routine. Results of this study can offer deeper insight into arousal patters during an actual performed task and observational learning of the task and has therefore significant importance in fields as sport psychology, psychophysiology as well as sport physiology. To the best of my knowledge, arousal has never been measured before by the means of EDA during a beam routine or a comparable intense physical activity. Due to the novelty of the method this study is meant as a viability study and has an explorative character. The focus lies on comparison of arousal patterns during two conditions – actual performance (AP) of a balance beam routine and OL of the same routine. Thereby EDA was measured on three different locations, the wrist, forearm and hand-palm, to determine the best location for arousal measures during physical exercise. The results and its implications will be discussed at the end of this paper.
1.1 Women Artistic Gymnastic (WAG)
6 important factors that influence the performance as well as the well-being of the gymnast. Therefore ways of measuring these factors and techniques to regulate them are strongly needed. A study of Poh, Swenson and Picard (2010) found stress to disrupt the balance of the autonomous nervous system and therefore to increase the sympathetic tonus, resulting in higher measurable arousal (Poh et al., 2010). These results lead to the assumption that measuring arousal patterns by the means of EDA during WAG performance is possible but also challenging.
Many authors stress the importance of optimal arousal levels during WAG routines (Tremayne & Barry, 1988). Treymayne and Barry (1988) concluded that gymnasts with low levels of anxiety could easier ignore distracting, irrelevant stimuli and focus with little effort on relevant stimuli during performance, which is quite important during gymnastic routines. Optimal arousal models state that high arousal has a negative effect on performance, whereas reversal theories of arousal state the opposite, that high positive arousal enhances performance (Perkins, Wilson & Kerr, 2001). Perkins et al. (2001) concluded that it depends on the subjective rating of arousal as rather positive or negative, if a performance decreases or improves by arousal. High arousal, combined with a positive motivational state can enhance performance in tasks with maximal motor strength; the reverse was found when arousal was combined with a negative emotional states. The above mentioned stressors affect arousal away from an optimal level, resulting in a loss of focus by the gymnasts (Tremayne & Barry, 1988). Cottyn, Clercq, Pannier, Crombez & Lenoir (2006) already mentioned the significance of anxiety in gymnastics, especially when executing elements of high difficulty on a 10 cm wide balance beam (BB) of 125 cm height. The nature of a beam can elicit anxiety and stress in gymnasts and arousal regulation is expected to improve performance and well-being of the gymnast. Because of the demanding nature of a beam routine, the balance beam has been chosen as event to measure arousal in this study. It is necessary to examine which aspects of the beam routine elicits higher arousal amplitudes and whether these are due to positive feelings as result of a successful performed element, or due to anxiety and stress because of a high demanding element that is to be executed.
7 The significance of arousal within WAG and the need for more research concerning this issue as well as on coping strategies, as e.g. arousal regulation, have become clear. The concept of arousal with a few underling theories will be described in the next section.
1.2 The concept of arousal
In general terms the level of arousal refers to a global state of the mind. This state of mind can range from a continuum from very low, as when a person is asleep, to very high as when a person is fully awake. Arousal is an indicator of brain activity and measurable on a (neuro-) physiological-, psychological- and behavioral level. It is not the same as anxiety or stress, which both have negative connotations, because arousal cannot specify the valance of an emotion. Arousal can be positive, negative or neutral as it has often been visualized in many dimensional theories that illustrate emotions on a continuum that varies on two or more axes, mostly arousal and valance. Arousal can be high as a result of both, extreme positive- or negative emotions. The vector- and circumplex model arrange cognitive and affective states on such dimensions, arousal and valance, which rank from low to high and from positive to negative, respectively (Purves, Brannon, Cabeza, Huettel, LaBar, Platt & Woldorff (2008). By the means of these models, several emotions can be classified to valance and level of arousal.
Several arousal theories aimed to address optimal levels for specific kinds of sports (Perkins et al., 2001). The ‘Inverted U theory’ by Yerkes and Dodson, states that too high or too low levels of arousal and anxiety cause a person to perform poorer compared with performance at a medium level of arousal. But opinions still differ concerning the optimal zone of arousal. Perkins et al. (2001) claim that the motivational state determines if high levels of arousal strengthens or weaken performance in motor tasks. This theory is most accepted nowadays.
8 Scarcity of research exists concerning the contribution of arousal levels during artistic gymnastics performances and OL conditions of WAG routines due to a lack of applicable research methods and technologies. Up to know, research concerning arousal by athletes was restricted to heart rate and qualitative approaches and little event related sampling (i.e. related to a particular isolated gymnastic element) has been done yet (Cottyn, et al., 2006; Cottyn, Clercq, Crombez & Lenoir, 2008; Tremayne & Barry, 1988). The following section will describe a new technology, the Affectiva Q™ Sensor that can measure arousal by the means of EDA outside the laboratory.
1.3 Electrodermal activity (EDA) as a mean to measure arousal
Electrodermal activity (EDA) refers to changes in the skin conductance at the skins surface. These changes are an indirect indicator of activity in the sympathetic branch of the autonomous nervous system and used in various clinical and nonclinical settings. EDA can be measured as a result of eccrine sweat gland activity (Turaclar, Erdal, Arslan, & Yildiz, 1999). Activity of the sympathetic branch is associated with emotion, cognition and attention (Critchley, 2002). Therefore conditions such as anxiety, high physical arousal or high cognitive work load can increase the sympathetic tonus and change the peaks of the EDA.
This physiological measure could give a more detailed, event related and specific insight into arousal patterns during actual performance and observational learning of a WAG routine that have never been explored before. Arousal measures obtained by the means of EDA can give no specification of valance of a specific emotion as explained before. To determine whether arousal was higher due to a negative stressor as anxiety or a positive event as successfully performing an element, additional qualitative approaches are necessary. Observations and questionnaires concerning mood and emotional states are commonly used to determine the valance of physical arousal.
9 EDA waveforms show actual skin conductance responses instead of flat lines. Little electrical noise and few motion artifacts are other validation criteria in this study.
1.4 Observational learning (OL)
Observational learning (OL) is beside actual performance (AP) of a beam routine, the second condition in which arousal is measured in this study. This section briefly outlines the benefits of OL and the way it is used in sports.
Observational learning, also known as social learning or modeling, is learning that occurs by the means of observing others executing novel, to the observer, unfamiliar tasks. It can be seen as learning by observing and reproducing behavior of an expert model. It has its origin in the social learning theory by Bandura (Bandura, 1991), who states that four stages, attention, retention, motor reproduction and motivation, need to be involved for successful OL .
Even though OL is a commonly used technique on recreational- and elite level in nearly all kind of sports, it gets employed in different ways. Competitive and recreational athletes use OL to a lesser extent than school-team (varsity) athletes do (Wesh, Law & Hall, n.d.).Varsity athletes use OL mainly to maintain their level of performance and to promote health, instead of using it mostly for performance enhancement (West et al., n.d.).
A further distinction can be made between individual and team athletes. Individual performance is characterized by the fact that individuals perform their actions independently of others. If a team score (e.g. for a group of gymnasts from one country) needs to be calculated all individual scores will be summarized to a total score. In contrast, team performance is defined as performance in which individuals need to coordinate and integrate their action with the actions performed by others (Wesh et al, n.d.). Individual athletes more often use OL for skill learning whereas team athletes use OL more for learning strategies that can be employed during games and competitions with others (Wesh et al., n.d.). Therefore gymnasts, who are individual athletes, can be expected to use OL to enhance their general skill level.
10 OL to enhance motivation and goal setting in sports (Cumming et al., 2005). These results reveal that an OL task should involve evaluation on skills and strategies. In the case of gymnasts, strategies can better be translated to techniques.
Besides positive effects on performance, OL has been found to positively influence psychological variables as well. McCullagh and Weiss (2002) claim that OL is a psychological method to modify thought, emotions, and behavior in athletes. Ives, Straub and Shelly (2002) have used video recordings to improve emotional and motor behavior as well as player-coach communication in athletes. Wulf et al., (2009) claim that observational practice enables a learner to accomplish processing that could not occur during actual physical practice. Athletes are also found to use OL to regulate their arousal levels and other mental states that in turn can enhance performance (Cumming et al., 2005). A variety of psychological strategies are used nowadays to optimize athletic performances. Especially for explosive athletic performances as e.g. shot-put, javelin, weight-lifting and sprinting, where maximal motor activity during short time intervals is significant, mental preparation strategies, that additionally integrate arousal regulation, are important to enhance performance (Perkins, Wilson & Kerr, 2001). Therefore OL can be regarded as an important tool for WAG and even seem to effect emotion and arousal in either way.
11 successful outcomes despite anxiety; (7) demonstrating new skills composed to preexisting sub-skills. Dowrick (1999) described improvement in gymnastic routines by the use of positive self-review through self-modeling. The sixth factor is of special importance in this study, because it indicates that anxiety can be regulated by self-modeling. In some sports, self modeling even seems to work out better in performance improvement as when observing others, as it was the case with swimmers (Starek & McCullagh, 1999). Baudry, Leroy and Chollet (2006) also indicated improvements in sport movement due to video-feedback with expert- as well as self-model recordings. Though self-modeling as well as expert-modeling is found to improve motor performance and to learn and evaluate on motor skills. Because of the variety of names used for observational learning, expert- and self-modeling, the term ‘observational learning’ will be used in this study.
The efficiency of OL as a psychological tool in sports to enhance performance of top- and recreational athletes, to learn simple and complex motor skills and to prevent injury (Wulf, Shea & Lewthwaite, 2009), has become clear. To enable observational learning, video recordings are often used by coaches. Williams and Grant (1999) concluded videotaping to be one of the best strategies to improve and train perceptual motor skills of athletes. The use of videos for documenting behavior made it easier to evaluate and give appropriate feedback, to enhance and train motor- and perceptual skills and to apply behavior modification strategies (Ives, Straub & Shelley, 2002). Based on these findings, this study will also use video recordings for observational learning.
1.5 Hypotheses
This study has a rather exploratory character due to the novel characteristics and applications of the Affectiva Q™ Sensor, which enables new areas of arousal measures by the means of EDA in a non-lab setting.
12 during both execution and observation of the same motor action. fMRI scans during a ‘dance’ and a ‘watch’ condition showed some common activity during observational and physical learning in parts of the AON. Premotor- and parietal regions showed activity only when observing familiar sequences that have been danced or watched before but not when unfamiliar sequences were observed (Cross et al., 2009). Other areas as the premotor cortex, supplementary motor area, inferior parietal lobule, cingulated gyrus and cerebellum share neural activity during OL and AP, as well (Wesh et al, 2009; Grezes & Decety, 2001). Given these results, it could be expected that participants revive the actual executed movement and situation when observing themselves. Given the fact that brain structures that are associated with motor planning and execution are active during both AP and OL, it could be possible that brain structures that regulate arousal are active during both conditions as well. This analogy leads to the assumption that arousal levels, which are dominated by the autonomic nervous system, show comparable patterns during both conditions, too. If that would be the case, OL could be used goal directed and element specific to regulate arousal during WAG routines. Poh et al. 2010 already found increases in EDA conductance during physical, cognitive and emotional strains. Therefore it should be possible to encounter increased skin conductance during a physical task, as a beam routine, and a cognitive task, observing and rating the same beam routine in this study as well. Therefore the main question guiding this study is whether arousal patterns differ when measured either during an actually performed balance beam (BB) routine or during observational learning of the same routine.
13 H1- SCR quantity does not differ in the AP routine condition compared to the OL condition.
H2- SCR’s in the AP routine condition are expected to have higher amplitudes (higher skin conductance response (SCR) compared to the OL condition.
A pilot study was conducted to detect whether the gymnasts are hindered by the sensor when performing a beam routine. Due to the motion intense character of WAG, sensors were attached on two spots on the arm to minimize motion artifacts in the recordings. Still pressure can be applied to the electrodes during the routine which can disturb the electrode-skin contact, what results in steep peaks - motion artifacts, in the recordings. Two locations are chosen to detect whether motion artifacts are lesser on a certain spot. No EDA recordings were obtained from the palm during actual performance of the beam routine, because the sensor can hinder or injure gymnast while performing several elements that include hogging moments on the hands. Although the ability of continuous EDA measurement during daily activity has already proved to have few motion artifacts (Poh et al., 2010), this study aims to determine if that also counts for different measurement locations in high intense sports. Gymnasts anticipate intense hogging moments and pressure to the joints during especially the acrobatic elements that were to be executed which could lead to more motion artifacts than usual, especially to the senor attached to the wrist. Less motion artifacts were expected to occur at the forearm compared to the wrist. The pilot study showed, that the gymnast was not hindered by either of the Affectiva Q™ Sensors, attached to the ventral forearm and wrist. Moreover, both sensors already showed different amplitudes in SCR. Differences in SCR amplitudes could be due to differences in eccrine sweat gland density on the arm. Eccrine sweat glands on the forearm have a lower mean density (225) density/cm², compared to glands on the wrist and hand palm (380) density/cm² (Worret & Gehring, 2003). Still, several authors concluded higher sensitivity and therefore better skin conductance when EDA was measured at the palm compared to the forearm (Poh et al., 2010; Picard et al., n.d.), therefore conductance is expected to be higher when measured on the palm. Therefore three sensor locations, the hand-palm, the ventral lefts wrist and forearm, were handled in this study. These assumptions led to the following sub-hypotheses:
14 S2- Recordings of the Affectiva Q™ Sensors attached to the ventral forearm are expected to have lower average SCR amplitudes compared to the sensor attached to the wrist.
S3- Recordings of the Affectiva Q™ Sensors attached to the forearm are expected to show less motion artifacts during AP compared to the sensor attached to the wrist. S4- Recordings of the Affectiva Q™ Sensors attached to the palm (during the last OL phase) will show more SCR`s during OL than when attached to the wrist or forearm. S5- Recordings of the Affectiva Q™ Sensors attached to the palm (during the last OL phase) will show higher SCR amplitudes during OL than when attached to the wrist or forearm.
Non-gymnasts are exposed to the video recordings as well, to examine whether the stimulus elicits significant arousal responses as well. For non-gymnast, a beam routine is an unexpected, unfamiliar and novel stimulus. Therefore the same number of SCR’s are expected to occur but with higher mean amplitudes compared to the gymnasts, which are used to exposure of beam routines. That is because both groups are expected to show some increase in skin conductance elicited by the stimulus, but non-gymnasts are expected to have more intense reactions, resulting in higher mean SCR amplitudes.
S6- Mean number of SCR does not differ between non-gymnasts and gymnasts during OL.
S7- SCR amplitudes are higher for non-gymnasts than for gymnast during OL.
2. Method
2.1 Participants
15 A control group was formed by 11 non-gymnasts aged between 22 and 28 years (M = 24.55, SD = 1.968) of whom 7 are male. None of the participants had any gymnastic experiences, except of physical education lessons at school. Two participants did not participate in any sports at all, whereas eight participated in individual sports (fitness, jogging, boxing, judo), and one had experiences in individual and team-sports. All control participants were either Dutch (N = 7) or German (N = 4).
All participants signed the written informed consent for inclusion in this study. No participants refused to participate or resigned during the research period of 4 weeks for the gymnasts, or half an hour for the non-gymnasts. Participation was voluntarily and no credits or financial contributions were offered after participation.
2.2 Design and procedure
Experimental group
EDA was recorded weekly across two conditions (actual routine vs. observational learning) during a total period of four weeks. The within-subject design contained videotaping of three balance beam (BB) routines for each participant, two visual analogous scales each session, and three observational learning trials with different ‘attending tasks’, described below. The OL sessions took place once immediately after the routine, once after a training session and once on a training- unrelated day.
16 Participants of the experimental group were welcomed to their normal training session and were handed a sheet with information about the experiment. After reading they were free to ask questions and to sign the informed consent (Appendix H). Subsequently, two Affectiva Q™ Sensors Curve/Pod (Figure 3.2.1) were placed on clean skin respectively on the ventral part of the left forearm and the left wrist. Assistance and information was provided when attaching the sensor and the participants provided some demographical information (Appendix I). To adjust the skin to the sensor all participants followed the usual warming up. Thereafter the experimental conditions started and the gymnasts performed a beam routine which was recorded. After the routine, a VAS (Appendix J) was filled in and the gymnasts had some time to rest. Next, the first OL trial started and the participants were asked to observe their routine motionless and without talking. Thereafter they were asked to evaluate on their routine on the aspects given in the ‘attending task’, which is described in the following section. After all three OL trials, the gymnasts were asked to fill in another VAS, measuring their perceived arousal when watching themselves performing the separate elements on the beam.
The last OL session took place on a training- unrelated day. During these three OL trials, EDA was measured on the hand-palm. To ensure good transmission between the skin and the Q-sensor, all participants were asked to climb some stairs before starting with the OL task. This physical exercise increases sweat gland activity and ensures that the conductivity of the skin quickly reaches a level where reliable EDA measurements can be done with dry electrodes. After the four week period of participation, debriefing was offered and participants were thanked for their cooperation.
Control group
17 Another two OL trials followed with different ‘attending tasks’. At the end of all three OL trials, participants were asked to fill in a VAS to report their perceived arousal when observing each element of the beam routine. After participation, debriefing was offered and participants were thanked for their cooperation.
2.3 Instrument and Task
Affectiva Q™ Sensor
To record electrodermal activity (EDA), that indicates activity of the sympathetic branch of the autonomous nervous system (ANS), the Affectiva Q sensor curve and pod were used. Figure 2.3.1 shows two Affectiva Q sensor curves attached to the wrist and forearm. The Q-sensor curve (56.6mm x 38,1mm x 14.7mm; weight 22.7 g) and pod are very small, logging, wireless biosensors that can be attached to the palm, wrist, forearm, leg or more, by a washable, stretchy band that enables longitudinal comfortable measurement of skin conductance, skin temperature and motion outside the lab (Poh et al., 2010; Picard, Sano, & Kaliouby, n.d.). The Affectiva Q™ Sensor used in this study has some advantages compared to other sensors that measures EDA on the fingertips or hand-palms, because such sensors could interfere with daily activity and in this case with normal beam routine performance. Therefore the Affectiva Q™ Sensor, attached to the wrist and forearm enables measurement during demanding tasks where the hands were not restrained. In this case a sampling rate of 32 Hz was used. Silver electrodes were used that don’t need additional electrode paste. A pilot study showed that the gymnasts experienced no hindrance by the sensors when performing a BB routine. After each training session, the EDA data was transmitted to a personal computer.
18
Actual performed routine
During the BB routine EDA was recorded at a sample rate of 32 Hz by sensors attached to the left ventral wrist and forearm of the gymnasts. Each routine was recorded with a video camera that was directed to record the scene from the long side of the beam. The recordings were used to support time sampling and to collect video material for the OL condition.
All gymnasts performed a BB routine on the same level of difficulty (level 7, division 6) which suit the international norms formulated by the ‘code de pointage’ which is governed by the Fédération Internationale de Gymnastique (FIG). The beam used for this study fits the following measurements of the apparatus: 125cm height, 500cm length and 10 cm width, described by the FIG in the Apparatus Norms Brochure (Schweizer, 2009).
No judgment took place and the usual time restrictions of 90 seconds per routine, were neglected. To ensure clean event related sampling of SCR’s each participant was asked to avoid movement for 7-10 seconds before continuing with the following element listed in the FIG. Gymnasts did not receive deduction after a fall and were not asked to perform the routine fluently as it would be the case during competition. The sequential arrangement of the different routines requirements were chosen freely for each gymnast.
A short period of time was offered to warm up on the beam. The participants started with the actual experiment immediately after the warming up. An event button on the Affectiva Q™ Sensors, that sets a marker in the data, was pressed in front of the camera to mark the beginning and the end of a routine to enable proper time synchronization. The sensor’s clock was additionally synchronized with a computer that was used to show the videotaped routines. The control group of non-gymnast did not participate in the actual performance condition.
Observational learning
19 To ensure active participation during OL, ‘attending tasks’ were added to the OL condition (Appendix K). That was, because actively observing one`s own, actual performance instead of being passive during observation has positive effects on learning (Fireman, Kose & Solomon, 2003). Each time the video was shown, the participants noted, for each attending task, two positive and two negative aspects of their routine at the end of the video. The first OL trial had accuracy as attending task, the second OL trial had technical execution as attending task, and the third OL trial had perceived difficulty of the element as attending task. Accuracy was chosen as first aspect to pay attention to. This choice is based on the study of Zentgraf et al. (2005), concluding that SMA motor area activity during observation of whole body gymnastic movements depends on instruction modes, one of their instructions includes evaluation of accuracy. Activation of motor areas in the brain by using observational learning, results in better physical performance when AP and OL are combined as stated by several authors (Cross et al., 2009; Wesh et al, 2009; Grezes & Decety, 2001). It can be concluded that participant really attend to the recordings during OL, when using these instructions that are found to activate motor areas in the brain. Technical execution was chosen as a second aspect of the attending task because of the findings of Hars and Calmels (2007) claiming that elite gymnasts use OL of their own routines to increase performance, to increase technical execution, to improve self-assessment, to increase imagery and visual perceptions, and to gain spatial information. Perceived difficulty was chosen as the final aspect to pay attention to, because it encourages self-assessment which has been found to be a second variable, artistic gymnasts pay attention to, when observing their own performance (Hars & Camels, 2007).
Again, the event button on the Affectiva Q™ Sensor curve/pod, that sets a marker in the data, was pressed simultaneously with the bottom that was pressed in the video to enable synchronization. The sensor’s clock was additionally synchronized with a computer that was used to show the videotaped routines.
20 gymnasts needed to rate the technical execution of the beam routine and during the last OL trial, gymnast needed to rate the difficulty of the routine. Participants needed to justified their judgment on the given attention criteria in 2-3 sentences.
Visual Analogue Scale (VAS)
After each condition, retrospective self reported levels of arousal for each performed element were obtained by means of a visual analogue scale (VAS) (Appendix J).
VAS was filled in immediately after each actual performed BB routine, to exclude memory biases. The time required to fill in the scale was also used to transfer the recorded video to the computer and to regulate tension and arousal levels of the participants.
After each set of three OL trials, again the VAS was used to obtain self-reported levels of arousal for each element separately when observing the beam performance. The control group only filled in the VAS once, immediately after watching the three OL trials.
2.4 Data analysis
Visual analogue scale
Scores from 0-10 (0= low arousal; 10= high arousal) were assigned to the obtained markers for perceived arousal during AP en OL. Each performed element was categorized and ordered into a group of comparable elements which are added in the Appendix A. No statistics were done because the data has no direction and was purely meant as empirical validation of the stimulus.
EDA recordings
Irrelevant EDA recordings, as e.g. walking to the beam, were cut out of the data. The cut has taken place when the gymnasts gave a sign to start and end the routine. Measurement errors as electrical noise, pressure- and motion artifacts were filtered by a Butterworth Low pass filter with a cut-off frequency of 1/32 Hz which was the sampling frequency.
21 significance level corrected for multiple comparisons with the Bonferroni method. SPSS multiplies the p-value with the Bonferroni multiplier instead of dividing α by the Bonferroni multiplier. The results are, however, equal and this method corrects for multiple comparisons. The Bonferroni corrected will be denoted as p-values by pB.”
3. Results
3.1 Visual analogue scale
Table 3.1.1 shows mean and standard error of mean scores for subjective perceived arousal levels for AP and OL of each element separately, obtained from the gymnasts. Table 3.1.1
Descriptive statistics of the gymnasts subjective perceived arousal for AP and OL for each element separately.
Condition Element N M S.E.
AP Mount 5 2.2 1.15
Gymnastic leap 1 5 4.6 1.03
Gymnastic leap 2 4 4.25 1.6
Balance element 5 4.2 1.56
Full turn/ hop with 180° 4 4.75 1.10
Acrobatic element 5 8.0 .70
Dismount 4 8.0 .91
OL Mount 5 1.0 .447
Gymnastic leap 1 5 5.2 .86
Gymnastic leap 2 4 4.5 1.55
Balance element 5 4.6 1.24
Full turn/ hop with 180° 4 3.0 1.47
Acrobatic element 5 7.0 .54
[image:21.595.81.471.369.677.2]Dismount 4 7.25 .75
22 appendix A. The tables only comprise data from the first day; all other data can be found in appendix B.
Table 3.1.2
Mean and standard error of mean of non-gymnasts subjective perceived arousal for AP and OL for each element separately.
Condition Element N M S.E.
OL Mount 11 1.36 .244
Gymnastic leap 1 11 5.36 .717
Gymnastic leap 2 11 5.36 .717
Balance element 11 3.45 .705
Full turn/ hop with
180°
11 3.09 .579
Acrobatic element 11 6.36 .491
Dismount 11 8.18 .483
Whole routine 11 4.91 .456
Mean scores reveal that a beam routine comprises exciting elements as well as less exciting elements, that elicits different arousal levels in both gymnasts as well as non-gymnasts. The mean scores also reveal that participants perceived different arousal levels during both conditions AP and OL. Both groups rated the acrobatic element and the dismount highest.
3.2. Quantity of mean SCR
Data concerning the control group of 11 non-gymnasts, will be presented in section 3.4 ‘gymnasts- non-gymnasts’. The following paragraphs will be limited to results obtained from the experimental group of five gymnasts.
3.2.1 Mean SCR quantity during AP and OL
23 from the forearm on both days during OL. Mean SCR were lower during the first OL trial on day two, compared to day one.
Table 3.2.1
Mean and Standard error of mean of SCR`s quantity.
A 2x2x2 repeated measure ANOVA was carried out with ‘Condition’ (AP, OL), ‘Day’ (1, 2) and ‘Location’ (wrist, forearm). The main effect of ‘Condition’ was found significant with F(1,3) = 46.02, p < .007. Pairwise comparisons with Bonferroni correction showed that significantly more SCR´s were found during AP of the beam routine, (M = 19.5, SE = 1.82) than during OL of the same routine (M = 6.87, SE = .83) with t(3) = 265.85, pB = .007. All
other main- and interaction effects have not been found significant p >.05.
3.2.2 Habituation effects during OL
Table 3.2.2 shows mean and standard error of mean of SCR`s quantity obtained from the wrist and forearm during three successive OL trials on 2 days. Mean numbers are higher when measured at the wrist than when measured at the forearm. Mean quantity of SCR decreases after repeatedly observing a beam routine. Mean quantity of SCR is lower on day 2 than on the first day. If all these difference are significant need to be analyzed further.
Tabel 3.2.2
Mean and Standard error of mean of SCR`s quantity obtained from wrist and forearm during three successive OL trials on 2 days.
Day Condition Location N M S.E.
1 AP Wrist 5 19.40 1.96
Forearm 5 19.40 2.20
OL Wrist 5 11.00 1.26
Forearm 5 7.00 1.04
2
AP Wrist 4 17.00 6.09
Forearm 4 20.25 3.49
OL Wrist- 5 5.40 1.74
24
Day Location Condition N M S.E.
1 Wrist
OL 1 5 11.0 1.26
OL 2 5 7.20 2.26
OL 3 5 3.6 1.12
Forearm
OL 1 5 7.0 1.04
OL 2 5 .4 .244
OL 3 5 .2 .20
2 Wrist
OL 1 5 5.4 1.74
OL 2 5 3.8 2.0
OL 3 5 2.2 1.11
Forearm
OL 1 5 3.2 2.33
OL 2 5 4.0 2.91
OL 3 5 4.8 2.95
To analyze whether habituation has taken place during the three observational learning trials, and whether the sensor locations matters, another 2x2x3 repeated measure ANOVA was carried out with ‘Day’ (1, 2), ‘Location’ (wrist, forearm) and ‘Repetition’ (1, 2, 3). A main effect of the factor ‘Repetition’ was found significant with F(2,8) = 12.52, p< .003. Pairwise comparisons with Bonferroni correction showed significantly more SCR´s during the first observation (M = 6.65, SE = .683) than during the third observation (M = 2.7, SE = .92), t(3) = 55.25, pB =.012. No significant difference in mean number of SCR was found between
the first and the second observational condition with p >.05, neither between the second and the third observation with p > .05. An interaction effect of the factors ‘Day’ and ‘Repetition’ have been found significant with F(2,8) = 6.57, p < 0.02. Pairwise comparisons with Bonferroni correction showed significantly more SCR´s on day one during the first OL trial, (M = 9, SE = 1.09) than during the second OL trial (M = 3.8, SE = 1.15), t(4) = 38.41, pB =
.029 and the third trial (M = 1.9, SE = .64), t(4) = 134.62, pB = .008. No significant difference
25 have been found significant with p >.05. None of the other main- and interaction effects have been found to be significant with p > .05.
3.2.3 Palm measures
[image:25.595.66.530.305.558.2]To compare mean number of SCR`s during observational learning, recordings obtained from the wrist, forearm and palm were analyzed. Table 3.2.3 shows mean and standard error of mean of mean number of SCR`s for all three locations (palm, wrist, forearm) during the three OL trials.
Tabel 3.2.3
Mean and Standard error of mean of SCR`s quantity obtained from wrist, forearm and palm.
Location Condition N M S.E.
Palm
OL 1 5 23.60 3.613
OL 2 5 26.40 4.945
OL 3 5 24.20 3.484
Wrist
OL 1 5 5.40 1.749
OL 2 5 3.80 2.009
OL 3 5 2.20 1.113
Forearm
OL 1 5 3.20 2.332
OL 2 5 4.00 2.915
OL 3 5 4.80 2.956
A 3x3 repeated measure ANOVA was carried out with ‘Location’ (1, 2, 3) and ‘Repetition’ (1, 2, 3) with EDA recordings obtained from the second and third day during OL. A main effect of ‘Location’ was found significant with F(2,8) = 17.25, p < .001. Pairwise comparisons with Bonferroni correction showed significant more SCR`s detected by the sensor attached to the palm (M = 24.73, SE = 3.69) compared to the sensor attached to the wrist (M = 3.8, SE = 1.5) and t(4) = 388.25, pB = .008. No significant difference was found
26
3.3 Mean amplitude of SCR
3.3.1 Mean amplitude during AP and OL
[image:26.595.65.538.289.520.2]Table 3.3.1 shows the means and the standard error of mean values for the mean amplitude of SCR`s per ‘Condition’ (AP, OL), per ‘Day’ (1, 2) and per ‘Location’ (wrist, forearm). Mean values show SCR amplitudes to be higher during AP of the beam routine than during OL of the same routine.
Table 3.3.1
Mean and Standard error of mean of SCR`s amplitude.
A 2x2x2 repeated measure ANOVA was carried out with ‘Condition’ (AP, OL), ‘Day’ (1, 2) and ‘Location’ (wrist, forearm). A main effect of ‘Condition’ was found significant with F(1,3) = 14.76, p < .031. Pairwise comparisons with Bonferroni correction showed significantly higher mean amplitude during AP of the beam routine, (M = .151, SE = .023) than during OL of the same routine (M = .045, SE = .006), t(3) = .09, pB = .031. All other
main- and interaction effects have not been found significant with p > .05
3.3.2 Habituation effects during OL
Table 3.3.2 shows mean and standard error of mean amplitude of SCR`s obtained from the wrist and forearm during three successive OL trials on two days. Mean amplitudes are
Day Condition Location N M S.E.
1
AP Wrist 5 .165 .035
Forearm 5 .190 .038
OL Wrist 5 .067 .013
Forearm 5 .069 .016
2
AP Wrist 4 .108 .038
Forearm 4 .189 .029
OL Wrist- 5 .032 .009
27 about the same for both locations and are just sometimes slightly higher for the wrist. Mean amplitude of SCR decreases after repeatedly observing a beam routine. Mean amplitude of SCR is lower on the second day than on the first day. If all these difference are significant need to be analyzed further.
Tabel 3.3.2
Mean and Standard error of mean amplitude of SCR`s obtained from wrist and forearm during three successive OL trials on 2 days.
Day Location Condition N M S.E.
1 Wrist
OL 1 5 .067 .029
OL 2 5 .057 .044
OL 3 5 .018 .014
Forearm
OL 1 5 .069 .035
OL 2 5 .006 .009
OL 3 5 .004 .009
2 Wrist
OL 1 5 .032 .022
OL 2 5 .020 .022
OL 3 5 .018 .019
Forearm .
OL 1 5 .015 .023
OL 2 5 .008 .011
OL 3 5 .007 .010
To analyze whether habituation has taken place during the three observational learning trials, and whether the sensor locations matters, another 2x2x3 repeated measure ANOVA was carried out with ‘Day’ (1, 2), ‘Location’ (wrist, forearm) and ‘Repetition’ (1, 2, 3). A main effect of ‘Day’ was found significant with F(1,4) = 11.08, p = .029. Pairwise comparisons with Bonferroni correction showed a significant higher mean amplitude on the first day, (M = .037, SE = .004) than during observation on the second day (M = .017, SE = .003), t(4) = .20, pB = .029. A main effect for repetition was found with F(2,8) = 12.63, p =
28 observation (M = .012, SE = .003), t(4) = .24, pB = .029. No significant difference was found
between the first and the second observation, p> .05, neither between the second and third observation, p > .05. No main effect for ‘Location’ was found p > .05. An interaction effect of the factors ‘Day’ and ‘Repetition’ was found significant with F(2,8) = 5.27, p = .035. Pairwise comparisons with Bonferroni correction showed a higher mean amplitude on the first OL trial (M = .068, SE = .009) compared to the third OL trial (M = .011, SE = .005), t(4) = .41, pB =
29
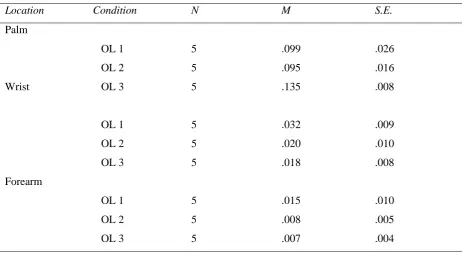
3.3.3 Palm measures
[image:29.595.66.529.255.508.2]To compare mean amplitude of SCR, recordings obtained from the wrist, forearm and palm were analyzed. Table 3.3.3 shows the mean en standard error of mean for SCR amplitude for all three locations (palm, wrist, forearm) during the three OL trials.
Tabel 3.3.3
Mean and Standard error of mean amplitude of SCR`s quantity obtained from wrist, forearm and palm.
Location Condition N M S.E.
Palm
OL 1 5 .099 .026
OL 2 5 .095 .016
Wrist OL 3 5 .135 .008
OL 1 5 .032 .009
OL 2 5 .020 .010
OL 3 5 .018 .008
Forearm
OL 1 5 .015 .010
OL 2 5 .008 .005
OL 3 5 .007 .004
A 3x3 repeated measure ANOVA was carried out with ‘Location (1, 2, 3) and ‘Repetition’ (1, 2, 3) with data obtained from the second and third day during three OL trials. A main effect of ‘Location’ was found significant with F(2,8) = 28.36, p < .001. Pairwise comparisons with Bonferroni correction showed a significant higher mean amplitude detected by the sensor attached to the palm (M = .11, SE = .016) compared to the sensor attached to the wrist (M = .024, SE = .008) and t(4) = 2, pB = .006. SCR amplitude obtained from the sensor
attached to the forearm (M = .01, SE = .007), were significantly lower than recordings from the palm, t(4) = 1.21, pB = .014. No significant difference in amplitude was found between
30
3.4 Gymnasts - non-gymnasts
Mean SCR quantity
[image:30.595.65.531.373.660.2]A non-parametric test was used because some data departed from normality, histograms are illustrated in appendix F. Table 3.4.1 gives an overview of mean rank and sum of ranks for mean number of SCR obtained on the hand-palm during OL. Mann- Whitney test for unrelated groups was carried out for the three OL trials on the palm with as grouping variable (gymnasts, non-gymnasts). Significant differences U = 4, p < .008, two tailed, were found between both groups for the third OL trial. Mean rank scores reveal more mean SCR for the gymnasts (M = 12.2) during the third OL trials, compared to non-gymnasts (M = 5.9) during the first and second OL trials, no significant group difference was found with p > .05.
Table 3.4.1
Mean Rank and Sum of Rank for mean number SCR obtained from the palm.
Condition Group N Mean Rank Sum of Rank
OL 1 Palm OL 1 Palm
Gymnast 5 9.60 48.00
Non-gymnast 10 7.20 72.00
Total 15
OL 2 Palm
Gymnast 5 11.20 56.00
Non-gymnast 10 6.40 64.00
Total 15
OL 3 Palm
Gymnast 5 12.20 61.00
Non-gymnast 10 5.90 59.00
Total 15
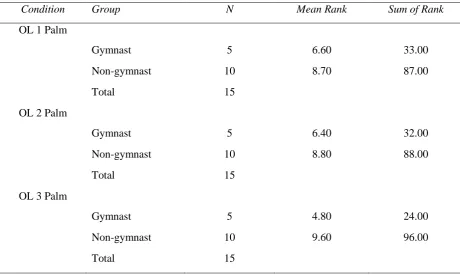
SCR Amplitude
31 of ranks for mean amplitudes obtained on the hand palm during OL. Mann- Whitney test for unrelated groups was carried out for the three OL trials on the palm with as grouping variable (gymnasts, non-gymnasts). Significant differences U = 9, p = .05, one tailed, were found between both groups for the third OL trial. Mean rank numbers reveal that gymnasts had significant lower mean amplitudes (M = 4.8) than non-gymnasts (M = 9.6). During the first two OL conditions, no significant group difference was found with p > .05.
Table 3.4.2
Mean Rank and Sum of Rank for mean amplitude obtained from the palm.
Condition Group N Mean Rank Sum of Rank
OL 1 Palm
Gymnast 5 6.60 33.00
Non-gymnast 10 8.70 87.00
Total 15
OL 2 Palm
Gymnast 5 6.40 32.00
Non-gymnast 10 8.80 88.00
Total 15
OL 3 Palm
Gymnast 5 4.80 24.00
Non-gymnast 10 9.60 96.00
32
3.5 Correlations
3.5.1 Correlations of wrist and forearm EDA recordings during AP
[image:32.595.67.526.442.578.2]Pearson`s correlations were calculated for the wrist and forearm for all 5 subjects during AP. All of these recordings were significant with α = .001. Because of the overall significant α, p-values will not be denoted explicitly in the text. Figure 3.5.1 shows the EDA waveforms during actual performance obtained from the wrist and arm. The correlation coefficient R is denoted in the graphic. The graphic only represents recordings of a beam routine for subject 2 and 5 on three days which are quite representative for the whole sample; correlations from all other subjects are reported in table 3.5.1 and EDA waveforms can be found in appendix C. For illustrative purposes all values were subtracted by their means and arranged around the zero on the y-ass. Thereby space between the recordings was reduced making it easier to compare the EDA recordings.
Table 3.5.1
Pearson’s Correlations R of EDA recordings obtained from the wrist and forearm during actual performance.
Pearson`s R
Subject Day 1 Day 2 Day 3
1 .72 .10 -
2 .41 -.28 -.18
3 -.27 .38 -
4 .22 -.02 .20
5 .68 .65 .73
34
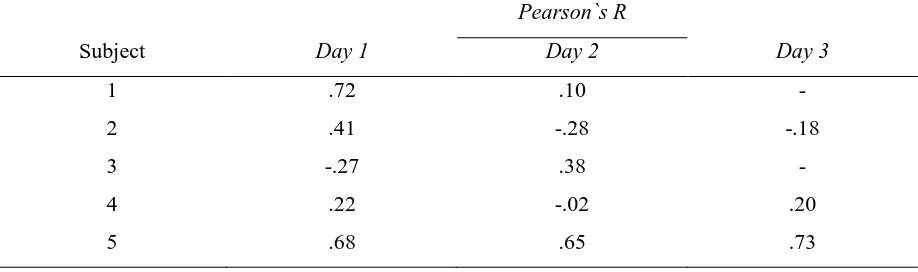
3.5.2 Correlations of EDA recordings between AP and OL
[image:34.595.70.530.285.626.2]Pearson`s correlations were calculated for the wrist and forearm for all 5 subjects during AP and OL (Table 3.5.2). All of these recordings were significant with α = .001. Because of the overall significant α, p-values will not be denoted explicitly in the text.
Table 3.5.2
Pearson’s Correlations R of EDA recordings for (a) actual performance and observational learning obtained from the wrist (b) actual performance and observational learning obtained from the forearm (c) the first observational learning trial for wrist and forearm.
Pearson`s R
Subject Day AP – OL Wrist AP – OL Forearm OL - OL
1
Day1 .34 .58 .59
Day 2 -.93 -.93 .99
2
Day 1 .38 .38 .96
Day 2 -.86 .59 -.61
3
Day 1 .37 .79 .71
Day 2 -.27 -.46 .69
4
Day 1 -.35 -.48 .74
Day 2 .16 .41 .80
5
Day 1 -.23 .17 .73
Day 2 .69 -.25 -.30
Correlations between the wrist and forearm during OL are rather high ranging between R = .59 up to R = .99. All correlations are above .60 with just three exceptions that were lower or negative. Wrist and forearm recordings for subject 2 on day 2 with R = -.61, and for subject 5 on day 2 with R = -.30 were negative correlated.
36 Figure 3.5.2. EDA waveforms during actual performance and observational learning, obtained from the wrist.
3.6 Motion artifacts
[image:36.595.71.521.70.270.2]37 between 0.81 – 1.00. A 2x2 Chi-square test was carried out with condition as independent and artifact as dependent variable. Scores from the first rater were used for calculation. A significant difference was found between the two sensor locations concerning motion artifacts with χ2 = 6.5 and p = .011. The wrist showed significant more motion artifacts than the forearm did.
Table 3.2.5
Cross tabulation for the number of motion artifacts found in each condition (wirst, forearm). Artifacts
No Yes Total
Condition
wrist 1 12 13
forearm 7 6 13
38
4. Discussion
The purpose of this study was to analyze EDA patterns during two different conditions – actual performance and observational learning, of a balance beam routine. The assumption made in hypothesis 1, was that SCR quantity would not differ between AP and OL of a beam routine. The results are not in line with the hypothesis, showing significant more SCR`s during the actually performed routine than during observational learning. The height of the beam can elicit stress and the intense movements that occur in the AP can be accounted responsible for more SCR. Many factors interact that could influence arousal in the AP condition. Being filmed is unusual for most of the gymnasts and can result in more excitement. Getting observed by other gymnasts and research assistants can further impact the gymnast’s arousal. Gymnasts could additionally be distracted by noise in the gym or by distracting thoughts concerning the unfamiliar situation. The OL condition in turn is much more controlled and resembles a closed setting by what external influences can be excluded. Stressors as the height of the beam, distracting noises from the gym, videotaping and observation by others are excluded during OL. Moreover, no movements are comprised in the OL condition resulting in lower thermal sweat gland activity. In turn, new stressors that are unique for the OL condition can elicit arousal patterns that can be held responsible for event unrelated SCR as well. Observing one’s own routine and evaluating on it can be unusual for gymnasts, causing tension that can be translated to higher arousal. Even though a different quantity of SCR is found in both conditions, no overlap of the SCR`s can be concluded yet. An uneven number of SCR during both conditions does not mean that none of the SCR`s are elicited by the same stimulus, as e.g. a particular element on the beam. To examine if both conditions elicit at least some SCR`s that can be due to excitement of an element, correlations were calculated and EDA waveforms were plotted. Before discussing those results, a deeper look will be taken on the mean amplitude of SCR.
39 performing the routine. These results are in contrast with conclusions by Olsson et al. (2007), claiming that fears that are observed can be compared in power to fears that were experienced actively. SCR quantity and amplitude was lower during OL, therefore it can be assumed that observing a stimulus elicits not evenly strong arousal as when actual performance took place. But still, the results of this study confirm findings made by Poh et al. (2010), that it is in fact possible to measure increases in EDA during a cognitive- as well as a physical intense task. Even if SCR patterns differ in quantity and amplitude, it cannot be concluded yet, that there is no overlap in SCR during both conditions. SCR quantity can be lower due to less intense experimental circumstances in OL, but when it occurs at the same time in both conditions it could still be elicited by the same elements of the beam routine.
[image:39.595.151.469.425.708.2]To analyze whether SCR`s are elicited by the same stimulus as for example a difficult dismount on the beam, correlations between AP and OL were calculated and EDA waveforms were plotted. Correlations between AP and OL were rather low and sometimes even negative. When looking at the EDA waveforms in turn, it becomes obvious that correlations are not telling the whole story. Despite low correlations, EDA waveforms show the same tendencies in both conditions. EDA recordings of subject 5 during day 1 and 2 obtained from the wrist during AP and OL will be used as an example to explain the low correlation which appears arbitrary when looking at EDA waveforms (Figure 4.1).
41 OL can modify thoughts and emotions in sports (McCullagh & Weiss, 2002; Ives et al., 2002) is a causal relationship and was not tested in this study. Therefore no implications can be given concerning the effect of OL on AP. But this study tested the feasibility of EDA as mean to measure arousal, and succeeded in validating it as a tool to test assumptions concerning casual relationships as positive effects of OL on arousal levels in AP. EDA can be used to explore arousal patterns during both AP and OL and can assist to answer and validate conclusions drawn by Cumming et al., (2005) that OL helps to regulate arousal and other mental states in sports. Whether arousal was actually regulated by the means of OL was beyond the scope of this study. Much more research as e.g. in form of fMRI studies is needed to further analyze this issue before drawing strong conclusions. The results cannot give implication concerning the questions whether gymnasts revive their routine during OL. This assumption cannot be accepted nor excluded, because similar waveforms indicate some interrelation. To examine this similarity in arousal during AP and OL requires more precise statistical methods. The fact that similar patterns were not found for all gymnasts illustrates the vulnerability of EDA to individual differences. Given the fact that arbitrary results are found, much more research concerning this issue is needed.
Another aim of this study was to examine which anatomical location is best to measure EDA. The assumption made in sub-hypothesis 1, was that EDA recordings of the Affectiva Q™ Sensors attached to the wrist show a higher SCR’s quantity compared to EDA recordings of the sensor attached to the forearm. And the assumption made in sub-hypothesis 2, was that recordings of the Affectiva Q™ Sensors attached to the ventral forearm have lower average SCR amplitude compared to the sensor attached to the wrist. The results obtained in this study are not in line with both assumptions. During AP no difference in mean number of SCR and mean amplitude of SCR were found between the two sensor locations. These findings reveal that both sensors are equal in sensitivity to changes in skin conductance responses during AP. The findings obtained from one participant during the pilot study, showing difference in skin conductance level (SCR), cannot be confirmed. The difference in eccrine sweat gland activity with 225 mean density/cm² for the forearm, and (380) mean density/cm² for the wrist (Worret & Gehring, 2003) seems to have no influence on arousal measured during physical exercise. More sweat secretion during physical exercise could explain why lower eccrine sweat gland density on the arm had no effect on conductance.
42 Despite low correlations, EDA waveforms show that both sensors measured an comparable number of higher SCR`s around the same time, sometimes with some delay. As explained earlier, correlations were found to be vulnerable to different SCR quantities and amplitudes as well as to shifts in time. Mistakes in synchronizing both sensors of just a second can result in low correlations as explained before. Pearson correlation as method to compare physiological arousal in terms of EDA, is too precise for complex physiological data as EDA. Another reason for low correlations between the sensors can be due to extreme high thermal sweat gland activity during the actual beam performance. Actually, using the wrong method can be argued to be the reason for arbitrary results. Correlation analysis can be argued to be the wrong tool to measure arousal in this case, given the fact that ANOVA found no significant differences between both sensors for amplitude and SCR quantity. Given the fact that both sensor locations were identical sensible to SCR quantity and amplitude, it is difficult to draw a conclusion which sensor condition is more appropriate. Motion artifacts will be taken into consideration later on, to assist in answering this question.
Pearson correlations were also calculated to compare recordings taken from the wrist and forearm during the first OL trial. The results indicate that EDA patterns showed much higher correlations when measured during a cognitive task instead of a physical task. Both sensors showed comparable EDA waveforms and had much higher correlation than during AP. It can be concluded though that sensor location does not matter during OL or a comparable cognitive task. Absence of motion and therefore less thermal sweating during AP can result in more proper recordings and can be accounted responsible for higher correlations. When EDA measurement is supposed to take place during physical activity, it depends on other aspects as motion artifacts as well, which sensor location to choose.
43 either. The forearm seems to be less vulnerable to motion from the elbow joint than the wrist is to the wrist joint. The forearm therefore has been found to offer a more accurate location for EDA measurement during physical performance with extreme hogging moments, compared to the sensor attached to the wrist, given the fact that mean number of SCR and amplitude does not differ significantly and that waveforms show comparable tendencies.
Despite the fact that mean volume density of eccrine sweat glands differ just slightly between wrist and hand-palm, several authors concluded higher sensitivity and therefore better skin conductance when EDA was measured at the palm compared to the forearm (Poh et al., 2010; Picard et al., n.d.). The assumption made in sub-hypothesis 4, was that recordings of the Affectiva Q™ Sensors attached to the palm (during the last OL condition) will show more SCR`s during OL than when attached to the wrist or forearm. Hypothesis 5, assumed that recordings of the Affectiva Q™ Sensors attached to the palm (during the last OL phase) show higher SCR amplitudes during OL than when attached to the wrist or forearm. The results are in line with both hypotheses. During OL, more mean SCR`s and higher mean amplitudes were found when EDA was recorded from the palm, compared to the recordings from the forearm and wrist. No difference in mean number of SCR was found between the forearm and wrist. These findings are in line with other studies, reporting higher sensitivity of the hand-palm (Poh et al., 2010; Picard et al., n.d.). Because of less thermal sweating due to the absence of physical exercise, the difference of sweat gland activity could be more significant in such a cognitive task and less significant during AP. The palm was found to have a higher eccrine sweat gland density compared to the arm. One implication is to measure EDA on the palm if practical circumstances and the nature of the task allow it because the threshold to capture skin conductance during a cognitive task seems to be lower for the palm. This study reveals that mean number and amplitude of SCR were lower during a cognitive task than during a physical task (OL and AP). Therefore it would be better to use sensors that can be attached to the palm for conditions that aim to measure EDA of a cognitive task, given the fact that the hand-palm seems to be more sensitive compared to other body parts. And to measure EDA by sensors attached to the forearm during physical exercise, because of less motion artifacts and equal sensitivity compared to the wrist.