Measuring Performance as a
Dependent Variable of
Patent Management
Maturity
R
. Hilarius
Measuring Performance as a Dependent Variable of Patent Management
Maturity
R. Hilariusa
aUniversiteit Twente, Drienerlolaan 5, 7522 NB, Enschede, Netherlands
Abstract
In this article the effect of the Strategic Patent Management Maturity will be assessed by using the patent h-index. The author will start by discussing the typology for assessing the strategic patent management maturity. In detail the attributed function Liability will be discussed regarding the results from the case-study and an alternative implementation is proposed. Next the similarities and differences of inventing and innovating are discussed because these concepts are often applied incorrectly. While the correct use can be of importance to make essential differences clear. To asses the Strategic Patent Management Maturity using patents, different options are discussed regarding the quantity and quality of patents. The patent h-index is chosen as the best indicator representing the inventive impact of an organizations patent portfolio. Because of the strong influence of sectoral differences on the propensity to patent of an organization and the representation of the patent portfolio as sample of inventive output, the use of propensity to patent as intervening variable is discussed. The operationalization of the used indicators is discussed and the determination of the h-index is worked out, using the biopharmaceutical and biotechnological companies from van Reekum’s pilot and case study. We conclude by discussing the found results.
Keywords: Invention, Innovation, Patent Management Maturity, h-index, Patent, Propensity to Patent
1. introduction
In this article I attempt to make a contribution to the Strategic Patent Management typology de-veloped by van Reekum. Following the results from Kern and van Reekum (2012), i will suggest a dif-ferent and more general approach for the liability attribute of patents. Using this typology as my start-ing point I will build a conceptual model and use insights from the field of scientometrics to suggest an independent variable to measure performance differences between the four categories as developed by van Reekum.
2. A typology for assessing strategic patent management maturity
Based on Ackoff’s categories of strategic planning attitudes (Ackoff, 1981), Kern and van Reekum de-veloped four attitudes that are applicable in the
Email address: [email protected](R. Hilarius)
strategic patent management practice. In his book Ackoff develops four categories based on the atti-tudes towards planning. He develops them by look-ing at the distinctive differences of their temporal orientation and planning posture, see table 1 (Ackoff, 1981, p. 52-65).
Temporal Orientation Types of planning
Reactive Past Tactical
Inactive Present Operational
Preactive Future Strategic
[image:3.595.148.447.114.188.2]Interactive (Proactive) All Normative
Table 1: Ackoff’s categories of strategic planning attitudes
are summarized in table 2 and will not be discussed in detail here. When looking at the four different attitudes and their eight functions one has to realize that their borders are not absolute. What Ackoff says about his planning orientations can also be regarded in this case: “The four basic planning ori-entations are like the primary colors; they seldom appear in their pure form. Most of the planning we see, like colors, are mixtures; nevertheless, they are usually dominated by one of the four pure types.” (Ackoff, 1981, p. 53)
From the pilot study performed by Kern and van Reekum the relevance of seven of the eight functions were confirmed, leaving liability unconfirmed. In their article Kern and van Reekum discuss this and note that the financial meaning of patent liability is not applicable in the Netherlands because the Dutch tax policy prohibits sale & lease-back constructions with patents (Hulsink and Schenk, 2002). However, patent liability in the sense of its legal meaning, the consequence of infringement, is still of importance. With the experience gained from the pilot and case study the liability function is going to be developed in an alternative way.
2.1. Liability
In van Reekum’s typology, liability is considered to be ambiguous, taking into account it’s financial as well as its legal meaning. In the Pilot study con-ducted the financial aspect of this function was not confirmed. Presumably because the applied defi-nition was not applicable in the Netherlands. We depart from van Reekums elaboration and take a different approach to this function. The foundations for the new approach are the concepts of Freedom to Operate (FtO) and Liability of Newness (LoN). Freedom to Operate is not new in the field of intel-lectual property. It essentially denotes the (legal) freedom one has before risking infringement. Or as Sandal and Kumar put it: “FTO is essentially a legal concept, which connotes absence of any third
party valid intellectual property right (IPR) claims against a particular commercial operation” (Sandal and Kumar, 2011, p. 204). To determine the FtO, a prior art search has to be carried out. This may be done for various reasons; determining the patentabil-ity of an invention, ground of patent invalidation or possibility to proceed with the research, develop-ment and/or commercial production, marketing or use of a new product or process. (Sandal and Ku-mar, 2011) The results of this FtO analysis should make clear if there is a liability or an opportunity.
The second concept used to elaborate on liability is Liability of Newness (LoN). Generally this concept is used as introduced by Stinchcombe (1965), to de-scribe a greater mortality risk of new organizations compared to established organizations. However this concept can be applied to inventions instead of organizations, essentially describing aspects of the liability function. The notion here is that an invention carries inherent risks. It starts with the question if an invention has the potential to become an innovation and if so, if it can be patented or otherwise protected. Any technology that has been developed to this point already needed a certain amount of effort (time, money, R&D). This initial investment constitutes the inherent technological risk of an invention. To further illustrate this, the concepts of incremental and radical innovation can be considered. The framework these concepts are part of consists of two dimensions where innovation can find place. It also assesses different, not always controllable, forces that influence the possible suc-cess of the innovation, or to put it differently, the risks there are of an invention becoming an innova-tion.
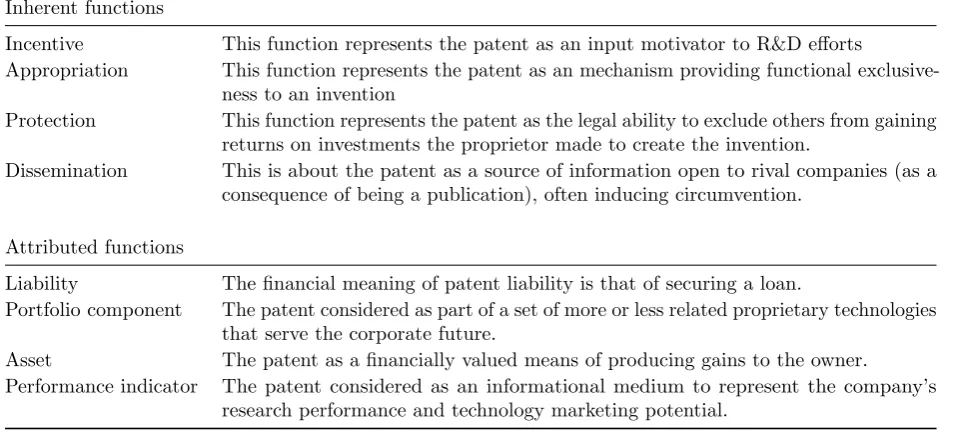
Inherent functions
Incentive This function represents the patent as an input motivator to R&D efforts
Appropriation This function represents the patent as an mechanism providing functional exclusive-ness to an invention
Protection This function represents the patent as the legal ability to exclude others from gaining returns on investments the proprietor made to create the invention.
Dissemination This is about the patent as a source of information open to rival companies (as a consequence of being a publication), often inducing circumvention.
Attributed functions
Liability The financial meaning of patent liability is that of securing a loan.
Portfolio component The patent considered as part of a set of more or less related proprietary technologies that serve the corporate future.
Asset The patent as a financially valued means of producing gains to the owner.
[image:4.595.62.539.117.335.2]Performance indicator The patent considered as an informational medium to represent the company’s research performance and technology marketing potential.
Table 2: Patent functions. Kern and van Reekum (2012)
pilot study is because it is prohibited by Dutch pol-icy. Internationally however this practice is reality and thus it needs to be included.
Now that the liability function is explained in a broader scope to cover all the aspects, it is necessary to operationalize this to the four attitudes of the typology, see table 3.
3. Invention or innovation?
With the adjustments done to the strategic patent management attributes by reevaluating the Liabil-ity function we now have a complete framework to use as an independent variable for evaluating a firm’s attitude regarding patent management. To do more than merely categorize firms, it is necessary to develop a dependent variable. Although scholars have written a lot about a firms performance, in most cases financial performance, there is not much written about the performance of a firms Intellec-tual Property Management (IPM). There is no such thing as a generally accepted way to measure the ef-fectiveness of a firms IPM. Therefore it is necessary to develop our own performance variable.
We start by making clear what we mean when talking about inventions and innovations. When dis-cussing patent management and performance, often the terms invention and innovation are concerned. In practice the difference between inventing and in-novating is often unclear and the words are used as
synonyms. It even went so far that innovation be-came a buzzword, used by managers (and everyone else) for everything that was even remotely new (to them). In our discussion the difference between an invention and innovation is however very important.
As starting point we use the definition used by Tidd et al. (2005). Tidd describes that inventing is only the beginning in the innovation process, there are enough good ideas available but only a few of them become true innovations. The step from in-vention to innovation is by no means automatic, as already discussed by Maclaurin (1953). For ex-ample: Often researchers are great inventors but, more often than not, poor innovators. Or to use an example from Tidd: “Edison appreciated bet-ter than most that the real challenge in innovation was not invention –coming up with good ideas –but making them work technically and commercially.” (Tidd et al., 2005, p. 65). Regarding innovation, R&D and marketing are two sides of the same coin. In addition it is worth mentioning that the size of the invention (the technological leap forward) is not necessarily proportional to the size of the innova-tion. An incremental improvement of a product may become a big innovation and a revolutionary new product may never sell a single unit. Inventing and innovating both can be done in incremental to radical proportions.
Inactive Reactive Active Pro-active
FtO: When infringement is claimed the activities are stopped and/or the litigation is re-solved by settlement.
An FtO is conducted after infringement is claimed to prevent fu-ture litigation.
A FtO search is done. When (possible) in-fringement is found the problem is circum-vented or the project canceled.
A FtO search is done. When (possible) in-fringement is found, circumvention is an option as well as ac-quiring a license or patent.
LoN: R&D in new prod-ucts is avoided. The organizations efforts are aimed at improv-ing and evolvimprov-ing the proven products.
R&D for new prod-ucts is started when technological rivalry is assessed on the basis of patent info
Alternatives assessed before investing
Initial (R&D) costs are seen as invest-ments, not as costs. The (strategic) devel-opment of new prod-ucts is done according the product life-cycle.
Financial: Does not use a patent as collateral to obtain a loan.
The patent(portfolio) is valuated, but is not used as collateral
On request of a fi-nancier a patent is used to obtain a loan. (exclusively)
[image:5.595.65.532.134.386.2]The organization uses a patent to obtain a loan. (exclusively)
Table 3: Liability in the typology
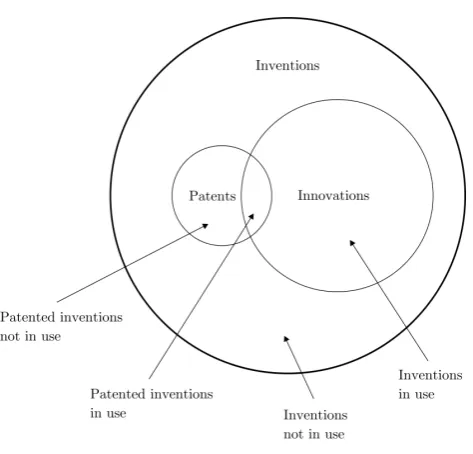
[image:5.595.181.418.447.674.2]of this subject by Maclaurin (1953), Basberg (1987) represents this graphically as can be seen in figure 1. Patented inventions and innovations only make up a small part of all inventions and patented innova-tions an even smaller part. Besides the relainnova-tionship between inventions, innovations and patents, figure 1 tries to make clear that the use of patent statistics rests on the assumption that they are somehow re-flecting inventive and innovative activity (Basberg, 1987).
4. Quantity and Quality
Now we have clarified the distinction between in-ventions and innovations we are going to continue with patents and performance. For many years schol-ars analyzed patent data in an attempt to make predictions based on it, or otherwise learn and draw conclusions from it. Patent law and thus patents came into existence with the purpose to give an inventor an exclusive right to commercialize its in-vention during a limited time. This is of importance because it stimulates to invest in the development of new ideas. The thought being that if everyone could simply copy a successful idea, no one would want to invest in development any more. This basic principle makes clear why patents are an intermedi-ate product of inventions with potential. Because of this it is plausible to assume patents contains information from the creative processes going on in firms, organizations or persons. However a re-lationship between patents and a firm’s (financial) performance is not as obvious as one may think. In his article, Holger Ernst states the following: “On the firm level in particular, the question of whether there is a correlation between patents and financial performance remains unresolved” He adds: “Some empirical studies — recent ones, in particular — es-tablish a positive correlation between a firms patent situation and its competitive position,” Finally in his conclusion he states: “From a theoretical point of view with regard to further empirical patent re-search, we were able to show in addition to the findings of previous cross-section analyses a pos-itive correlation between patent applications and subsequent changes in economic performance vari-ables on the firm level” (Holger, 2001). From this we can conclude that patents may not be directly correlated to a firms financial performance, but they do seem to be able to comprise some kind of perfor-mance. So for what are patents a suitable indicator?
In essence patents are an intermediate product re-sulting from inventive activities. This makes them inherently more suitable to asses these inventive activities than innovation. The process in which an invention becomes an innovation depends on far more than a firms IPM, which does govern the con-ditions regarding inventing and patent awareness.
As our starting point we are going to look at the article from Hagedoorn and Cloodt (2003). In this article, Hagedoorn and Cloodt discuss several in-dicators used to measure innovative performance and what the added value is in using more than one indicator. Interesting for us is that in relation to in-novative performance they also discuss the concept of inventive performance. In their article they state the following: “We define inventive performance as the achievements of companies in terms of ideas, sketches, models of new devices, products, processes and systems. As discussed below, inventive per-formance is frequently measured in the context of patents where both raw counts of patents and patent citations are taken as the actual measures.” (Hage-doorn and Cloodt, 2003, p.1366). Further on they additionally state: “Innovative performance in the narrow sense refers to results for companies in terms of the degree to which they actually introduce inven-tion into the market, i.e. their rate of introducinven-tion of new products, new process systems or new de-vices.” (Hagedoorn and Cloodt, 2003, p.1367). This corresponds with the distinction we made above between invention and innovation. Farther in their article Hagedoorn and Cloodt discuss the differences and overlap between inventive and innovative per-formance and they conclude with the discussion and testing of single versus multiple indicators regarding innovative performance.
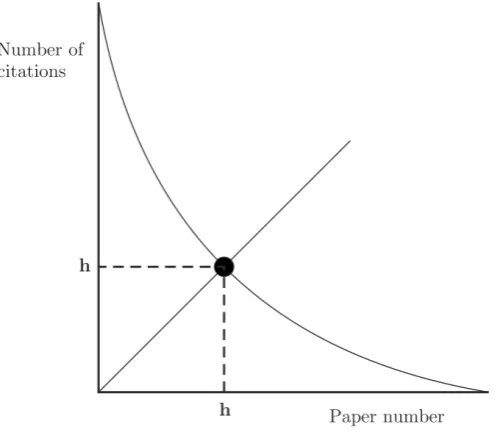
Figure 2: Schematic curve of number of citations versus paper number, with papers numbered in order of decreasing citations. The intersection of the 45◦line with the curve gives h. The total number of citations is the area under the curve. Hirsch (2005)
purpose.
One of the problems when using patents to asses performance is that the quantity of patents is only relevant in regard to their quality. The problem with poor patents is that they do not offer the intended protection, they are easily circumvented or do not hold up in court. Because of this, the patent is worthless and it only costs money. To control for this, the quality of a patent needs to be included in the evaluation of a patent portfolio.
Another principle of patents is the idea of Quid pro quo, meaning that you do not get anything for nothing. The idea behind this is that although an inventor gets an exclusive right to commercialize his invention, the invention does get published. As a result, anyone can see the invention, but they are prohibited to exploit it commercially. They can however build upon or circumvent it. This results in that pivotal patents are used as a starting point for other inventions that may lead to a patent. In the article of Harhoff et al. (1999) they use citations as a measuring instrument in an attempt to learn something about the value of patented inventions. Depending on national practice, citations are placed in the patent text to show how it is different from the prior art. Harhoff et al. (1999) al state: “For one, it is reasonable to suppose that the prior inventions cited in new patents tend to be the relatively impor-tant precursors that best define the state of the art.”
And: “Second, because prior inventions set the stage for new inventions, citations are used to measure a potentially important economic externality, i.e., the impact the knowledge embodied in prior inventions has in stimulation new contributions.” (Harhoff et al., 1999, p. 511). Although Harhoff et al. (1999) continue to research the causality between citation frequency and the value of patented inventions, it is reasonable to assume that if patents are more frequently cited the inventions are more important.
The field that analysis publications is called bib-liometrics and when it is specifically concerning scientific literature, it is called scientometrics. One of the subjects they are engaged in is the analysis of scientific publications to asses the productivity, qual-ity and impact of publications and scholars. The analysis of patents and citations is quite analogue to this and that is why we looked for some insights and indicators in this field. One interesting index that measures the productivity and impact from scholars is the Hirsch-index (h-index). The h-index is proposed by Hirsch (2005) as a particularly simple and useful way to characterize the scientific output of a researcher. The h-index is defined as followed: A scientist has index h if h of his or herNp papers
have at least h citations each and the other (Np−h)
and a quality indicator into a single comparable value. Hirsch developed the h-index to character-ize scientific output of researches however it can also be used to analyze the impact of an organiza-tions patent portfolio as been showed by Guan and Gao (2009) in his article;Exploring the h-index at patent level. In the article Guan applies the h-index to patents where the patent h-index is defined as follows: For a general group of patents h is such that h patents received at least h citations from later patents, while other patents received no more than h citations. Only patent to patent citations are counted, non-patent references (NPR) are not regarded. This is because a citation from another patent can be seen as a ”vote” from the referenc-ing patent to the referred patent, as such NPR can be seen as votes for oneself. Guan compares the patent h-index to other technological indicators and concludes the following: “this confirms that on one hand, similar to citation counts, the patent h-index does reflect the importance or impact of patents; on the other hand, unlike citation counts, the patent h-index balances the quantity (number of patents) and the quality (citations) of patents for an assignee in a reasonable way. In summary, the above findings show that the patent h-index is indeed an effective indicator for evaluating the technological impact or quality of an entity.”. The patent h-index thus is a suitable performance indicator to asses the inventive impact of an organizations patent portfolio.
5. Propensity to Patent
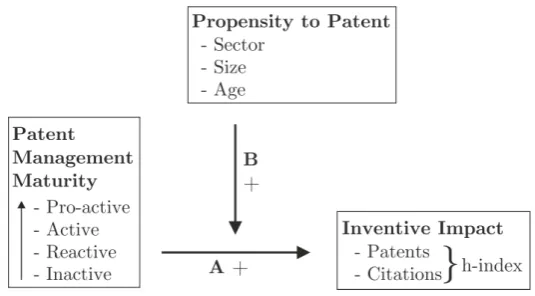
For a performance indicator to have any meaning it is necessary that it is compared to the perfor-mance indicator of other organizations. This way we can attempt to analyse the characteristics that lead to the difference in performance. The frame-work created in this article with the patent maturity typology as independent variable and patent h-index as dependent variable works in the same way. A higher score on the patent h-index is expected for more mature and active organizations (figure 3). When comparing the PMM and patent h-index of organizations, we hope to explain the differences in their patent h-index score by the differences in their PMM. The connecting element between these variables are the patents. With a higher PMM score we expect the patent output to rise in quantity and quality, leading to a higher patent h-index. In this case the patents are regarded as a sample of the in-ventive output of the organization. When doing this
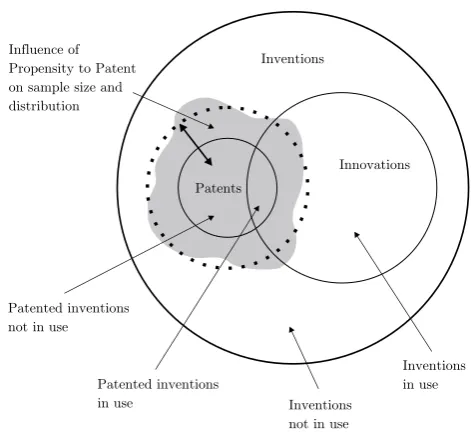
the assumption is made that patents are a represen-tative sample of the inventive output. The question arises if this assumption can be made and can be generalized to other organizations. Unfortunately, most likely this is not the case. When we look to the literature regarding the use of patent statistics, different variables are discussed that could cause a bias. These variables will have, direct or indirect, an influence on the Propensity to Patent (P2P) of an organization. In essence this means that the size and composition of the patent portfolio will vary between organizations. figure 4.
Propensity to patent is not a new concept, Scherer (1965) already used it to describe the limitations of counting patents for an inventive index. Scherer (1965) measured P2P by looking to the differences in patent output per unit of engineering input. A multitude of researchers use different definitions, applications and measurement methods. As might be expected it is difficult to compare the inventive impact of a mining company and a pharmaceutical company, largely because of the differences in the industry sector. We are going to use P2P as a construct that consists of uncontrollable external forces that influences the quantity and quality of the patents, most notably industry sector and firm size
The best way to evaluate the PMM s is to use a homogeneous sample; firms in the same industry and of approximately the same size. However this is not always possible or desirable for the researcher. When a heterogeneous sample cannot be avoided, P2P can be used as a intervening variable to correct for the differences.
6. Conceptual model
With the introduction of P2P we can now con-struct the complete model. In figure 5 there is an schematic overview of the conceptual model. The PMM is the independent variable with four modes, ranked ordinal. It has a direct positive effect on the inventive impact which is measured using the patent h-index. If necessary the P2P can be used as intervening variable, positively influencing the effect of PMM on the inventive index.
7. Operationalization
Figure 3: A possible course of the patent h-index related to the patent management maturity
Inventions
Innovations
Patents
Inventions in use Patented inventions
in use Inventions
not in use Patented inventions
not in use Influence of Propensity to Patent on sample size and distribution
[image:9.595.180.416.452.669.2]Figure 5: Conceptueel model.
the PMM needs to be established. This will be done by using a questionnaire, as has been done by Kern and van Reekum (2012).
Secondly it needs to be established if we are work-ing with a homogeneous or heterogeneous sample. When it is the latter it will be necessary to establish the P2P rates of the sample organizations and their industry sectors. Because of the sector wide infor-mation needed it is unpractical to do a own survey for this, however existing surveys exist that report some results regarding the P2P. Good examples are the research of Arundel and Kabla (1998) using the MERIT/SESSI data and the research of Brouwer and Kleinknecht (1999) using the CIS micro data.
At last the patent h-index needs to be determined. This can be done by using the Derwent Innovation Index as has been done by Guan and Gao (2009). We will elaborate on the gathering of this data.
7.1. Derwent Innovation Index
The Derwent Innovation Index is accessible as an on-line database through web of knowledge from Thomson Reuters. It covers 40 worldwide patent issuing authorities covering over 14.3 million inven-tions dating back to 1963. Using the Derwent Inno-vation Index and the instructions from Guan and Gao (2009) it is simple to determine the patent h-index of an assignee. All the patents of an assignee during a given time span can be retrieved up to the date of accessing the database. These patents can be sorted according to the number of citations they have, making it possible to find the patent h-index of the portfolio. Alternatively this list can be plotted together with a 45◦ line (y=x) in a graph. The intersection between the two marks the patent
h-index score, rounded down to the lowest integer. An example of such a plot can be seen in figure 6.
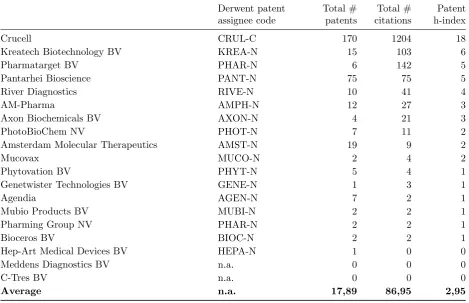
Using the Derwent Innovation index we deter-mined the h-index of the 19 biotechnological and biopharmaceutical organizations that where the sub-ject of the pilot and case study of van Reekum (1999). In table 4 the patent h-index is shown accompanied by the total number of patents and citations.
8. Discussion
Figure 6: Determining the patent h-index graphically.
Derwent patent assignee code
Total # patents
Total # citations
Patent h-index
Crucell CRUL-C 170 1204 18
Kreatech Biotechnology BV KREA-N 15 103 6
Pharmatarget BV PHAR-N 6 142 5
Pantarhei Bioscience PANT-N 75 75 5
River Diagnostics RIVE-N 10 41 4
AM-Pharma AMPH-N 12 27 3
Axon Biochemicals BV AXON-N 4 21 3
PhotoBioChem NV PHOT-N 7 11 2
Amsterdam Molecular Therapeutics AMST-N 19 9 2
Mucovax MUCO-N 2 4 2
Phytovation BV PHYT-N 5 4 1
Genetwister Technologies BV GENE-N 1 3 1
Agendia AGEN-N 7 2 1
Mubio Products BV MUBI-N 2 2 1
Pharming Group NV PHAR-N 2 2 1
Bioceros BV BIOC-N 2 2 1
Hep-Art Medical Devices BV HEPA-N 1 0 0
Meddens Diagnostics BV n.a. 0 0 0
C-Tres BV n.a. 0 0 0
Average n.a. 17,89 86,95 2,95
[image:11.595.64.534.400.703.2]4 we can also conclude that the patent h-index has distinctive properties compared to counting patents and/or citations, because as table 4 clearly shows, the most patents and/or citations do not directly translate to the highest h-index. Additionally it also accentuates the differences between portfolio’s of approximately the same size.
One of the biggest problems in research where patent data is used as measurement, is that the researcher makes reservations on the use of patents as data, but still continues using the data as if real reservations had not been made (Basberg, 1987). The use of patents as data has inherent weaknesses we have to account for, using the patent h-index may be a good way to remedy some of this issues. Nevertheless, what Schmookler wrote in 1966 still is very true: “We have a choice of using patent data cautiously and learning what we can from them, or not using them and learning nothing about what they alone can teach us (Schmookler, 1966, p. 56).”
References
Ackoff, R. L. (1981).Creating the corporate future : plan or be planned for. Wiley, New York.
Arundel, A. and Kabla, I. (1998). What percentage of inno-vations are patented? empirical estimates for European firms.Research Policy, 27(2):127–141.
Basberg, B. r. L. (1987). Patents and the measurement of technological change: A survey of the literature. Research Policy, 16(24):131–141.
Brouwer, E. and Kleinknecht, A. (1999). Innovative output, and a firm’s propensity to patent. An exploration of CIS micro data.Research Policy, 28(6):615–624.
Guan, J. C. and Gao, X. (2009). Exploring the h-index at patent level. Journal of the American Society for Information Science and Technology, 60(1):35–40. Hagedoorn, J. and Cloodt, M. (2003). Measuring
innova-tive performance: is there an advantage in using multiple indicators? Research Policy, 32(8):1365–1379.
Harhoff, D., Narin, F., Scherer, F. M., and Vopel, K. (1999). Citation frequency and the value of patented inventions.
Review of Economics and Statistics, 81(3):511–515. Hirsch, J. E. (2005). An index to quantify an individual’s
scientific research output. Proceedings of the National Academy of Sciences of the United States of America, 102(46):16569–16572.
Holger, E. (2001). Patent applications and subsequent changes of performance: evidence from time-series cross-section analyses on the firm level. Research Policy, 30(1):143–157.
Hulsink, W. and Schenk, H. (2002). 13 Privatisation and deregulation in the Netherlands. Privatization in the European Union: Theory and Policy Perspectives, page 242.
Kern, S. and van Reekum, R. (2012). The Use of Patents in Dutch Biopharmaceutical SME: a Typology for Assessing Strategic Patent Management Maturity.
Maclaurin, W. R. (1953). The sequence from invention to innovation and its relation to economic growth.The Quar-terly Journal of Economics, 67(1):97–111.
Sandal, N. and Kumar, A. (2011). Role of freedom to op-erate in business with proprietary products.Journals of Intellectual Property Rights, 16(2):204–209.
Scherer, F. M. (1965). Firm Size, Market Structure, Op-portunity, and the Output of Patented Inventions. The American Economic Review, 55(5):pp. 1097–1125. Schmookler, J. (1966). Invention and Economic Growth.
Camebridge.
Stinchcombe, A. (1965). Social Structure and Organziations. InHandbook of Organizations, chapter 4, pages 142–193. Rand McNally, Chicago.
Tidd, J., Bessant, J. R., and Pavitt, K. (2005). Manag-ing innovation : integratManag-ing technological, market and organizational change. Wiley, Hoboken, 3rd edition. van Reekum, A. H. (1999). Intellectual property and