http://www.scirp.org/journal/ojs ISSN Online: 2161-7198
ISSN Print: 2161-718X
DOI: 10.4236/ojs.2017.76069 Dec. 13, 2017 972 Open Journal of Statistics
Applying Multivariate Multilevel Models
to Explore Arable Land Quality in Sub-Saharan
Africa: A Case Study in Kenya
Davies D. Onduru
1*, Fred Onyango
21ETC East Africa, Yaya, Nairobi, Kenya
2School of Mathematics, Statistics and Actuarial Science, Maseno University, Private Bag, Maseno, Kenya
Abstract
Controversy exists on the magnitude and variability of farm nutrient balances and quality of arable land in sub-Saharan Africa with Kenya among those af-fected negatively. This study investigates quality of arable land by fitting mul-tivariate multilevel model to farm nutrient balance data collected from five agro-climatic zones of Kenya (arable lands). Objectives of the study were to investigate the magnitude and variability of Nitrogen, Phosphorus and Potas-sium (NPK) farm nutrient balances in arable lands of Kenya, study effects of agro-climatic zones on nutrient balances and to determine effects of house-hold resource endowments on NPK nutrient balances. The study concludes that agro-climatic zones differ with respect to farm nutrient balances; that li-vestock resource endowments and hired labour have positive effects on the magnitude and direction of farm nutrient balances; and that household own-ership of large capital resources do not guarantee a positive effect on farm nu-trient balances. The study recommends integration of sound livestock practices and application of agro-climatic zone differentiated interventions in future strategies for addressing farm nutrient balances and arable land quality, and the use of large sample sizes and relevant factors/covariates in future analysis to shed additional insights on farm nutrient balances and on how arable land qual-ity can be improved.
Keywords
Meta-Analysis, Multilevel Models, Nutrient Balance, Sub-Saharan Africa, Kenya
1. Introduction
Seminal studies conducted at national and regional levels in sub-Saharan Africa,
How to cite this paper: Onduru, D.D. and Onyango, F. (2017) Applying Multivariate Multilevel Models to Explore Arable Land Quality in Sub-Saharan Africa: A Case Study in Kenya. Open Journal of Statistics, 7, 972-987.
https://doi.org/10.4236/ojs.2017.76069 Received: October 29, 2017
Accepted: December 10, 2017 Published: December 13, 2017
Copyright © 2017 by authors and Scientific Research Publishing Inc. This work is licensed under the Creative Commons Attribution International License (CC BY 4.0).
DOI: 10.4236/ojs.2017.76069 973 Open Journal of Statistics
using nutrient balance approach, have indicated declining arable land quality with severe net nutrient losses of the order of 10 kg Nitrogen, 4 kg phosphates and 10 kg potash per hectare annually [1] with Kenya being one of the countries with net nutrient losses [1]. Empirical roots of nutrient balance studies are widely acknowledged [2]. However, opinions are divided on the extent and in-tensity of nutrient mining and variability; whether farmers’ achievements con-tradict nutrient depletion scenarios [3]; whether levels of nutrient mining differ by agroecological zones and land use systems; whether underlying factors exist to explain direction and magnitude of nutrient balances [4]; and how nutrient balances can be scaled-up.
One of the reasons why consensual accounts on nutrient balances remain in-tractable and illusive and at times anecdotal [5] is the limited use of rigorous sta-tistical techniques to i) handle dependency in data and to reduce biases asso-ciated with variance estimates and inflation of Type I error [6] [7], ii) to quantify between study variability [8] and iii) to handle multiple outcomes/effect sizes simultaneously [9]. Nutrient balance studies are inherently associated with my-riad challenges: inadequate systematic replication in space or in time [10], de-pendencies in multiple outcomes, multicollinearity in independent variables, non-homogeneity in data, and missing values, and inadequate application of sta-tistical techniques that can deal with nested or clustered data associated with such studies that use complex survey designs [11] [10]. This study explores ap-plication of multivariate multilevel models in a meta-analysis of nutrient bal-ances and thereby contributes to addressing the above challenges and controver-sies. Application of statistical procedures for meta-analysis was previously a do-main of the health Sector but has recently been adopted in other disciplines [12]. Meta-analysis statistical techniques have a potential to address challenges and controversies by pooling and analyzing multiple studies together thereby im-proving statistical power and reducing the likelihood of type II error (failure to determine a difference that truly exist); increasing precision of estimates [13]; relating outcome heterogeneity to explanatory covariates and factors, and iden-tifying large scale-patterns even when obscured by local factors, thereby mini-mizing the danger of over-extrapolation from single context-based studies [14].
DOI: 10.4236/ojs.2017.76069 974 Open Journal of Statistics
Classical meta-analysis that estimates model parameters in addition to within- and-between study variability (random effects model) [19] [20] has also been used in a meta-analysis of the effects of woody and herbaceous legumes on ma-ize yield in sub-Saharan Africa based on 94 studies from West, East and South-ern Africa and concluded that inorganic fertilisers gave better maize grain yield response than legume trees and green manures, natural fallows and unfertilized maize in that order; and that “global maize yield response to legumes was signif-icantly positive and higher than unfertilized maize and natural vegetation fal-lows” [21].
Current methods of meta-analysis, however, have several limitations [10] [11]: Inadequacies in modeling multiple outcomes simultaneously, in addressing de-pendencies in multiple outcomes (use incorrect standard errors), in dealing with non-linear correlations and non-homogeneity in data and in handling nested or clustered data [11], yet these challenges characterise nutrient balance studies where response variables (outcomes) are often multivariate and have dependen-cies. Furthermore, methods such as vote counting and sign tests have been dep-lored due to their low power and the fact that they ignore sample size and effect magnitude [22] while descriptive statistics do not provide a framework to ex-plore the effects of multiple covariates and factors on the dependent variables.
Possible approaches to modeling multiple outcomes of nutrient balances, tak-ing into account the above challenges, include: multivariate fixed and random effects models, structural equation models, and multilevel models for modeling primary data among others [23]. Although the fore-mentioned methods offer a potential in meta-analysis, they have not been applied to nutrient balance stu-dies. Further, the application of multivariate fixed and random effects models are constrained by limited availability of within-study correlation and variances for estimating the variance-covariance matrix required in the model when summary statistics are used in meta-analysis and when there are no individual participant data to estimate required variance-covariance matrix [23]. A “work- around” that has been proposed to estimate “missing” correlations in such situa-tions include the use of estimates from similar published work, conducting sen-sitivity analyses for possible ranges of correlations and the use of Bayesian hie-rarchical models with vague priors in a Markov Chain Monte Carlo (MCMC) framework among others [23].
In this study we demonstrate that multivariate multilevel models can be used in meta-analysis of farm nutrient balance data arising from complex surveys that involve multi-stage sampling, stratification and unequal sampling probabilities
relation-DOI: 10.4236/ojs.2017.76069 975 Open Journal of Statistics
ships between information at different levels of model hierarchies; and has abili-ty to improve estimation and predictions and to analyse repeated measures data among others [25].
This study uses individual participant data from multiple related cross-sectional surveys on nutrient balances from five different agro-ecological zones of Kenya to investigate the quality of arable land by estimating the magnitude and varia-bility of Nitrogen, Phosphorus and Potassium (NPK) nutrient balances, assess-ing whether agro-climatic zones differ with respect to NPK nutrient balances and determining the effects of household resource endowments on NPK nu-trient balances. To meet the research objectives, the study fitted a two-level mul-tilevel model (multivariate mulmul-tilevel model) with random intercept to farm nu-trient balance data in a meta-analysis that used Iterative Generalised Least Squares (IGLS), an equivalent maximum likelihood method [26] [27], to esti-mate model parameters as described in the R-package R2MLwiN.
2. Methodology
2.1. Dataset
NUTrient MONitoring (NUTMON) data is used in this study. NUTMON is part of on-going research to investigate land quality and sustainability of smallholder farming systems in the tropics. The data used comprise 14 separate studies, from 5 research initiatives that used NUTMON methodology in different agro-climatic zones of Kenya. A single research initiative working in “n” agro-climatic zones was considered to have “n” separate studies (where n = number of studies). Stu-dies which did not use multi-stage sampling to identify study participants were excluded from the analysis (on-farm and on-station experiments excluded).
The data comprised 349 observations (individual smallholder farm-households). About 42% and 25% of the smallholder farm-households in the dataset were from semi-humid to semi-arid (ACZ4), and semi-arid areas (ACZ5) of Kenya respectively. Farm households from humid (ACZ1), sub-humid (ACZ2) and semi-humid (ACZ3) areas accounted for 12%, 15% and 7% of total households in the dataset respectively. The arid (ACZ 6) and very arid (ACZ 7), with very low potential for plant production, were not represented in the dataset (Table 1).
The 349 observations have 3 dependent variables: N full balance (kg ha−1); P
full balance (kg ha−1); and K full balance (kg ha−1) and 18 selected independent
variables (factors/covariates). The latter were measured at two levels: 1) at level of individual farmers (household resource endowments); and 2) at agro-climatic zone level (Table 2).
2.2. General Analysis Methods
The study used the following general analysis methods:
DOI: 10.4236/ojs.2017.76069 976 Open Journal of Statistics
Table 1. Study areas in Kenya and number of observations (farm-households).
Study
acronym (ACZ1) Humid Sub-humid (ACZ2) Semi-humid (ACZ3) semi-arid (ACZ4) Semi-humid to Semi-arid (ACZ5) Total
ENSET INMASP LEINUTS NUTSAL VARINUTS Total
0 0 36
0 6 42
0 46
0 0 6 52
18 0 0 0 6 24
9 59
0 71
6 145
9 0 35 36 6 86
36 105
71 107
30 349
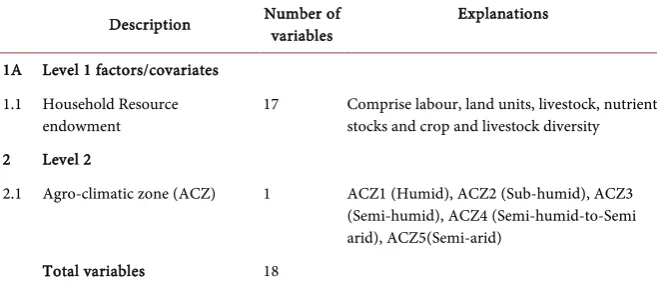
Table 2. Factors and covariates used as independent variables in this study.
Description Number of variables Explanations
1A Level 1 factors/covariates 1.1 Household Resource
endowment 17 Comprise labour, land units, livestock, nutrient stocks and crop and livestock diversity
2 Level 2
2.1 Agro-climatic zone (ACZ) 1 ACZ1 (Humid), ACZ2 (Sub-humid), ACZ3
(Semi-humid), ACZ4 (Semi-humid-to-Semi arid), ACZ5(Semi-arid)
Total variables 18
2) Based on (1) above, applied a two-level multi-level model (multivariate multi-level model) to:
Estimate an aggregate magnitude and variability of nutrient balances across agro-climatic zones that cover arable lands of Kenya;
Determine whether agro-climatic zones differ from each other in terms of NPK nutrient balances; and to
Identify the effects of household resource endowments on NPK nutrient bal-ances.
2.3. Determining Necessity of a Two-Level Multi-Level Model
(Multivariate Multilevel Model)
The study fitted a two-level multilevel model (multivariate multilevel model) without predictors (variance component model) to NUTMON dataset to deter-mine whether multilevel modeling was needed at all for this dataset. Intra-class correlation Coefficient (ICC) and Design effect were calculated to aid in model output interpretation.
The multilevel equations for the variance component model were specified as follows:
Level 1: yij =βoj+ij
Level 2: βoj =γoo+oj
[image:5.595.207.536.242.385.2]DOI: 10.4236/ojs.2017.76069 977 Open Journal of Statistics
level-1 equation, the model is:
ij oo oj ij
y =γ + + (1)
where:
ij
y = Individual response variable for ith farmer (level-1) in jth agro-climatic
zone;
oj
β = Random intercept for jth agro-climatic zone (mean of all individual
farmers in jth agroclimatic zone)
oo
γ = Random intercept for all j agro-climatic zones (grand mean of all js)
ij
= Residual effect (variation) for ith farmer around the mean of jth
agrocli-matic zone (random effect)
oj
= Residual effect (variation) for jth agro-climatic zone around the grand
mean (of all agro-climatic zones ie across all js)
( )
2~
0,
ij
N
σ
e
; 2e
σ
is the variance at individual farmer (level-1)( )
2~
0,
oj
N
σ
u
; 2u
σ
is the variance at agro-climatic zone (level-2)The study used Iterative Generalised Least Squares (IGLS) estimation algo-rithms in R2MLwiN package, to return estimates for random coefficients and their standard errors, estimates for deviance statistics and for variances and co-variances for single and two level models (Table 3).
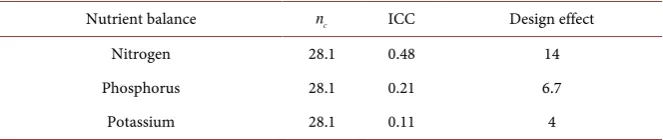
The study calculated Study Design Effect1 for the two level model as follows:
(
)
Design effect= +1 nc−1 ICC
[image:6.595.205.539.469.701.2]where:
Table 3. Two-level multilevel variance component model compared with a single level model (fixed part of the model).
2[1]*Level-structure
of the model Fixed part Coefficient Std. Err
95% Confidence Interval Lower
boundary boundary Upper
2[1]*Two-level
multilevel model Nitrogen balance −11.92 17.93 −47.06 23.22
Phosphorus balance 9.85 4.56 0.92 18.78
Potassium balance 5.47 6.29 −6.85 17.79
Deviance statistic 10,461
No. of observations 349
One-level model Nitrogen balance 2.57 4.37 −11.14 6
Phosphorus balance 9.72 1.77 6.25 13.2
Potassium balance 6.46 3.13 0.33 12.59
Deviance statistic 10,657.2
No. of observations 349
1Quantifies the effects of violating the assumption of independence on standard error estimates;
DOI: 10.4236/ojs.2017.76069 978 Open Journal of Statistics c
n = Average number of farmers per study; In this case (349/14) = 28.1
ICC = Intraclass correlation coefficient (at level 2); an estimate of proportion of variance at level-2
ICC at level-2 was estimated separately for Nitrogen, Phosphorus and Potas-sium farm nutrient balances using:
2
2 2
ICC u
e u
σ
σ σ
=
+ (2) where
2
e
σ
= Residual variance at level-12
u
σ
= residual variance at level-22 2
e u
σ
+
σ
= Total variance at level-2The design effects for each nutrient balance were greater than 2.0 (Table 4). Previous analysis has shown that a design effect greater than 2.0 indicates the need for multilevel modeling [28]. Thus, the preliminary analysis indicates that multilevel modeling is appropriate for this nutrient balance dataset and a two-level multilevel model (multivariate multilevel) is suitable for this purpose; and is therefore applied in subsequent analyses in line with the objectives of this study.
2.4. Estimating Magnitude and Variability of Nutrient Balances
To estimate an aggregate magnitude and variability of nutrient balances across agro-climatic zones of Kenya, the study used Equation (1), describing a variance component model. Iterative Generalised Least Squares (IGLS) in R2MLwiN package used to quantify the parameters of the model, returned parameter esti-mates shown in (Table 3), Section 2.3.
Similarly, variability of nutrient balances (heterogeneity) at level-1 and at level- 2 model hierarchy were estimated using Variance Partitioning Coeffcient (VPC)/Intra-class correlation coeffcient (ICC) using Equation (2) (see explana-tion in Secexplana-tion 2.3):
(
)
2( )
( )
( )
e 2 2 2 2
var
VPC ICC
var var
ij e
e u e u
σ
σ σ σ σ
= =
+ +
(3)
where
( )
2~
0,
ij
N
σ
e
; 2e
σ
is the variance at individual farmer (level-1)( )
2~
0,
oj
N
σ
u
; 2u
[image:7.595.207.539.635.705.2]σ
is the variance at agro-climatic zone (level-2)Table 4. Design effect for NPK nutrient balances.
Nutrient balance nc ICC Design effect
Nitrogen 28.1 0.48 14
Phosphorus 28.1 0.21 6.7
Potassium 28.1 0.11 4
c
DOI: 10.4236/ojs.2017.76069 979 Open Journal of Statistics
2.5. Determining Whether Agro-Climatic Zones Differ from Each
Other with Respect to NPK Nutrient Balances
To determine whether agro-climatic zones differ from each other with respect to nutrient balances, Equation (1) describing a variance component model was used. Parameter estimates were obtained in a similar way as in Section 2.3. The parameter estimates are presented in Table 3.
Further, in assessing whether agro-climatic zones differ from each other, the study determined whether the variance ( 2
u
σ
) of the random component of theintercept in Equation (1), oj, was different from zero. A 95% confidence
inter-val for the variance of oj was used to aid model output interpretation. Also, a
likelihood ratio test was conducted by comparing the deviances of a model with
oj
and one without oj to assess whether
2
u
σ
(variance at level-2:agrocli-matic zone) is significant. The null hypothesis for the latter was 2
0
u
σ
=
, so we do not need oj in the model (Ho: no agro-climatic zone variation or clustereffect exists and restricted or single model is “the true model”). Natural log used in Likelihood ratio test:
(
2 log
0) (
2 log
1)
0 1with 1 df
LR
= −
L
− −
L
=
D
−
D
where:
0 Likelihood value for a single level model ie without oj
L =
1 Likelihood value for a two-level model ie with oj
L =
0 Deviance statistics for a single level model- without oj
D =
1 Deviance statistic for a two-level model ie with oj
D =
The p-value associated with the Likelihood ratio (LR) test statistic was deter-mined from Chi Square distribution (with 1 degree of freedom).
2.6. Effects of Household Resource Endowments
on Nutrient Balances
The study fitted a two-level multilevel model (multivariate multilevel model) to NUTMON dataset to determine the effects of household resource endowments on NPK nutrient balances. The household resource endowments in Table 2 were added to the model as explanatory variables (in the fixed part of the model) and the intercepts at level-1 and level-2 model hierachy allowed to vary resulting in arandom intercept model. Slopes for the explanatory variables were not allowed to vary since they were fitted to the fixed part of the model only.
The multilevel equations for this model was specified as follows: Level 1: yij =
β
oj+β
kjXkij+ij, (for i=1, 2,3,,349; j=1, 2,3, 4,5;1, 2,3, ,18
k= )
Level 2:
β
oj =γ
oo+γ
onZonj+oj;β
kj =γ
koWritten in mixed model form by substitution of the level-2 equations into the level-1 equation, the model is:
ij oo on onj ko kij oj ij
DOI: 10.4236/ojs.2017.76069 980 Open Journal of Statistics
where at level-1:
ij
y = Individual response variable for ith farmer (level-1) in jth agro-climatic
zone;
oj
β = Random intercept for jth agro-climatic zone (mean of all individual
farmers in jth agroclimatic zone); each agro-climatic zone is assumed to have a
different intercept coeffcient, βoj
kij
x = A vector of k predictor variables for the ith farmer in jth agro-climatic
zone
kj
β
= A vector of k regression coeffcients associated with the predictor va-riables in jth agro-climatic zone:1 1
2 2
3 ; 3
ij j ij j ij j kij kj kij kj X X X x X β β β β β = = ij
= Residual effect (variation) for ith farmer in jth agro-climatic zone
where at level-2:
oo
γ = Random intercept for
all
five agro-climatic zones (grand mean of all j groups); The (βoj)s’ are considered to vary randomly around a grand mean ofall j groups (γoo) at level-2
onj
Z = A vector of n predictor variables measured at agro-climatic zone level
(level-2 or j-level)
on
γ = A vector of n regression coefficients associated with the predictor
va-riables at agro-climatic zone level (non-random coefficients):
1 1
2 2
3 3
0
;
o j o
o j o
o j
onj on o
nj on Z Z Z Z Z γ γ γ γ γ = = oj
= Residual effect (variation) for jth agro-climatic zone; ie the deviation of
the intercept of jth agro-climatic zone from overall intercept of all agro-climatic
zones (all js)
ko
γ = A vector of k (fixed) regression coefficients indicating that the coeffi-cients of Level-1 predictors (βkj) do not vary across agro-climatic zone level
(non-random slopes at level-2):
1 10 2 20 3 30 0 j j j hj kj k β γ β γ β β γ β γ = = hj
DOI: 10.4236/ojs.2017.76069 981 Open Journal of Statistics
are estimated as a single coefficient γh0 at level-2, for h=1, 2,3,,k ;
1, 2, 3, 4, 5
j=
3. Results and Discussion
3.1. Magnitude and Variability of Nutrient Balances
3.1.1. Magnitude and Direction of Nutrient BalancesThe two-level multilevel model (multivariate multilevel model) without predic-tors (variance component model) fitted to the dataset returned the mean NPK nutrient balances, see (Table 3). The mean nitrogen nutrient balance of −11.9 kg ha−1 (with 95% confidence interval: −47.0, 23.2) tended to corroborate results of
aggregate seminal studies that have reported negative (direction) nitrogen bal-ances at national level [1]. This further confirms that arable land quality in Kenya is being degraded through declining farm nitrogen, though the observed figure was not statistically significant (confidence interval includes zero). The mean aggregate phosphorus (9.8 kg ha−1; p < 0.01; 95% Confidence Interval of
0.9, 18.8) and potassium balances (5.5 kg ha−1; 95% Confidence Interval of −6.9,
17.8) were however positive contrary to seminal aggregate studies that reported negative nutrient balances at national level [2].
3.1.2. Variability of Nutrient Balances
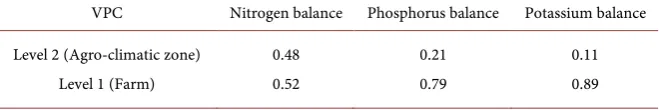
The Variance Partitioning coefficients (adjusted Intra-class correlation coeffei-cients) for NPK nutrient balances at different levels of model hierarchy are summarised in Table 5 while absolute values of variances and covariances are shown in Table 6.
For farm nitrogen nutrient balance, 48% of the variation lies between agro- climatic zones (between agro-climatic zone variability) while 52% of variation lie between farms. For each of the nutrient balances studied, a high proportion of total variation was from between-farm variability, 52%, 79% and 89% for nitro-gen, phosphorus and potassium respectively.
[image:10.595.209.539.667.722.2]Based on residual variances of each nutrient balance and covariances at level 1 (farm level; Table 3), the study observed high positive correlations between Ni-trogen and phosphorus nutrient balances (r = 0.8), NiNi-trogen and potassium nu-trient balances (r = 0.82) and moderate correlations between phosphorus and potassium nutrient balances (r = 0.68). These results imply a high dependence between effect sizes at level 1 of the study, dependence that cannot be ignored during analysis. Similarly at level 2, the study observed high dependence be-tween variables as measured by correlations: Nitrogen-phosphorus (r = 0.75),
Table 5. Variance partitioning coefficient/Intra-class correlation coeffients for NPK nu-trient balances.
VPC Nitrogen balance Phosphorus balance Potassium balance
Level 2 (Agro-climatic zone) Level 1 (Farm)
0.48 0.52
0.21 0.79
DOI: 10.4236/ojs.2017.76069 982 Open Journal of Statistics
Table 6. Two-level multilevel variance component model compared with a single level model (random part of the model).
Random effects parameters Coeffients Standard error [95% Conf. Interval]
Agro-climatic zone (Level-2) Var Nitrogen Cov Nitrogen-Phosphorus Var Phosphrus Cov Nitrogen-Potassium Cov Phosphorus-Potassium Var Potassium Farms (Level-1) Var Nitrogen Cov Nitrogen-Phosphorus Var Phosphrus Cov Nitrogen-Potassium Cov Phosphorus-Potassium Var Potassium 4462.54 779.81 244.42 1175.58 291.61 408.43 4927.10 1689.60 901.30 3215.90 1151.30 3149.10 1763.88 392.18 112.36 564.17 144.99 212.66 380.90 147.70 69.70 277.70 111.40 242.70 1005.33 11.13 24.19 69.8 7.44 -8.38 4180.50 1400.20 764.80 2671.70 932.80 2673.30 7919.74 1548.49 464.65 2281.36 575.79 825.24 5673.70 1979.00 1037.90 3760.10 1369.70 3624.80
var = Variance; Cov = Covariance
Nitrogen-potassium (r = 0.87) and Phosphorus-potassium (r = 0.92).
3.2. Agro-Climatic Zones and Nutrient Balances
The study assessed whether agro-climatic zones differ from each other, on aver-age, with respect to farm nitrogen, phosphorus and potassium balances. This was explored preliminarily by looking at variance partitioning coefficient (VPC) and two tests i) assessing whether the variance of the random components of the intercept differ from zero and by ii) conducting likelihood ratio test.
Variance partitioning coefficient (VPC) measures the proportion of total va-riance which lies at the Agro-climatic zone level (level-2). Interpreted as VPC, 48%, 21%, and 11% of variation in nitrogen, phosphorus and potassium farm nutrient balances lie between agro-climatic zones respectively (Table 5; Table 6). This indicates that agro-climatic zones substantially differed with respect to NPK farm nutrient balances.
Suppose Agro-climatic zones were to differ only slightly or not at all, then the agro-climatic zone j values of oj (Equation (1)) should differ little from each
other and or exhibit low-to-no variance. However, a 95% confidence levels for random part of the model (Table 6) indicated that variances for farm nitrogen (95% CI: 1005.33, 7919.74) and phosphorus (95% CI: 69.8, 2281.36) were signif-icantly different from zero (Table 6). This indicates that there were significant differences between agro-climatic zones with respect to nutrient balances.
DOI: 10.4236/ojs.2017.76069 983 Open Journal of Statistics
95% confidence intervals assume assymptotic normal sampling distribution and may not be reliable. A likelihood ratio test done by comparing a model with agroclimatic zone effects (with oj) and one without oj, to assess whether
2
u
σ
(variance at level-2: agroclimatic zone) is significant returned:
(
2 log 0) (
2 log 1)
0 110657 10461 196.2 with 1 df
LR= − L − − L =D −D
= − =
The p-value associated with the Likelihood (LR) test statistic (Chi Square val-ue of 196.2) with 1 degree of freedom is 0.0001. Since the p-value is very small, we reject the null hypothesis (Ho: no agro-climatic zone variation or cluster ef-fect exists and restricted or single model is “the true model”) and conclude that a gro-climatic zone variation exists and is significant
(
2(
)
1,
N
349
196.2,
χ
=
=
)
0.01
p
<
. This further confirms that there were significant differences betweenagro-climatic zones with respect to farm nutrient balances.
3.3. Household Resource Endowments and Nutrient Balances
A two-level multilevel model (multivariate multilevel model) fitted to the dataset (see Section 4) to test the hypothesis: All household resource endowments do not have an effect on the magnitude of full N, P and K nutrient balances re-turned results shown in Table 7.
The observation that more than one household resource endowment variable has an effect on NPK nutrient balances provides a strong evidence against the null hypothesis (e.g. Value of livestock (0.0005 kg N ha−1, p < 0.001); cropping
family labour (−0.05101kg K ha−1, p < 0.01), Table 7. We thus reject the null
hypothesis and conclude that at least one household resource endowment has an effect on the magnitude of full N, P and K farm nutrient balances (Table 7).
[image:12.595.206.539.516.709.2]A negative relationship between family labour for cropping and NPK nutrient balances was observed (Table 7) with cropping family labour having a signify-
Table 7. Effects of household resource endowments on NPK nutrient balances.
Household resource endowment Nitrogen (kg ha−1) Phosphorus (kg ha−1) Potassium (kg ha−1)
Constant
Average slope% (AVGSLOPE)
20 cm Number of secondary production units (SPUNo: Number of livestock types) Tropical Livestock Units (TLUNo) Value of livestock (VALLVST: in Ksh) Total capital owned (CAPTOT: In Ksh) Cropping family labour (LABCROP: in days) Land rent received (VRENTOUT: in Ksh) Hired labour for RU-Cash (LABHIRUC: in Ksh)
−14.61 −1.57**
9.86** −4.77*” 0.0005*** −0.00001*”
−0.03545 0.00001 0.01325
16.07** −0.50*”
1.32 −1.35 0.0002** −0.00001****
−0.01307 0.00013***
0.02318**
13 −1.61****
7.36*** −2.65 0.00047**** −0.00001*** −0.05101** −0.00004
0.02078
DOI: 10.4236/ojs.2017.76069 984 Open Journal of Statistics
cant effect (negative) on potassium balance. A unit change in cropping family labour lowering potassium nutrient balance by 0.05101 kg K ha−1 (p < 0.01).
Al-though smallholders in Kenya rely heavily on family labour to manage their farms [29] this labour input may be for multiple purposes and not necessarily for strategic farm nutrient management alone.
Contrary to Cropping family labour, hired labour for redistribution units (LABHIRUC) had a positive effect on the direction of NPK nutrient balances. It significantly predicted phosphorus (P) balances with a unit change in LABHIRUC resulting in a change of 0.023 (p < 0.01) units in phosphorus balances.
Average slope of land, though a biophysical factor, was considered a proxy to land endowment resource quality. Farmers’ management practices and prices farmers are willing to offer for a given piece of land tend to differ depending on slope percentage, perceived degradation and ease of management attributed to slope effect. The study observed a negative correlation between average slope (%) of land and NPK nutrient balances and that average slope was significantly and negatively correlated with nitrogen balances.
The study observed mixed results with regards to effects of household re-source capital on nutrient balances. While the effects of “total capital owned” significantly lowered NPK nutrient balances, livestock-related capital (value of livestock) had significant positive effect (Table 7). Thus, the study has indicated that it is the type of capital (e.g. livestock) owned and not the volume and total value of household capital that may be important in determining nutrient bal-ances, though previous studies indicate that resource-rich farmers have a high chance of returning positive nutrient balances in their farms should they employ nutrient adding, recycling and conserving technologies and practices [30].
4. Conclusions and Recommendations
Based on a two-level multilevel (multivariate multilevel) model fitted to the nu-trient balance dataset, this study has shown that farm nitrogen mining is taking place and is putting the quality of arable land in Kenya at stake. However, and contrary to on-going narratives on blanket existence of widespread nutrient mining in Kenya, evidences from this study indicate that farm phosphorus and potassium balances are not always negative.
Agro-climatic zones are characterised by different biophysical potentials that may influence farm nutrient balances to different degrees. The study draws the conclusion that farm nitrogen, phosphorus and potassium balances do differ between agro-climatic zones classified as arable land in Kenya. For example, va-riances for farm nitrogen and phosphorus were significantly different from zero across agro-climatic zones. The same was corroborated by likelihood ratio test. This serves to indicate the necessity of designating agro-climatic zone specific nutrient management interventions to address declining quality of arable land rather than the use of blanket intervention approaches.
DOI: 10.4236/ojs.2017.76069 985 Open Journal of Statistics
have a potential to influence farm nutrient balances. This study explored the ef-fects of household resource endowments on nutrient balances in arable land. The study concludes that livestock household resource endowments is an im-portant determinant of nutrient balances at smallholder farm level, thus recom-mends improvement of livestock practices at farm level not only to improve on farm nutrient balances but also to increase farm-profitability. However, it is fur-ther noted that ownership of large volumes of capital (total value of capital) and family labour resources do not automatically translate into positive effects on farm nutrient balances, but rather it is the type of capital owned (e.g. livestock) and what use it has been put to that matters.
The study generated interesting results and demonstrated that multivariate multilevel models can be used to conduct meta-analysis of farm nutrient bal-ances and to explore arable land quality despite the small sample size. Future studies with large sample sizes and a large pool of relevant factors and covariates are, however, required to further give higher order insights beyond this study. This can be reinforced by meta-analysis that focuses on summary statistics and the use of simulation modeling to summarise inferences by random numbers rather than by point estimates and standard errors.
Acknowledgements
Sincere thanks to Dr. Edgar Otumba of Maseno University for his encourage-ment and to smallholder farmers who participated in research activities leading to generation of data used in this study.
References
[1] Stoorvogel, J.J. and Smaling, E.M.A. (1990) Assessment of Soil Nutrient Depletion in Sub-Sahara Africa: 1983-2000, 4 Volumes. Report 28, The Win and Staring Cen-tre, Netherlands.
[2] Smaling, E.M.A., Nandwa, S.M. and Janssen, B.H. (1997) Soil Fertility Is at Stake, in Reprenishing Soil Fertility in Sub-Saharan Africa. In: Buresh, R., Sanchez, P.A. and Calhoun, F., Eds., American Society of Agronomy and Soil Science Society of America, Madison Wisconsin, 47-61.
[3] Mortimore, M. and Harris, F. (2005) Do Small Farmers’ Achievements Contradict the Nutrient Depletion Scenarios for Africa? Land Use Policy, 22, 43-56.
https://doi.org/10.1016/j.landusepol.2003.06.003
[4] Hartemink, A.V.K. and van Keulen, H. (2005) Soil Degradation in Sub-Saharan Africa. Land Use Policy, 22, 1. https://doi.org/10.1016/j.landusepol.2004.01.001
[5] Færge, J. and Magid, J. (2004) Evaluating NUTMON Nutrient Balancing in
Sub-Saharan Africa. Nutrient Cycling in Agroecosystems, 69, 101-110.
https://doi.org/10.1023/B:FRES.0000029680.97610.51
[6] van den Noorgate, W., Lopez-Lopez, J.A., Marin-Martinez, F. and Sanchez-Meca, J. (2012) Three-Level Meta-Analysis of Dependent Effect Sizes. Behavioral Research, 45, 576-594. https://doi.org/10.3758/s13428-012-0261-6
DOI: 10.4236/ojs.2017.76069 986 Open Journal of Statistics [8] Borenstein, M., Hedges, L.V., Higgins, J.P.T. and Rothstein, H.R. (2009)
Introduc-tion to Meta-Analysis. John Wiley and Sons Ltd., Hoboken.
https://doi.org/10.1002/9780470743386
[9] Scammacca, N. Roberts, G. and Stuebing, K.K. (2014) Meta-Analysis with Complex Research Designs: Dealing with Dependence from Multiple Measures and Multiple Group Comparisons. Review of Educational Research, 84, 328-364.
https://doi.org/10.3102/0034654313500826
[10] Capon, N., Farley, J.U. and Hoenig, S. (1990) Determinants of Financial Perfor-mance: A Meta-Analysis. Management Science, 36, 1143-1159.
https://doi.org/10.1287/mnsc.36.10.1143
[11] Cleophas, T.J. and Zwinderman, A.H. (2007) Meta-Analysis. Circulation, 115, 2870-2875. https://doi.org/10.1161/CIRCULATIONAHA.105.594960
[12] Broeze, K.A., Opmeer, B.C., van der Veen, F. and Bossuyt, P.M. (2010) Individual Patient Data Meta-Analysis: A Promising Approach for Evidence Synthesis in Re-productive Medicine. In: Bhattacharya, S. and Mol, B.W.J., Eds., Human Reproduc-tion Updata, 16, 561-567. https://doi.org/10.1093/humupd/dmq043
[13] Batary, P., Baldi, A., Kleijn, D. and Tscharntke, T. (2010) Landscape-Moderated Biodiversity Effects of Agri-Environmental Management: A Meta-Analysis. Pro-ceedings of the Royal Society Biological Sciences, 278, 1894-1902.
https://doi.org/10.1098/rspb.2010.1923
[14] Cooper, H., Hedges, L.V. and Valentine, J.C. (2009) The Handbook of Research Synthesis and Meta-Analysis. Russel Sage Foundation, New York.
[15] Geist, H.J. and Lambin, E.F. (2001) What Drives Tropical Deforestation? A Me-ta-Analysis of Proximate and Underlying Causes of Deforestation Based on Subna-tional Case Study Evidence. LUCC Report Series No.4, LUCC InternaSubna-tional Project Office, University of Louvain, Belgium.
[16] Alston, J.M., Chan-Kang, C., Marra, M.C., Pardey, P.G. and Wyatt, T.J. (2000) A Meta-Analysis of Rates of Return to Agricultural RD. International Food Policy Re-search Institute.
[17] Mondelaers, K., Aertsens, J. and Van Huylenbroeck, G. (2009) A Meta-Analysis of the Differences in Environmental Impacts between Organic and Conventional Farming. British Food Journal, 111, 1098-1119.
https://doi.org/10.1108/00070700910992925
[18] Tuomisto, H.L., Hodge, I.D., Riordan, P. and Macdonald, D.W. (2012) Does Or-ganic Farming Reduce Environmental Impacts? A Meta-Analysis of European Re-search. Journal of Environmental Management, 112, Article ID: 309320.
https://doi.org/10.1016/j.jenvman.2012.08.018
[19] Konstantopoulos, S. (2006) Fixed and Mixed Effects Models in Meta-Analysis. IZA DP No. 2198, Northwestern University and IZA Bonn, Bonn.
[20] Rao, S.R., Graubard, B.I., Schmid, C.H., Morton, S.C., Louis, T.A., Zaslavsky, A.M. and Finkelstein, D.M. (2008) Meta-Analysis of Survey Data: Application to Health Services Research. Health Services Outcomes Research Method, 8, 98-114.
https://doi.org/10.1007/s10742-008-0032-0
[21] Sileshi, G., Akinnifesi, F.K., Ajayi, O.C. and Place, F. (2008) Meta-Analysis of Maize Yield Response to Woody and Herbaceous Legumes in Sub-Saharan Africa. Plant and Soil, 307, 1-19.https://doi.org/10.1007/s11104-008-9547-y
[22] Stwardt, G. (2010) Meta-Analysis in Applied Ecology. Biology Letters, 6, 78-81.
DOI: 10.4236/ojs.2017.76069 987 Open Journal of Statistics [23] Mavridis, D. and Salanti, G. (2011) A Practical Introduction to Multivariate
Me-ta-Analysis. Statistical Methods in Medical Research, 22, Article ID: 133158. [24] Rabe-Hesketh, S. and Skrondal, A. (2006) Multilevel Modelining of Complex Survey
Data. Journal of the Royal Statistical Society, 169, 805-827.
https://doi.org/10.1111/j.1467-985X.2006.00426.x
[25] Afshartous, D. and Wolf, M. (20015) Avoiding Data Snooping in Multilevel and Mixed Effects Models. Institute for Empirical Research in Economics, University of Zurich, Zurich.
[26] Goldstein, H. (1986) Multilevel Mixed Linear Model Analysis Using Iterative Gene-ralised Least Squares. Biometrika, 73, 43-56.https://doi.org/10.1093/biomet/73.1.43
[27] Zhang, Z., Charlton, C.M.J., Parker, R.M.A., Leckie, G. and Browne, W.J. (2016) R2MLwiN: A Package to Run MLwiN from within R. Journal of Statistical Software.
http://www.bris.ac.uk/cmm/media/r2mlwin/article/Zhang_et_al.pdf
[28] Muthén, B.O. and Satorra, A. (1989) Multilevel Aspects of Varying Parameters in Structural Models. In: Bock, R.D., Ed., Multilevel Analysis of Educational Data, Academic Press, San Diego, 87-99.
https://doi.org/10.1016/B978-0-12-108840-8.50009-3
[29] De Jager, A. (2007) Practice Makes Perfect: Participatory Innovation in Soil Fertility Management to Improve Rural livelihoods in East Africa. PhD Thesis, Wageningen University, Wageningen.