Abstract— In this article, we describe how educators’
knowledge structure is utilized to diagnose a student’s knowledge structure about college mathematics courses such as Calculus and Linear Algebra. We also describe how an adaptive tutoring system is implemented into our mathematics learning software JCALC using a relative distance. At the end, we describe how students using JCALC performed
Index Terms— adaptive tutoring system, educator’s knowledge structure, relative distance
I. I
NTRODUCTIONW ell known effective educational model for less prepared students is one-on-one tutoring [1]. But, one-on-one tutoring is not a realistic solution because of cost. This lead us to hypothesize that if Intelligent Tutoring Systems (ITSs) with one-on-one tutoring capability is implemented into our calculus and linear algebra learning software JCALC, less prepared students will acquire self-study skill and achieve better performance in learning calculus and linear algebra.
Even though ITSs are becoming popular among students at pre-college level mathematics courses [3], designing ITS which accurately diagnose students’ knowledge structure, skills, and styles is not easy.
In this article, we describe how educators’ knowledge structure is utilized to diagnose a student’s knowledge structure. We also describe how a relative distance and educators’ concept map are utilized for implementing an adaptive tutoring system into JCALC. At the end, we verify whether the hypothesis is true or not by examining the difference of the slope and the intercept of linear regression of the group with JCALC and the one without JCALC and learned that the hypothesis about the interception is valid.
Manuscript received July 17, 2011; revised Aug, 5 2011. This work was supported in part by Shibaura Institute of Technology, Grant-in-Aid for Scientific Research in 2011-2012.
H. Yokota is with Shibaura Institute of Technology, Saitama, 337-8570, Japan +8148-687-569; (e-mail: hyokotar@ shibaura-it.ac.jp).
II. DIAGNOSING STUDENT’S KNOWLEDGE STRUCTURE
A. Educator’s knowledge structure
How experienced mathematics educators assess students' knowledge structure from the solution written on the paper is studied by asking the following questions to my colleagues:
1) If a student writes as to the question of
―Find the derivative of ‖. How do you assess the student’s knowledge structure.
2) If a student writes as the answer to the question of ―Find the derivative of
‖. How do you assess the student’s knowledge structure.
3) If a student writes as the answer to the question of ―Evaluate ―. How do you assess the student’s knowledge structure.
4) If a student writes as the answer to the question of "Find the minor of . How do you asses this student's knowledge structure.
5) If a student writes as the answer to the question of "Find the cofactor of . How do you asses this student's knowledge structure.
6) If a student writes as the answer to the question of "Find the cofactor expansion of along the 1st row". How do you asses this student's knowledge structure.
For the question 1), most of my colleagues agreed that this student knows how to differentiate cosine function. But the person probably does not know how to apply the chain rule.
For the question 2), most of my colleague agreed that this student knows what to do. But this person somehow memorized the quotient rule in the wrong way. For the question 3), most of my colleague agreed that this student knows about the integration rule called by parts. But the person did not apply the integration rule correctly. So, the person’s knowledge about integration is not enough. For the question 4), most of my colleagues responded by saying that this student knows that the minor of a matrix is given by
On Development of an Adaptive Tutoring System Utilizing Educator’s Knowledge
Structure
Hisashi Yokota
determinant. But the person does not know how to find it. For the question 5), most of my colleagues responded by saying that this student may know a little bit about cofactor. But forgetting a sign means that his/her knowledge about cofactor is not enough. For the question 6), most of my colleague responded by saying that this student has no idea about cofactor expansion.
From these responses, we are inclined to say that the knowledge structure of experienced mathematics educators is very similar. Even though the knowledge of an individual expert consists of both a cognitive element— the individual’s viewpoints and beliefs, and a technical element—the individual’s context specific skills and abilities [4], we can use experienced mathematics educators' knowledge structure as the basic knowledge about how to solve problems in calculus and linear algebra.
B. Assessing Learner’s knowledge structure
To assess a learner's knowledge structure, one well known method is concept mapping. According to [5], to construct a good concept map, it is important to begin with a domain of knowledge structure that is very familiar to the person constructing the map. Following this suggestion, we made sure the learning outcomes of the subject we are teaching.
Then we created the performance criteria for each concept for which students are expected to learn. For example, the performance criteria for the derivatives are shown in table 1.
TABLE 1.PERFORMANCE CRITERIA
Derivatives
Polynomials
Sum of derivatives Difference of derivatives Constant multiples
Rational Functions
Sum of derivatives Difference of derivatives Constant multiples Quotient Rule
Trig Functions
Differentiation formula of
Differentiation formula of
Sum, difference, product, quotient rule
Differentiation formula of inverse trig functions
Composite Functions
Composition of polynomials, rational functions , trig functions, exponential functions,
logarithmic functions, inverse trig functions, hyperbolic functions Differentiation formula of composite functions Derivatives of composite functions
Higher Order Derivatives
Property of the second derivatives
th derivatives Leibnitz formula Application
s of
Derivatives
Tangent line Normal line
Taylor, MacLaurin expansion Estimating remainder term
Now to check to see whether students understand the concept, we create questions which ask necessary knowledge to be tested. This suggests that questions generated by our
system must be split into finer questions which are more familiar to the learner. Since a short-answer question the learner's answer to the finer short-answer questions, we can construct a concept map for each person. Now using the knowledge structure of experienced mathematics educators, it is possible to identify the key concepts that apply to this domain. Thus, the concept map of experienced educators' knowledge structures is used to generate a short-answer question.
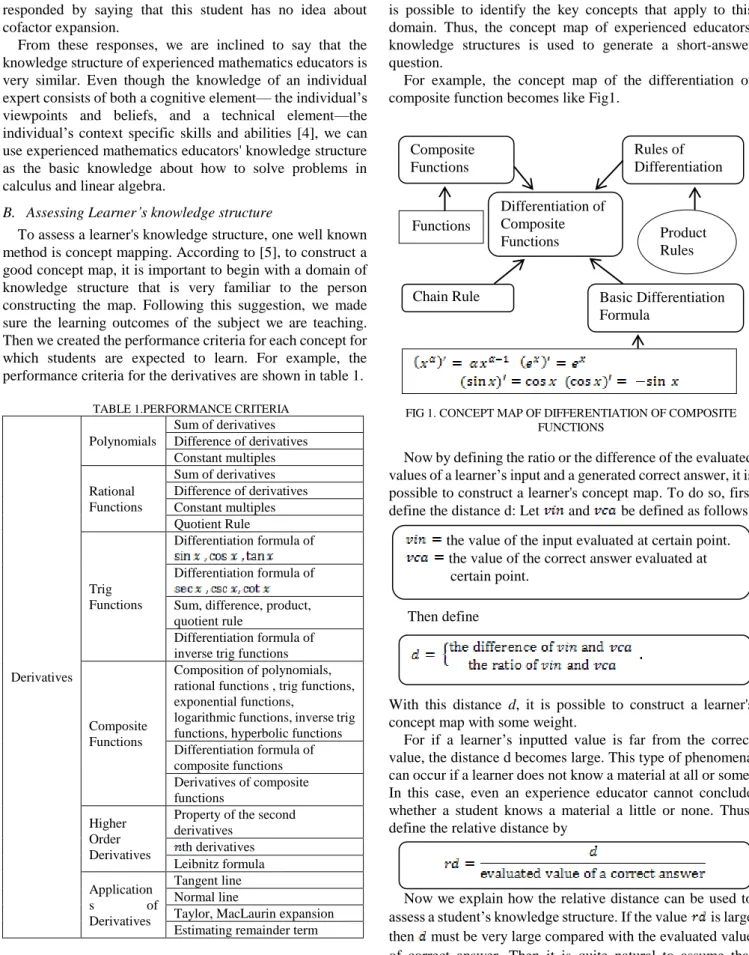
For example, the concept map of the differentiation of composite function becomes like Fig1.
FIG 1. CONCEPT MAP OF DIFFERENTIATION OF COMPOSITE FUNCTIONS
Now by defining the ratio or the difference of the evaluated values of a learner’s input and a generated correct answer, it is possible to construct a learner's concept map. To do so, first define the distance d: Let and be defined as follows:
Then define
With this distance d, it is possible to construct a learner's concept map with some weight.
For if a learner’s inputted value is far from the correct value, the distance d becomes large. This type of phenomena can occur if a learner does not know a material at all or some.
In this case, even an experience educator cannot conclude whether a student knows a material a little or none. Thus, define the relative distance by
Now we explain how the relative distance can be used to assess a student’s knowledge structure. If the value is large, then must be very large compared with the evaluated value of correct answer. Then it is quite natural to assume that students do not know anything about the material. On the other hand, if the value is small, we assume that students know the material a little. Then using the concept map of the
the value of the input evaluated at certain point.
the value of the correct answer evaluated at certain point.
Differentiation of Composite Functions
Rules of Differentiation
Basic Differentiation Formula
Composite Functions
Chain Rule
Product Rules Functions
derivative of composite functions, we can evaluate how much students know about the material by assigning the relative distance to the concept map.
FIF 2 RERATIVE DISTANCE
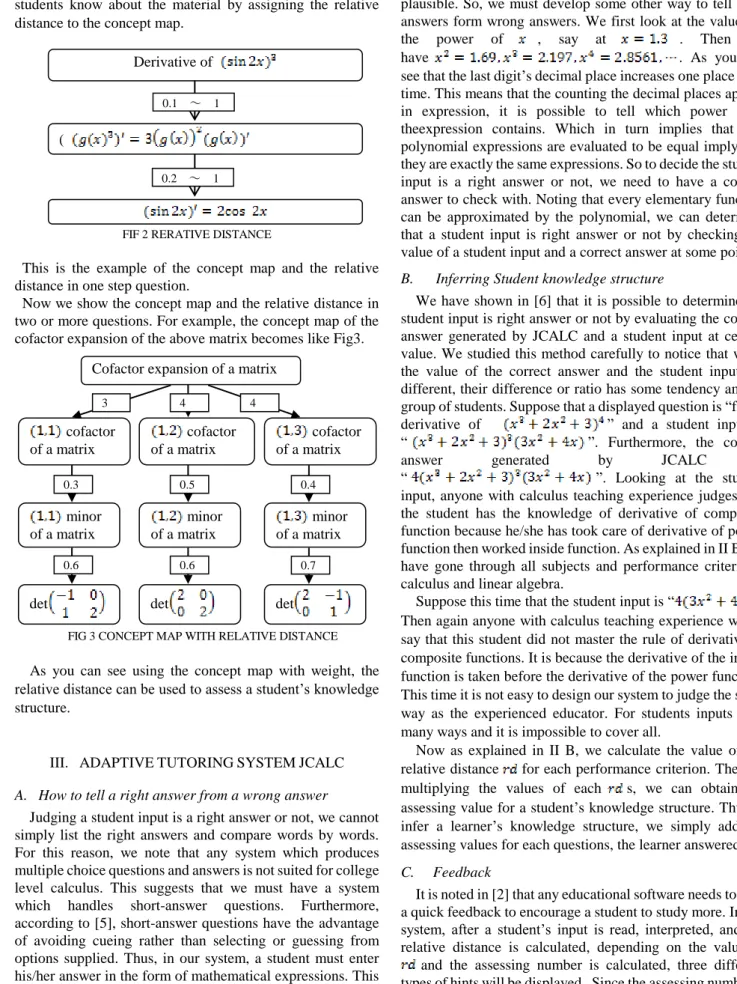
This is the example of the concept map and the relative distance in one step question.
Now we show the concept map and the relative distance in two or more questions. For example, the concept map of the cofactor expansion of the above matrix becomes like Fig3.
FIG 3 CONCEPT MAP WITH RELATIVE DISTANCE
As you can see using the concept map with weight, the relative distance can be used to assess a student’s knowledge structure.
III. ADAPTIVE TUTORING SYSTEM JCALC A. How to tell a right answer from a wrong answer
Judging a student input is a right answer or not, we cannot simply list the right answers and compare words by words.
For this reason, we note that any system which produces multiple choice questions and answers is not suited for college level calculus. This suggests that we must have a system which handles short-answer questions. Furthermore, according to [5], short-answer questions have the advantage of avoiding cueing rather than selecting or guessing from options supplied. Thus, in our system, a student must enter his/her answer in the form of mathematical expressions. This also suggests that our system must be able to read a student’s input and be able to tell whether it is a right answer or not.
The expressions for right answers are not unique, rather unlimited. Thus, preparing all expressions for right answers in database, and checking whether students’ answer is in
database to decide the students answer is correct is not plausible. So, we must develop some other way to tell right answers form wrong answers. We first look at the values of
the power of , say at . Then we
have . As you can
see that the last digit’s decimal place increases one place each time. This means that the counting the decimal places appear in expression, it is possible to tell which power of x theexpression contains. Which in turn implies that two polynomial expressions are evaluated to be equal imply that they are exactly the same expressions. So to decide the student input is a right answer or not, we need to have a correct answer to check with. Noting that every elementary function can be approximated by the polynomial, we can determine that a student input is right answer or not by checking the value of a student input and a correct answer at some point.
B. Inferring Student knowledge structure
We have shown in [6] that it is possible to determine the student input is right answer or not by evaluating the correct answer generated by JCALC and a student input at certain value. We studied this method carefully to notice that when the value of the correct answer and the student input are different, their difference or ratio has some tendency among group of students. Suppose that a displayed question is ―find a derivative of ‖ and a student input is
― ‖. Furthermore, the correct
answer generated by JCALC is
― ‖. Looking at the student
input, anyone with calculus teaching experience judges that the student has the knowledge of derivative of composite function because he/she has took care of derivative of power function then worked inside function. As explained in II B, we have gone through all subjects and performance criteria of calculus and linear algebra.
Suppose this time that the student input is ― ‖.
Then again anyone with calculus teaching experience would say that this student did not master the rule of derivative of composite functions. It is because the derivative of the inside function is taken before the derivative of the power function.
This time it is not easy to design our system to judge the same way as the experienced educator. For students inputs vary many ways and it is impossible to cover all.
Now as explained in II B, we calculate the value of the relative distance for each performance criterion. Then by multiplying the values of each s, we can obtain the assessing value for a student’s knowledge structure. Thus to infer a learner’s knowledge structure, we simply add the assessing values for each questions, the learner answered.
C. Feedback
It is noted in [2] that any educational software needs to give a quick feedback to encourage a student to study more. In our system, after a student’s input is read, interpreted, and the relative distance is calculated, depending on the value of and the assessing number is calculated, three different types of hints will be displayed. Since the assessing number is supposed to assess a student’s knowledge structure, the sum of assessing number gives more valuable information about how much student knows.
Now we show how hints are generated and displayed. We checked all subjects and performance criteria of calculus and Derivative of
Cofactor expansion of a matrix
cofactor of a matrix
minor of a matrix
det
cofactor of a matrix
minor of a matrix
minor of a matrix
cofactor of a matrix
det det
3 4 4
0.3 0.5 0.4
0.6 0.6 0.7
(
0.1 ~ 1
0.2 ~ 1
linear algebra. Then we divided short-answer questions into 44 groups depending on the number of steps used to solve these questions. For example, when we want to generate a question of differentiating a product of functions, we search a collection of techniques which gives a product rule. Then using the function generated, we display a hint explaining what to do to solve this question. If the value of sum of is less than 1, then using the displayed question, hint for which experienced educator give will be displayed. If student cannot get a right answer, another hint will be displayed.
IV. SELF-STUDY WITH JCALC A. LMS
For students to continue studying by using mathematics-learning software, we have to implement not only hint giving function but learning management system.
Since this system is mainly used at home and the school we work has very strict network security, we have prepared installer for students to install JCALC to their PC. Then implement JCALC a database so that everything students’
inputted can be saved into the database. When a student answers a question shown on the screen, the system will infer the student’s knowledge structure about the subject asked by using explained above. Then the system tells the student whether he/she needs to go over. Once students went through questions, they can check to see how well they did, and the same time, when they push send button, all data in database can be uploaded to the server.
The data uploaded to the server contains much more information about students. They contain what students inputted, how many times they made mistakes to get to the right answer, how long they took to solve questions, the rate of correctness, and the value of . All educators can obtain these data by accessing the server. So, we check through all these data, especially what they inputted and evaluate the values of sum of s for each student. We sort the values of and then we look at the question for which the largest value of is occurred. Once we pick up a few questions for which the value of is large, we go over these questions in the class next time we meet.
B. TESTING THE HYPOTHESIS
To test our hypothesis, we selected 24 students among 63 students who failed in the unified exam given in 2009. Then 24 students are given JCALC to study at home and the rest of students are given usual lecture for one semester. Then in 2010, the unified exam are given to 63 students, and the scores of those students who studied with JCALC are marked red and the rest of students’ scores are marked blue as in the Fig 4.
The equation of the linear regression line for students
studied with JCALC is given by , and
the equation of the linear regression line for students without JCALC is given by . Now the equation implies that students studied with JCALC can score around 48 points even though they scored low in 2009 unified exam. On the other hand, the equation has the slope near 1 and the y-intercept 7.15. Thus we can conclude that students without JCALC improved their score by 7. Since the passing score is 60, those
students without JCALC must study a few more years to pass the unified exam.
FIG 4 COMPARISON OF UNIFIED EXAM SCORES
The equation of the linear regression line for students
studied with JCALC is given by , and
the equation of the linear regression line for students without JCALC is given by . Now the equation implies that students studied with JCALC can score around 48 points even though they scored low in 2009 unified exam. On the other hand, the equation has the slope near 1 and the y-intercept 7.15. Thus we can conclude that students without JCALC improved their score by 7. Since the passing score is 60, those students without JCALC must study a few more years to pass the unified exam.
We also note that the scores of those students studied with JCALC are above the regression line of those students without JCALC. Thus, there is no bad effect about using an adaptive tutoring system besides the classroom teaching.
Finally we test the hypothesis which states that blended learning with JCALC is more effective for improving the self-study skill than face-to-face learning. To test this, we test whether the slope and y-intercept has 5% significant difference. If there is not enough significant difference, the slope divided by residual must be almost the same. So, we make this statement as a null hypothesis . Now let the slopes of the regression lines be , and the accumulated standard deviations is calculated according to the following
formula Then under we
have .
Also, 5% statistical significance for student t value is Thus, we have to conclude that little or no real significant against the null hypothesis. Now we test the claimed difference in intercepts by using analysis of covariance. Then we obtain the moderate difference against the null hypothesis.
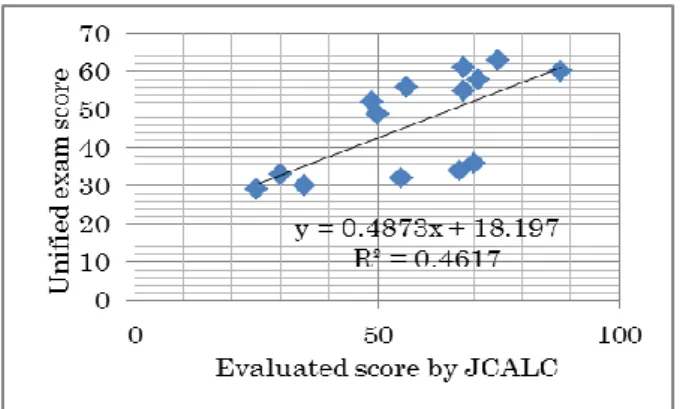
C. TESTING THE ASSESSING METHOD OF JCALC
Now we test the assessing method implemented into JCALC
is valid or not. The Fig5 shows that the JCALC’s evaluated
scores of students and the unified exam scores of students.
FIG 5 COMPARISON OF JCALC AND EXAM SCORES
Here, we use hypothesis test for slope of regression line. The null hypothesis is the slope = 0. Now the standard error SE is given by the following expression.
Then SE = 0.253 . Since T-score is given by , we
obtain .
Now . Therefore the p-value is
less than the significant level (0.05), we cannot accept the null hypothesis.
A
CKNOWLEDGMENTWe thank all colleagues and students participated in this project and suggested useful ideas to develop a problem based learning system for linear algebra.
R
EFERENCES[1]
Ainsworth, R.G. (1995). ―Turning potential school dropouts into graduates: the case for school-based one-to-one tutoring.Research report 95 – 07.‖ National Commission for Employment Policy, 35.