http://www.scirp.org/journal/sgre ISSN Online: 2151-4844
ISSN Print: 2151-481X
DOI: 10.4236/sgre.2017.812026 Dec. 25, 2017 394 Smart Grid and Renewable Energy
Evaluation of Solar Potential at Niamey: Study
Data of Insolation from 2015 and 2016
Maigargue Dankassoua
1, Saïdou Madougou
1*, Saleye Yahaya
21Laboratory of Energetic, Electronics, Electrotechnics, Automation and Industrial Computing (LEA2EI), University Abdou Moumouni of Niamey, Niamey, Niger
2National Center of Solar Energy (CNES), Niamey, Niger
Abstract
Solar energy is a very abundant renewable energy source during the day. The solar energy received in a given point of the Earth is function of the time, the season and the latitude of the point. It has been proven that the solar energy received in one day by our planet is thirty times higher than the annual global energy consumption. Africa is one of the sunniest continents of the world. Nowadays, solar energy is attracting particular attention in the implementa-tion of the energy policies. This renewable source is a key soluimplementa-tion to world energy problems, especially in the context of global warming. Niger is identi-fied as among the sunniest zones of the World. Knowledge of solar potential is one of the crucial parameters to master for energy applications. In this study, continuous measurements (at intervals of 5 minutes over 24 hours) of solar radiation have been carried out on the site of the National Center of Solar Energy of Niamey. These measurements were taken using the pyranometers, allowed us to collect the values of the daily global sunshine on a horizontal plane and on an inclined plane of the years 2015 and 2016. The treatment and the exploitation of these data allowed us to determine the daily and monthly duration of sunshine, then the impact of the clouds and dust on the solar rad-iation, to evaluate the solar potential of the site and determine the variations of this solar potential as a function of time. The results showed that the solar potential was very favorable for many solar applications.
Keywords
Solar Energy, Sunning, Solar Potential, Energy Application, Solar Photovoltaic, Solar Thermals
1. Introduction
Since the industrial revolution, the world has known an important economic
How to cite this paper: Dankassoua, M., Madougou, S. and Yahaya, S. (2017) Evalu-ation of Solar Potential at Niamey: Study Data of Insolation from 2015 and 2016. Smart Grid and Renewable Energy, 8, 394-411.
https://doi.org/10.4236/sgre.2017.812026
Received: November 6, 2017 Accepted: December 22, 2017 Published: December 25, 2017
Copyright © 2017 by authors and Scientific Research Publishing Inc. This work is licensed under the Creative Commons Attribution International License (CC BY 4.0).
DOI: 10.4236/sgre.2017.812026 395 Smart Grid and Renewable Energy
development which generated a very significant increase in energy demand [1] [2]. This boom has been mainly covered by the use of fossil and fissile energy sources which are exploited in an abusive way. Unfortunately, this overexploita-tion will soon lead to their exhausoverexploita-tion and their end [2]. Moreover, the exploita-tion of the fossil energy sources was not without consequences on the environ-ment. As a result, climate warming has become a major global issue [3]. The challenge is, therefore, to ensure the world’s energy demand without increasing global greenhouse gas emissions. In this context, today, renewable energies ap-pear, to be the ultimate solution with this challenge. Renewable energies abound in the world and make the pride of the countries which have them and exploit them. Solar energy is an abundant and inexhaustible renewable energy source, which is useful in human life. In a single day, the Earth receives solar energy of about 1.6 × 10¹⁸ kWh/year, the equivalent of 30,000 times the world energy
con-sumption needs [4]. In Niger, many estimates, but without real measurements on the ground, indicate the existence of an important potential and its occur-rence over the whole the country. However, the knowledge of the solar potential is an essential parameter for the implementation of its applications. It is there-fore, necessary to have solar potential data from in situ measurements. This pa-per presents the results of an evaluation of the solar potential in Niamey based on real data of measurements through the years of 2015 and 2016. We first present the problem, followed by materials and methods. Next, we expose the results and finish with the conclusion and the perspectives.
2. Literature Review
The control of the random nature of renewable energy sources, particularly solar energy, could make it possible to the power network operators to better exploit them and use them. The sizing and optimal management of a solar system [5]
necessarily involves perfect knowledge of the solar radiation arriving on the ground in a given medium.
DOI: 10.4236/sgre.2017.812026 396 Smart Grid and Renewable Energy
[6]. The valorization of solar energy in Niger is one of the most appropriate so-lutions to the energy crisis that is plaguing the country. Indeed, the social indi-cators as regards access to energy are among weakest of the world. In 2014, the rate of access to electricity in Niger is 10%, while that of access to the modern energy for cooking is only 1%, for a growth rate of the population of 3.9% per year [6][7]. To raise these indicators of access to the energy and so much well of others, Niger needs to effectively emphasize its potential of solar energy. How-ever, the effective application of this solar potential requires initially the perfect knowledge of its data in space and time. Therefore, there is need for thorough and detailed studies of the solar energy potential throughout the world. This study falls within this framework of action.
In the solar energy potential assessment at the Sahelian band, only a few stu-dies have been really conducted. We can cite the study conducted by B. Ould Bi-lal et al. (2007) on the study and modeling of the solar potential of the Nouak-chott and Dakar sites. The results that authors obtained show that, at each site, the solar radiation measured and calculated has the same allure. A comparative study conducted by the authors has led a fairly good correspondence between the solar radiation of Dakar and Nouakchott. The evaluation of available solar energy shows that the worst months are December for Nouakchott and February for Dakar, with respective irradiations of 4.9 kWh/m² and 4.37 kW/m² [8]. The second study to emphasize is that of M. Dankassoua et al. (2017) where the au-thors studied the global solar radiation in Niamey from the pre-monsoon and the monsoon period of the year 2013 (May to October). In this study, it appears from the analysis of the results a good correlation between the measured results of global solar radiation and these’s calculated with the models. It also implies that Niamey area has a good insolation [6]. The last study is for Abdoulatif Bonkaney et al. (2017). In this paper, authors studied the impacts of cloud cover and dust on the performance of photovoltaic module in Niamey. Results show that dust accumulation has a great effect on decreasing the daily energy yield of the unclean module [9]. But this effect is a long-term effect. For the cloud cover, the effect is immediate. All of these studies show that the Sahelian band has good potential, but all of these studies are done over a very short period. This does not confirm the reliability of the results obtained and also know the contours of their daily, monthly, annual and seasonal variations.
3. Materials and Method
3.1. Site of Measurements
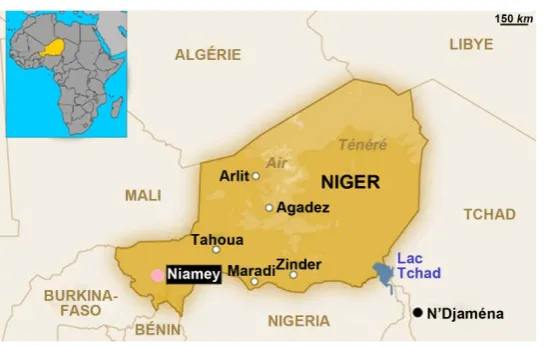
The data collection is carried out at the National Center of Solar Energy (CNES) in the city of Niamey from January 2015 to December 2016. Figure 1 shows the position of Niamey city on the map of Niger.
DOI: 10.4236/sgre.2017.812026 397 Smart Grid and Renewable Energy
[image:4.595.239.512.66.239.2]Figure 1. Position of Niamey city on the map of Niger.
Table 1. Geographical coordinates of the site of measurements.
Site of measurements Longitude ϕ(°) Latitude θ(°) Altitude Z (m)
CNES 2°11'East 13°50'North 213
3.2. Materials of Measurements
To evaluate the solar potential, we collected the data of the solar radiation (ir-radiation in W/m2) during the years of 2015 and 2016. These data result from
measurements using two pyranometers and their accessories installed at the Na-tional Centre of Solar Energy of Niamey. The duration of insolation is a classical weather data, measured using a heliograph. The examination of the bands helio-graphs is done according to the established standards. The total Radiation is measured using a pyranometer with integrator ELSB-2 [6][10], with digital dis-plays, which integrate the values of the total solar radiation per day. The devices are installed on the roof of a building on concrete bases, to approximately 5 m height in places released well in order to avoid the shadow by the surrounding objects (Figure 2).
3.3. Installation of Materials
3.3.1. Establishment of the SupportsThis operation consists of well positioning the wooden supports in the desired orientation. The ideal orientation of the solar collectors is full South in the Northern hemisphere (full North in the Southern hemisphere) so that the sun-shine arrive perpendicularly to the collectors so that they receive the maximum of sunlight. A variation of 15˚ towards the East or the West can be accepted since the output of the system decreases very appreciably. Thus, we chose the Southern orientation full for our two solar collectors during all measurements.
3.3.2. Fixing the Solar Collectors
DOI: 10.4236/sgre.2017.812026 398 Smart Grid and Renewable Energy
Figure 2. The devices are installed on the roof of the building of the CNES and the shelter of protection of the base of data recording on the spot.
3.3.3. Adjustment the Horizontality
A spirit level is used to monitor horizontality for measurements on the horizon-tal plane.
3.3.4. Adjustment of the Inclination
An inclinometer (a rule of 50 cm provided with a spirit level and a mobile disc graduated in degree) is used to monitor the inclination for measurements on the inclined plane.
3.3.5. Measurement Principle of the Pyranometer
The pyranometer is intended to measure global solar radiation at short wave-lengths in the spectral range from 300 to 2800 nm. The thermopile detector measures the luminous flux up to 2000 W/m², with a response time of less than 18 seconds and a sensitivity usually estimated at 10 μV/W/m² and varies ±5% from −10˚C to +40˚C. The operating temperature range is from −40˚C to +80˚C and the stability is over 1% per year [6]. The pyranometers have as the mea-surement accuracies: directional error < 20 W/m2, tilt error < 3% and expected
daily uncertainty < 10% [11].
3.3.6. Connections
The first connection consists of connecting the radiometer to bill-poster-recorder METEON via a cable. The second connection consists to join the bill-poster-recorder to the Laptop via the USB interface cable [12].
3.4. Method of Data-Gathering
DOI: 10.4236/sgre.2017.812026 399 Smart Grid and Renewable Energy
4. Presentation, Analysis and Interpretation of the Results
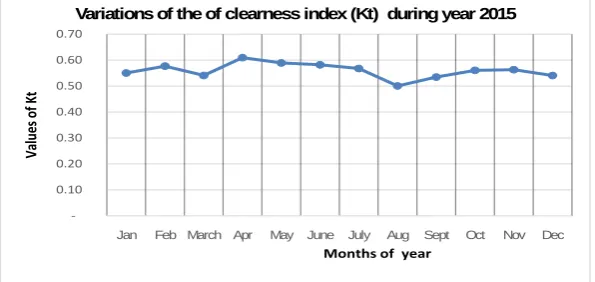
4.1. Clearness Index
Figure 3 presents the values of the clearness index (Kt) at Niamey for the year 2015.
The values of Kt lie between 0.50 and 0.61, what proves that the atmosphere is turbid during the year. The lowest value is obtained in August which corres-ponds to the period of highest rainfall. This is explained by the presence of water molecules in the atmosphere and to the effect of albedo by the clouds. The maximum value 0.61 indicates the presence of the impurities in the atmosphere. Indeed the Sahelo-Saharan area is characterized by an atmosphere rich in aero-sols of all sizes. Their concentration is, however, stronger during the dry season (December-March) than during the wet season (May-October) where the at-mosphere undergoes a light purification by rainwater. These results of clearness index confirm those obtained by Abdoulatif Bonkaney et al. (2017) [9].
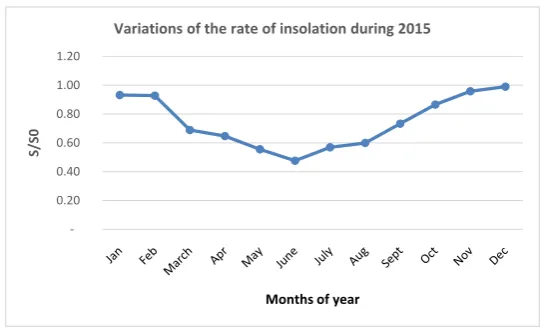
4.2. Fraction of Insolation
Figure 4 illustrates the variation of the rate of insolation during the year 2015. The rate of insolation (relationship between the duration of real insolation S and the total duration of insolation S0) varies between 0.48 and 0.99. The average
is of 0.89. This strong rate shows that the solar layer with Niamey would be im-portant.
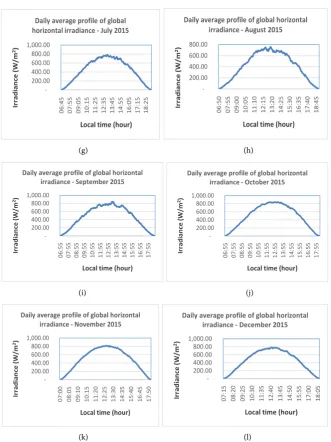
4.3. Daily Average Profile of the Global Irradiance on a Horizontal
Plane
Figures 5(a)-(l) show the daily average (standard days) profile of the global ir-radiance on a horizontal plane of the different months in 2015.
These figures show the importance of the global irradiance on a horizontal plane owing to the fact that they correspond to the standard day of each month of the 2015. They present the maximum values of global solar radiation close to the average values of each month, thus giving a good estimate of the solar poten-tial of each month. Values that exceed 600 Wh/m2 are obtained between 1
Figure 3. Variation of clearness index during the year 2015.
-0.10 0.20 0.30 0.40 0.50 0.60 0.70
Jan Feb March Apr May June July Aug Sept Oct Nov Dec
Va
lue
s o
f K
t
Months of year
DOI: 10.4236/sgre.2017.812026 400 Smart Grid and Renewable Energy
Figure 4. Variation of the rate of insolation in 2015.
(a) (b)
(c) (d)
(e) (f)
-0.20 0.40 0.60 0.80 1.00 1.20 S/ S0
Months of year
Variations of the rate of insolation during 2015
-200.00 400.00 600.00 800.00 1,000.00 07: 20 08: 30 09: 40 10: 50 12: 00 13: 10 14: 20 15: 30 16: 40 17: 50 Irra di an ce (W /m 2)
Local time (hour)
Daily average profile of global horizontal irradiance - January 2015
-200.00 400.00 600.00 800.00 1,000.00 07: 25 08: 35 09: 45 10: 55 12: 05 13: 15 14: 25 15: 35 16: 45 17: 55 Irra di an ce (W /m 2)
Local time (hour)
Daily average profile of global horizontal irradiance - February 2015
-200.00 400.00 600.00 800.00 1,000.00 07: 20 08: 30 09: 40 10: 50 12: 00 13: 10 14: 20 15: 30 16: 40 17: 50 Irra di an ce (W /m 2)
Local time (hour)
Daily average profile of global horizontal irradiance - March 2015
-200.00 400.00 600.00 800.00 1,000.00 07: 00 08: 15 09: 30 10: 45 12: 00 13: 15 14: 30 15: 45 17: 00 18: 15 Irra di an ce (W /m 2)
Local time (hour)
Daily average profile of global horizontal irradiance - Aprily 2015
-200.00 400.00 600.00 800.00 1,000.00 06: 40 07: 50 09: 00 10: 10 11: 20 12: 30 13: 40 14: 50 16: 00 17: 10 18: 20 Irra di an ce (W /m 2)
Local time (hour)
Daily average profile of global horizontal irradiance - May 2015
-200.00 400.00 600.00 800.00 1,000.00 06: 35 07: 40 08: 45 09: 50 10: 55 12: 00 13: 05 14: 10 15: 15 16: 20 17: 25 18: 30 Irra di an ce (W /m 2)
Local time (hour)
DOI: 10.4236/sgre.2017.812026 401 Smart Grid and Renewable Energy (g) (h)
(i) (j)
[image:8.595.208.540.63.506.2](k) (l)
Figure 5. (a)-(l): Daily average profile of the global irradiance on a horizontal plane for different months of 2015.
PM and 2 PM. Between 10 AM and 4 PM the values of solar radiation exceed 500 Wh/m2. These results are similar to those found by M. Dankassoua et al.
(2017) in the study of global solar radiation conducted in Niamey for the pre-monsoon and the monsoon periods of during the year 2013 [6].
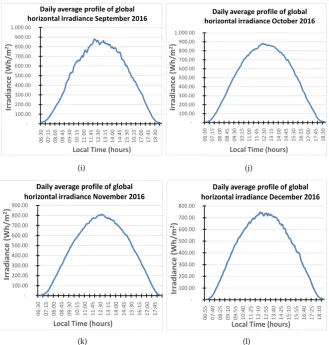
Figures 6(a)-(l) show the daily average profile of the global irradiance on a horizontal plane of the different months in 2016.
The year 2016 presents also an important irradiance in Niamey. These results testify to this strong solar potential. The figures above show characteristics simi-lar to those in 2015 but with maxima which reach the 800 Wh. The potential is as important as that of the study of M. Dankassoua et al. (2017) of the year 2013
[6]. -200.00 400.00 600.00 800.00 1,000.00 06: 45 07: 55 09: 05 10: 15 11: 25 12: 35 13: 45 14: 55 16: 05 17: 15 18: 25 Irra di an ce (W /m 2)
Local time (hour)
Daily average profile of global horizontal irradiance - July 2015
-200.00 400.00 600.00 800.00 06: 50 07: 55 09: 00 10: 05 11: 10 12: 15 13: 20 14: 25 15: 30 16: 35 17: 40 18: 45 Irra di an ce (W /m 2)
Local time (hour)
Daily average profile of global horizontal irradiance - August 2015
-200.00 400.00 600.00 800.00 1,000.00 06: 55 07: 55 08: 55 09: 55 10: 55 11: 55 12: 55 13: 55 14: 55 15: 55 16: 55 17: 55 Irra di an ce (W /m 2)
Local time (hour)
Daily average profile of global horizontal irradiance - September 2015
-200.00 400.00 600.00 800.00 1,000.00 06: 55 07: 55 08: 55 09: 55 10: 55 11: 55 12: 55 13: 55 14: 55 15: 55 16: 55 17: 55 Irra di an ce (W /m 2)
Local time (hour)
Daily average profile of global horizontal irradiance - October 2015
-200.00 400.00 600.00 800.00 1,000.00 07: 00 08: 05 09: 10 10: 15 11: 20 12: 25 13: 30 14: 35 15: 40 16: 45 17: 50 Irra di an ce (W /m 2)
Local time (hour)
Daily average profile of global horizontal irradiance - November 2015
-200.00 400.00 600.00 800.00 1,000.00 07: 15 08: 20 09: 25 10: 30 11: 35 12: 40 13: 45 14: 50 15: 55 17: 00 18: 05 Irra di an ce (W /m 2)
Local time (hour)
DOI: 10.4236/sgre.2017.812026 402 Smart Grid and Renewable Energy (a) (b)
(c) (d)
(e) (f)
(g) (h)
-100.00 200.00 300.00 400.00 500.00 600.00 700.00 800.00 07: 20 08: 05 08: 50 09: 35 10: 20 11: 05 11: 50 12: 35 13: 20 14: 05 14: 50 15: 35 16: 20 17: 05 17: 50 18: 35 Irr ad ian ce ( W h/ m 2)
Local Time (hours)
Daily average profile of global horizontal irradiance January 2016
-100.00 200.00 300.00 400.00 500.00 600.00 700.00 800.00 900.00 07: 25 08: 10 08: 55 09: 40 10: 25 11: 10 11: 55 12: 40 13: 25 14: 10 14: 55 15: 40 16: 25 17: 10 17: 55 18: 40 Irr ad ian ce ( W h/ m 2)
Local Time (hours)
Daily average profile of global horizontal irradiance February 2016
-100.00 200.00 300.00 400.00 500.00 600.00 700.00 800.00 900.00 1,000.00 07: 15 08: 00 08: 45 09: 30 10: 15 11: 00 11: 45 12: 30 13: 15 14: 00 14: 45 15: 30 16: 15 17: 00 17: 45 18: 30 Irr ad ian ce ( W h/ m 2)
Local Time (hours) Daily average profile of global horizontal irradiance March 2016
-100.00 200.00 300.00 400.00 500.00 600.00 700.00 800.00 900.00 06: 10 07: 00 07: 50 08: 40 09: 30 10: 20 11: 10 12: 00 12: 50 13: 40 14: 30 15: 20 16: 10 17: 00 17: 50 18: 40 Irr ad ian ce ( W h/ m 2)
Local Time (hours)
Daily average profile of global horizontal irradiance April 2016
-100.00 200.00 300.00 400.00 500.00 600.00 700.00 800.00 900.00 06: 40 07: 30 08: 20 09: 10 10: 00 10: 50 11: 40 12: 30 13: 20 14: 10 15: 00 15: 50 16: 40 17: 30 18: 20 Irr adi anc e ( W h/ m 2)
Local Time (hours)
Daily average profile of global horizontal irradiance May 2016
-100.00 200.00 300.00 400.00 500.00 600.00 700.00 800.00 900.00 06: 30 07: 20 08: 10 09: 00 09: 50 10: 40 11: 30 12: 20 13: 10 14: 00 14: 50 15: 40 16: 30 17: 20 18: 10 19: 00 19: 50 Irr ad ian ce ( W h/ m 2)
Local Time (hours)
Daily average profile of global horizontal irradiance June 2016
-100.00 200.00 300.00 400.00 500.00 600.00 700.00 800.00 900.00 06: 30 07: 20 08: 10 09: 00 09: 50 10: 40 11: 30 12: 20 13: 10 14: 00 14: 50 15: 40 16: 30 17: 20 18: 10 19: 00 19: 50 Irr ad ian ce ( W h/ m 2)
Local Time (hours)
Daily average profile of global horizontal irradiance July 2016
-100.00 200.00 300.00 400.00 500.00 600.00 700.00 800.00 900.00 1,000.00 06: 30 07: 20 08: 10 09: 00 09: 50 10: 40 11: 30 12: 20 13: 10 14: 00 14: 50 15: 40 16: 30 17: 20 18: 10 19: 00 Irr ad ian ce ( W h/ m 2)
DOI: 10.4236/sgre.2017.812026 403 Smart Grid and Renewable Energy (i) (j)
[image:10.595.209.539.68.414.2](k) (l)
Figure 6. (a)-(l): Daily average profile of the global irradiance on a horizontal plane in 2016.
4.4. Monthly Variations of Average Values of Total Sunning on a
Horizontal and Inclined Plane
The Figure 7 show monthly variations of average values of solar radiation (a) on a horizontal plane and (b) on an inclined (15˚) plane at Niamey during the 2015.
Figure 7 and Figure 8 show the monthly variations of the average values of the total sunning (a) on a horizontal plane and (b) on an inclined (15˚) plane in Niamey point in 2015 and 2016. These values range between 5 and 6 kWh/m2.
The minimal and maximum values are given by Figure 9. April is shown to here the highest values, its maximum sunning being able to exceed the 7 kWh/m2 and
the minimum exceeding the 3 kWh/m2. The low values correspond to the
months of heavy rainfall July to September.
Figure 9 also show that August presents, in the two years, a minimum of low sunning. The decrease is due to the climatic characteristics of this month com-pared to other months. Indeed, the month records the most precipitations in Niger. The presence of the clouds attenuates the value of the sunning on the ground as it is shown in Figures 10(a)-(d).
-100.00 200.00 300.00 400.00 500.00 600.00 700.00 800.00 900.00 1,000.00 06: 30 07: 15 08: 00 08: 45 09: 30 10: 15 11: 00 11: 45 12: 30 13: 15 14: 00 14: 45 15: 30 16: 15 17: 00 17: 45 18: 30 Irr ad ian ce ( W h/ m 2)
Local Time (hours) Daily average profile of global horizontal irradiance September 2016
-100.00 200.00 300.00 400.00 500.00 600.00 700.00 800.00 900.00 1,000.00 06: 30 07: 15 08: 00 08: 45 09: 30 10: 15 11: 00 11: 45 12: 30 13: 15 14: 00 14: 45 15: 30 16: 15 17: 00 17: 45 18: 30 Irr ad ian ce ( W h/ m 2)
Local Time (hours) Daily average profile of global horizontal irradiance October 2016
-100.00 200.00 300.00 400.00 500.00 600.00 700.00 800.00 900.00 06: 30 07: 15 08: 00 08: 45 09: 30 10: 15 11: 00 11: 45 12: 30 13: 15 14: 00 14: 45 15: 30 16: 15 17: 00 17: 45 Irr ad ian ce ( W h/ m 2)
Local Time (hours)
Daily average profile of global horizontal irradiance November 2016
-100.00 200.00 300.00 400.00 500.00 600.00 700.00 800.00 06: 55 07: 40 08: 25 09: 10 09: 55 10: 40 11: 25 12: 10 12: 55 13: 40 14: 25 15: 10 15: 55 16: 40 17: 25 18: 10 Irr ad ian ce ( W h/ m 2)
Local Time (hours)
DOI: 10.4236/sgre.2017.812026 404 Smart Grid and Renewable Energy (a) (b)
Figure 7. Monthly variations of average values of total sunning (a) on a horizontal plane and (b) on an inclined (15˚) plane in Niamey in 2015.
[image:11.595.214.536.263.393.2](a) (b)
Figure 8. Monthly variations of average values of total sunning (a) on a horizontal plane and (b) on an inclined (15˚) plane in Niamey in 2016.
(a) (b)
Figure 9. Monthly variations of the Maximum, Average and Minimum of total sunning on a horizontal plane in 2015 and in 2016.
4.5. Influence of the Sky Conditions on the Solar Radiation
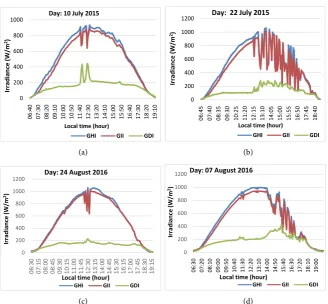
Figures 10(a)-(d) show the impact of the clouds and dust on the solar radiation. On figures 10, the passage of clouds between 11 am to 1 pm in (Figure 10(a)) and 11 am to 7 pm in (Figure 10(c)) is felt to the measure of the radiation. In the same way at the moment of rainfall (Figure 10(b) and Figure 10(d)) be-tween 12 am to 6 pm, three radiations: Global horizontal (GH), Global tilted (GI) and the Diffuse one (D) are influenced by the presence of dust and rain.
0 1000 2000 3000 4000 5000 6000 7000
Irra
di
an
ce
(W
/m
2/d
ay)
Months of the year Monthly Global horizontal irradiance 2015
GHI Fluctuation
0 1000 2000 3000 4000 5000 6000 7000
Irr
ad
ian
ce (
W
/m
2/day)
Month of the year Monthly Global inclined irradiance 2015
GII Fluctuation
-1,000 2,000 3,000 4,000 5,000 6,000 7,000
Irr
ad
ian
ce (
W
/m
2/day)
Months of the year
Monthly Global horizontal irradiance 2016
GHI Fluctuation
0 1,000 2,000 3,000 4,000 5,000 6,000 7,000
Irr
ad
ian
ce (
W
/m
2/day
Months of the year
Monthly Global inclined irradiance 2016
GII Fluctuation
0 1000 2000 3000 4000 5000 6000 7000 8000
Irr
ad
ian
ce (
W
/m
2/da
y
Months of the Day
Global horizontal irradiance 2015
Min Max Average
0 1000 2000 3000 4000 5000 6000 7000 8000
Irra
di
an
ce
(W
/m
2/d
ay
Months of year Global horizontal Irradiance 2016
[image:11.595.209.539.437.576.2]DOI: 10.4236/sgre.2017.812026 405 Smart Grid and Renewable Energy (a) (b)
[image:12.595.208.537.65.369.2](c) (d)
Figures 10. The impact of the clouds and dust on the solar radiation: In 2015, (a): be-tween 11 am - 1 pm, passage of the clouds; (b): bebe-tween 12 am and 5 pm, rain and dust. In 2016; (c): between 11 am - 1 pm passage of clouds; (d): between 1 pm and 7 pm, rain and dust.
There is also an increase in Diffuse when the sky is overcast. These results con-firm those obtained by Abdoulatif Bonkaney et al. (2017) [9].
When the sky is clear, the radiation is less disturbed. Figures 11(a)-(d) show the evolution of the three radiations during the day when the sky is clear.
The figures above inquire the optical state of the atmosphere. When it is slightly polluted the curves appear smoother. This is the case of the Figure 11(b)
where the atmosphere is purified of its aerosols by the action of rainwater from the wintry period in July through August.
4.6. Seasonal Variations of Total Sunning on Horizontal Plane and
Tilted Plane
Figure 12(a), Figure 12(b) show the seasonal variations of the total sunning on the horizontal Plane (GHI) and on the tilted plane (GII) in 2015 and 2016. These seasonal variations had an influence on the energy received by the solar panels.
Figure 12(a), Figure 12(b) show the monthly variations of the total sunning on a horizontal plane and on an inclined plane during the year 2015 and the year 2016. We note that from September to March, the daily irradiation is greater on the 15˚ inclined plane than on the horizontal plane. By cons, between March and September the phenomenon is reversed.
0 200 400 600 800 1000 06: 40 07: 30 08: 20 09: 10 10: 00 10: 50 11: 40 12: 30 13: 20 14: 10 15: 00 15: 50 16: 40 17: 30 18: 20 19: 10 Irra di an ce (W /m 2)
Local time (hour)
Day: 10 July 2015
GHI GII GDI
0 200 400 600 800 1000 1200 06: 45 07: 40 08: 35 09: 30 10: 25 11: 20 12: 15 13: 10 14: 05 15: 00 15: 55 16: 50 17: 45 18: 40 Irra di an ce (W /m 2)
Local time (hour) Day: 22 July 2015
GHI GII GDI
0 200 400 600 800 1000 1200 06: 30 07: 15 08: 00 08: 45 09: 30 10: 15 11: 00 11: 45 12: 30 13: 15 14: 00 14: 45 15: 30 16: 15 17: 00 17: 45 18: 30 19: 15 Irra di an ce (W /m 2)
Local time (hour)
Day: 24 August 2016
GHI GII GDI
0 200 400 600 800 1000 1200 06: 30 07: 20 08: 10 09: 00 09: 50 10: 40 11: 30 12: 20 13: 10 14: 00 14: 50 15: 40 16: 30 17: 20 18: 10 19: 00 Irra di an ce (W /m 2)
Local time (hour)
Day: 07 August 2016
DOI: 10.4236/sgre.2017.812026 406 Smart Grid and Renewable Energy (a) (b)
[image:13.595.208.539.62.393.2](c) (d)
Figures 11. Evolution of the three radiations during the day, (a), (b), (c) in clear sky; (d) in clear sky and shades at 5 pm.
[image:13.595.209.527.446.586.2](a) (b)
Figure 12. (a), (b): Seasonal variations of the total sunning on the horizontal plane (GHI) and on an inclined plane (GII) in 2015 and 2016.
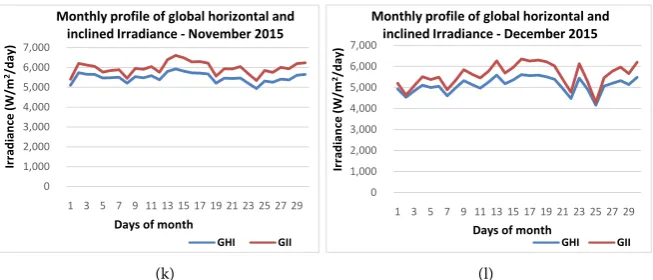
Figures 13(a)-(l) show daily variations of the total sunning on a horizontal plane and on an inclined plane during each month in 2015.
Figures 14(a)-(l) show daily variations of the total sunning on a horizontal plane and on an inclined plane during each month in 2016.
Figure 13 and Figure 14 show how the global sunning of the two years evolves on a horizontal plane (GHI) and on an inclined plane at 15˚ (GII). From
0 200 400 600 800 1000 07: 30 08: 20 09: 10 10: 00 10: 50 11: 40 12: 30 13: 20 14: 10 15: 00 15: 50 16: 40 17: 30 18: 20 Irra di an ce (W /m 2)
Local time (hour)
Day: 05 Feb 2016
GHI GII GDI
0 200 400 600 800 1000 1200 06: 30 07: 25 08: 20 09: 15 10: 10 11: 05 12: 00 12: 55 13: 50 14: 45 15: 40 16: 35 17: 30 18: 25 Irra di an ce (W /m 2)
Local time (hour)
Day: 27 Sept 2016
GHI GII GDI
0 100 200 300 400 500 600 700 800 900 1000 06: 45 07: 35 08: 25 09: 15 10: 05 10: 55 11: 45 12: 35 13: 25 14: 15 15: 05 15: 55 16: 45 17: 35 18: 25 19: 15 Irr ad ia nc e ( W /m 2)
Local time (hour)
Day: 14 July 2015
GHI GII GDI
0 100 200 300 400 500 600 700 800 900 1000 07: 00 08: 00 09: 00 10: 00 11: 00 12: 00 13: 00 14: 00 15: 00 16: 00 17: 00 18: 00 Irr ad ia nc e ( W /m 2)
Local time (hour) Day: 01 May 2015
GHI GII GDI
-1,000.00 2,000.00 3,000.00 4,000.00 5,000.00 6,000.00 7,000.00 Irra di an ce (W /m 2/d ay)
Months of year Year 2015 GH GI -1,000.00 2,000.00 3,000.00 4,000.00 5,000.00 6,000.00 7,000.00 Ja n
Feb Mar Apr May June lyJu Aug Sept Oct Nov Dec
Ir rad ian ce ( W /m 2/d a y)
Months of year Year 2016
DOI: 10.4236/sgre.2017.812026 407 Smart Grid and Renewable Energy (a) (b)
(c) (d)
(e) (f)
(g) (h)
(i) (j) 0
2,000 4,000 6,000 8,000
1 3 5 7 9 11 13 15 17 19 21 23 25 27 29 31
Irra
di
an
ce
(W
/m
2/d
ay)
Days of the month Monthly profile of global horizontal and
inclined Irradiance - January 2015
GHI GII
0 2,000 4,000 6,000 8,000
1 3 5 7 9 11 13 15 17 19 21 23 25 27
Irra
di
an
ce
(W
/m
2/d
ay)
Days of mounth
Monthly profile of global horizontal and inclined Irradiance - February 2015
GHI GII
0 1,000 2,000 3,000 4,000 5,000 6,000 7,000 8,000
1 3 5 7 9 11 13 15 17 19 21 23 25 27 29
Irra
di
an
ce
(W
/m
2/d
ay
Days of month
Monthly profile of global horizontal and inclined Irradiance - March 2015
GHI GII
0 1,000 2,000 3,000 4,000 5,000 6,000 7,000 8,000
1 3 5 7 9 11 13 15 17 19 21 23 25 27 29
Irra
di
an
ce
(W
/m
2/d
ay)
Days of month
Monthly profile of global horizontal and inclined Irradiance - April 2015
GHI GII
0 1,000 2,000 3,000 4,000 5,000 6,000 7,000 8,000
1 3 5 7 9 11 13 15 17 19 21 23 25 27 29
Irra
di
an
ce
(W
/m
2/d
ay)
Days of month
Monthly profile of global horizontal and inclined Irradiance - May 2015
GHI GII
0 1,000 2,000 3,000 4,000 5,000 6,000 7,000
1 3 5 7 9 11 13 15 17 19 21 23 25 27 29
Irra
di
an
ce
(W
/m
2/d
ay)
Days of month
Monthly profile of global horizontal and inclined Irradiance - June 2015
GHI GII
0 2,000 4,000 6,000 8,000
1 3 5 7 9 11 13 15 17 19 21 23 25 27 29 31
Irra
di
an
ce
(W
/m
2/d
ay)
Days of month
Monthly profile of global horizontal and inclined Irradiance - July 2015
GHI GII
0 2,000 4,000 6,000 8,000
1 3 5 7 9 11 13 15 17 19 21 23 25 27 29 31
Irra
di
an
ce
(W
/m
2/d
ay)
Days of month
Monthly profile of global horizontal and inclined Irradiance - August 2015
GHI GII
0 2,000 4,000 6,000 8,000
1 3 5 7 9 11 13 15 17 19 21 23 25 27 29
Irra
di
an
ce
(W
/m
2/d
ay)
Days of month
Monthly profile of global horizontal and inclined Irradiance - Sptember 2015
GHI GII
0 2,000 4,000 6,000 8,000
1 3 5 7 9 11 13 15 17 19 21 23 25 27 29 31
Irra
di
an
ce
(W
/m
2/d
ay)
Days of month Monthly profile of global horizontal and
inclined Irradiance - October 2015
DOI: 10.4236/sgre.2017.812026 408 Smart Grid and Renewable Energy (k) (l)
Figure 13. (a)-(l): Daily variations of the total sunning on a horizontal plane and on a tilted plane (15˚) in 2015.
(a) (b)
(c) (d)
(e) (f)
0 1,000 2,000 3,000 4,000 5,000 6,000 7,000
1 3 5 7 9 11 13 15 17 19 21 23 25 27 29
Irra
di
an
ce
(W
/m
2/d
ay)
Days of month
Monthly profile of global horizontal and inclined Irradiance - November 2015
GHI GII
0 1,000 2,000 3,000 4,000 5,000 6,000 7,000
1 3 5 7 9 11 13 15 17 19 21 23 25 27 29
Irra
di
an
ce
(W
/m
2/d
ay)
Days of month
Monthly profile of global horizontal and inclined Irradiance - December 2015
GHI GII
0 1,000 2,000 3,000 4,000 5,000 6,000 7,000
1 3 5 7 9 11 13 15 17 19 21 23 25 27 29
Irra
di
an
ce
(W
/m
2/d
ay)
Days of month
Monthly profile of global horizontal and inclined Irradiance - January 2016
GHI GII
0 1,000 2,000 3,000 4,000 5,000 6,000 7,000 8,000
1 3 5 7 9 11 13 15 17 19 21 23 25 27 29
Irra
di
an
ce
(W
/m
2/d
ay)
Days of month
Monthly profile of global horizontal and inclined Irradiance - February 2016
GHI GII
0 1,000 2,000 3,000 4,000 5,000 6,000 7,000 8,000
1 3 5 7 9 11 13 15 17 19 21 23 25 27 29 31
Irra
di
an
ce
(W
/m
2/d
ay)
Days of Month
Monthly profile of global horizontal and inclined Irradiance - March 2016
GHI GII
0 2,000 4,000 6,000 8,000 10,000
1 3 5 7 9 11 13 15 17 19 21 23 25 27 29
Irra
di
an
ce
(W
/m
2/d
ay)
Days of month Monthly profile of global horizontal and
Inclined irradiance - April 2016
GHI GII
0 1,000 2,000 3,000 4,000 5,000 6,000 7,000 8,000
1 3 5 7 9 11 13 15 17 19 21 23 25 27 29 31
Irra
di
an
ce
(W
/m
2/d
ay)
Days of Month Monthly profile of global horizontal and
Inclined irradiance - May 2016
GHI GII
0 1,000 2,000 3,000 4,000 5,000 6,000 7,000 8,000
1 3 5 7 9 11 13 15 17 19 21 23 25 27 29
Irra
di
an
ce
(W
/m
2/d
ay)
Days of month Monthly profile of global horizontal and
inclined Irradiance - June 2016
DOI: 10.4236/sgre.2017.812026 409 Smart Grid and Renewable Energy (g) (h)
(i) (j)
[image:16.595.209.540.68.495.2](k) (l)
Figure 14. (a)-(l): Daily variation of the total sunning on a horizontal plane and on a tilted plane (15˚) in 2015.
January to February, GII is above that representing sunning on the horizontal plane (GHI). There is a gradual decrease in GII elevation over GHI. Towards the end of March to beginning of April, the two curves coincide. Towards the end of April, the phenomenon begins to reverse: the GHI is above that of the sunning on the inclined plane (GII) until the beginning of September. Towards the end of September to the beginning of October, the two curves merge. Towards the end of October, the phenomenon is reversed again: the sunning curve on the in-clined plane (GII) is above that of the sunning on the horizontal plane until the end of December.
As shown in Figure 11 the phenomenon can be classified in two periods. One period when GII is above GHI, it is from September to March. During this pe-riod a solar panel in tilted position of 15˚ receives more solar energy than a solar
0 1,000 2,000 3,000 4,000 5,000 6,000 7,000 8,000
1 3 5 7 9 11 13 15 17 19 21 23 25 27 29 31
Irra
di
an
ce
(W
/m
2/d
ay)
Days of month
Monthly profile of global horizontal and inclined Irradiance - July 2016
GHI GII
0 1,000 2,000 3,000 4,000 5,000 6,000 7,000 8,000
1 3 5 7 9 11 13 15 17 19 21 23 25 27 29 31
Irra
di
an
ce
(W
/m
2/d
ay)
Days of month
Monthly profile of global horizontal and inclined Irradiance - August 2016
GHI GII
0 2,000 4,000 6,000 8,000
1 3 5 7 9 11 13 15 17 19 21 23 25 27 29
Irra
di
an
ce
(W
/m
2/d
ay)
Days of month
Monthly profile of global horizontal and inclined Irradiance - September 2016
GHI GII
0 2,000 4,000 6,000 8,000
1 3 5 7 9 11 13 15 17 19 21 23 25 27 29 31
Irra
di
an
ce
(W
/m
2/d
ay)
Days of month
Monthly profile of global horizontal and inclined Irradiance - October 2016
GHI GII
0 1,000 2,000 3,000 4,000 5,000 6,000 7,000
1 3 5 7 9 11 13 15 17 19 21 23 25 27 29
Irra
di
an
ce
(W
/m
2/d
ay)
Days of month
Monthly profile of global horizontal and inclined Irradiance - November 2016
GHI GII
0 1,000 2,000 3,000 4,000 5,000 6,000 7,000
1 3 5 7 9 11 13 15 17 19 21 23 25 27 29 31
Irra
di
an
ce
(W
/m
2/d
ay)
Days of month
Monthly profile of global horizontal and inclined Irradiance - December 2016
DOI: 10.4236/sgre.2017.812026 410 Smart Grid and Renewable Energy
panel on a horizontal plane. The other period, when GII is below GHI, it is from March to mid-September. During this period the plane sensor receives more ir-radiation than a tilted sensor of 15˚.
While referring to the ecliptic trajectory of the earth around the sun, the first period corresponds to the moments when the sun is in a position closer to the earth (from September to March) and the second period at the times when the sun is further away from the earth (March-September). It is also noted that when the variation is maximum March 21st, September 22nd, the two curves confused.
When this variation is worthless both curves are alternate with a maximum of variation (Figure 12).
These figures show that the optimization of a solar panel depends on the sea-son of the year and its angle of inclination. A fixed slope is perhaps not the good option for a maximum exploitation of a solar panel. A sensor provided with a solar follower is much more profitable.
5. Conclusions
The evaluation of the solar potential of Niamey, over the years 2015 and 2016, shows that this potential is enormous. The sunning varies between 5.1 kWh/m2
and 6.3 kWh/m2. The months of December, January and August are the least
sunny, while those of April, May, September and October are the sunniest. The duration of average insolation is between 8 to 9 hours. The sunning depends on the weather conditions. It is attenuated by the clouds and the aerosols contained in the atmosphere.
The recorded considerable irradiations, the determined strong average insola-tion and the acceptable values of the clearness index of our site of study confirm the importance of the solar radiation of Niamey area [6] [9]. The results ob-tained through our measurements show that Niamey has a considerable solar potential despite the disturbances of clouds and dust. This sunning allows many energy applications mainly: photovoltaic and thermal. Niamey solar potential is comparable to that of Nouakchott and Dakar obtained by B. Ould Bilal et al. (2007) also located in the Sahelian band [8].
The limited exploitation of less than 10% of this potential per day could make it possible to fully cover Niger’s annual energy needs. Solar energy could serve as a lever of Niger’s economic development.
References
[1] Yahya, A.O.M. and Youm, O.A.M.I. (2008) Study and Modeling of a Photovoltaic Generator. Revue of Renewable Energies, 11, 473-448.
[2] Colleen, S. (2009) Renewable Energy Teaching Manual. 123.
http://www.electronique-diffusion.fr/dl/manuel_%20enseignement.pdf
[3] Africa Progress Panel (2015) Energy, Planet and Population. 2015 Progress Report on Africa, Africa Progress Panel, Geneva.
[4] Lahache, C. (2017) Solar Energy. 10.
DOI: 10.4236/sgre.2017.812026 411 Smart Grid and Renewable Energy
[5] Ould Bilal, B., Sambou, V., Kebe, C.M.F., Ndongo, M. and Ndiaye, P.A. (2007) Study and Modeling of the Solar Potential of the Nouakchott and Dakar Sites.
Science, 7, 57-66.
[6] Dankassoua, M., Madougou, S., Aboubacar, A. and Foulani, A. (2017) Study of the Global Solar Radiation in Niamey from the Pre-Monsoon and the Monsoon Period of the Year 2013 (May to October). Review of Renewable Energies, 20, 131-146. [7] Cree of the Stork (CDC) (2009) Energy Balance and Prospects for an Ambitious
Energy Policy in Niger. 27 Pages.
http://www.cridecigogne.org/sites/default/files/Bilan-et-perspectives-energetiques-a u-Niger-Par-CrideCigogne.pdf
[8] Ould Bilal, B., Sambou, V., Kébé, C.M.F., Ndongo, M. and Ndiaye, P.A. (2007) Study and Modeling of the Solar Potential of the Nouakchott and Dakar Sites.
Journal of Sciences, 7, 57-66.
[9] Bonkaney, A., Madougou, S. and Adamou, R. (2017) Impacts of Cloud Cover and Dust on the Performance of Photovoltaic Module in Niamey. Journal of Renewable Energy, 2017, 9. https://doi.org/10.1155/2017/9107502
[10] Trahi, F. (2011) Prediction of Global Solar Irradiation for the Tizi Ouzou Region by Artificial Neural Networks: Application for the Sizing of a Photovoltaic Installation for the Supply of the Research Laboratory LAMPA. Memory of Magister in Elec-tronics, Mouloud Mammeri University of Tizi Ouzou, Algeria, 113.
[11] Kipp & Zonen (2012) Pyranometer CMP 3, V1007 User Manual.
http://www.kippzonen.com/
[12] Kipp & Zonen (2015) METEON Data Logger Manual. 13 Pages.