Defining the concept of creativity
60
0
0
Full text
(2) Introduction History of creativity research Creativity has been a field of study ever since Graham Wallas proposed a five stage model of the creative process (Wallas, 1926). But why is creativity an important field of study? According to Kaufman and Beghetto (2004), creativity has been associated with a wide range of subjects. This includes the more obvious field of arts, as well as less obvious fields such as economics and education. Furthermore, creativity has been deemed a desirable trait for graduate students, and it has been named “the most important economic resource of the 21st century” (Kaufman & Beghetto, 2004). Lastly, creativity has been identified as an important component in problem solving and other cognitive abilities, as well as being a predictor for educational success, and mental and social well-being (Plucker, Beghetto & Dow, 2004). When creativity first became a subject of scientific interest in the 1950s, the focus was on a few small questions: creative personality and creative thinking techniques. Several decades later, the social aspect of creativity was added to this focus (Hennessey & Amabile, 2010). However, from the 1990s onwards, the field started to become more diversified. While this has significantly increased the understanding of creativity, it did come with a price. The field has simply become too big and too splintered for anyone to keep track of all the advances. A paper on creative personality may result in conclusions that are relevant to the entire field, but another researcher focused on the social aspects of creativity may ignore the conclusions altogether because it is too far away from his own focus. The diversity of the field became apparent when Hennessey and Amabile started their literary review. They asked 26 colleagues for suggestions on papers to include in the review. They received a response from 21 of these colleagues, resulting in a total of 110 suggestions. Out of these 110 suggestions, a mere seven were suggested by two colleagues, and only a single paper was put forth by three (Hennessey & Amabile, 2010). This complete lack of consensus on what research is deemed important within the field, leaves it with a major problem: There is no agreement on what even constitutes creativity. Without a proper definition, researchers of creativity first have to define creativity itself before any research can be done. Many researchers do not define creativity at all, as is shown by a literary review done by Plucker, Beghetto & Dow (2004). They took 90 papers with ‘creativity’ in the title, out of which only 38% defined what creativity was. That means that a staggering 62% studied creativity without having defined what it is they are studying. Another example of the lack of definition is the widespread use of the Torrance Tests of Creative Thinking, or TCTT for short. These tests, developed by Ellis Paul Torrance (1966), consist of a large number of different tasks. In these tasks, participants are presented with a stimulus, to which they have to respond in a number of different ways. The reasoning was that the more different responses, different types of responses and the rarity thereof define how creative a person is. Torrance summarised these factors in four different categories: Fluency, Flexibility, Originality and Elaboration (Torrance, 1966). However, ample research since then has shown that the tests do not account for most of the variance within the responses (Almeida, Prieto, Ferrando, Oliveira, Ferrándiz, 2008; Kim, 2006). For a test that has been translated into more than 35 different languages (Kim, 2006), it is at the 2.
(3) very least surprising to find that it does not measure what it is designed to measure. What is perhaps even more surprising is the fact that Guilford, based on whose work Torrance created the TCTT, wrote a definition in 1950 that already seemed uncertain of itself (Runco & Jaeger, 2012): In its narrow sense, creativity refers to the abilities that are most characteristic of creative people. Creative abilities determine whether the individual has the power to exhibit creative behavior to a noteworthy degree. Whether or not the individual who has the requisite abilities will actually produce results of a creative nature will depend upon his motivational and temperamental traits. To the psychologist, the problem is as broad as qualities that contribute significantly to creative productivity. In other words, the psychologist’s problem is that of creative personality. (Runco & Jaeger, 2012, pp. 94). There is a lot of ambiguity within this definition. It starts off by saying that “creativity refers to the abilities [...] of creative people.” The definition continuously refers back to itself, making it rather difficult to establish what creativity actually means here. It seems that even in its heyday, the TCTT was not up to its own tasks. One of the criticisms of the Torrance test is that assigning a single creativity score to describe so many different test results is not a good indication of how creative someone is (Kim, 2006). The test scores need to be broken into several aspects of creativity, much like what Spearman did more than a century ago for the concept of IQ (Spearman, 1904). Like intelligence, creativity is a concept too broad to capture in a single score, and thus creativity testing needs to focus on aspects rather than a whole. In 1953, Morris Stein was one of the first to realise this, after which he offered some important ideas which would further the field of creativity research (Runco & Jaeger, 2012): 1. Creative work tends to be useful for some group; thus, social judgment is involved 2. Creative insight ‘‘arises from a reintegration of already existing materials or knowledge, but when it is completed it contains elements that are new” 3. It is important to separate personal from historical creativity It is the third point here that is of paramount importance. However, it was not until 1990 that someone would interpret this to form a new definition. Margaret Boden defined H-creativity and P-creativity, where the H stands for historical, and the P for personal, exactly as Stein described it back in 1953. Boden states that H-creativity is related to an idea that is entirely new to humanity as a whole, whereas P-creativity is an idea that is merely new to the person, but may already have been conceived by someone else (Boden, 2003). This separation means that there is more focus in the research. To society as a whole, H-creativity is the most important, but it cannot be studied in practice because it occurs very rarely. On the other hand, P-creativity may not be as interesting to society, but it does not deter from the fact that for the one participant being studied, the idea he came up with is entirely novel. This is therefore the type of creativity that can be studied. In two stages, Beghetto and Kaufman adapted the concepts of P and H-creativity into their four C model of creativity (Beghetto & Kaufman, 2007; Kaufman & Beghetto, 2009). The model consists of four different views of creativity: - Big C: This replaces H-creativity. This type of creativity only applies to what is completely new for the human race, and is thus most closely associated with genius. 3.
(4) -. -. Little C: This replaces P-creativity. This is creativity in every day problem solving. Mini C: Creativity associated with learning. When absorbing information, humans do not simply absorb it, but rather they process it through a filter of personal experience. How creative one is in applying this filter is referred to as mini C. Pro C: Pro C, or professional creativity, is creativity at the workplace. Some people may be professionally active as creators, but they do not fall under the big C category because some of their work may already exist elsewhere in humanity. On the other hand, it is not the everyday creativity commonly associated with little C. A new category was therefore made, named pro C.. Is this distinction enough to properly separate all fields of research within creativity? Probably not. Some of the factors mentioned in the introduction, such as creative personality, or problem solving skills, can be said to fall under one of the four Cs in the four C model. However, one cannot separate creativity within a social setting from creativity in a strictly personal environment. In 2010, Hennessey and Amabile proposed a model consisting of a number of concentric circles, visible in Figure 1. These circles represent the different levels of research, starting at the strictly neurological level and then moving outward to bigger settings. Of course, it needs to be noted that research rarely keeps to a single level of this model. It is difficult to research creativity in a social environment without looking at the groups present within that social environment. These groups then obviously consist of individuals, but by going down too many levels, the focus of the research changes. By combining this model with the four C model made by Kaufman and Beghetto, it is at least possible again to focus on an aspect of creativity rather than simply diving into the research without a proper definition. One can for example study pro C (professional creativity) at the individual level. Is this a proper definition of creativity though? Sure, the direction is back, and researchers can at least point at the models and say, “this is what we are focusing on.” However, does this really define creativity? For example, what components does creativity consist of? An answer to this question comes from perhaps the most unlikely of corners. Graeme Ritchie (2007) studied the creativity of machines. He realised that to study machine creativity, creativity first had to be defined. Ritchie created a number of mathematical formulae based on three variables: - Typicality: How well does a creation fit within a class based on an archetype? - Novelty: To what extent is a creation new; how dissimilar is it to the other creations within its class? - Quality: How does the quality of the creation match up to its counterparts within its class? 4.
(5) By combining these variables, he was able to create eighteen different criteria which a creative machine could meet. However, since these criteria were all mathematical formulae rather than actual words, they appeared to be useless to the field of human creativity research. That is, until Anna Jordanous published her Ph.D. dissertation (Jordanous, 2012). Her prime goal, like Ritchie’s, was to provide a method for measuring machine creativity. However, as will become apparent later, Jordanous’ results are generalisable to humans as well, whereas Ritchie’s proposed criteria were not. Jordanous attempted to identify a number of components of creativity by analysing a large number of scientific texts. More importantly, by employing the method of text analysis, the components were established in an objective manner. On the one hand, there was a corpus of articles that had to do, in one way or another, with creativity in machinery. Combinations such as ‘computational creativity’ and ‘creative system’, among others, were used to select texts for the corpus of creativity articles. On the other hand, there was a corpus of texts which had nothing to do with creativity. By comparing the two corpora, Jordanous analysed which words appeared more often in texts about creativity than they did in texts on unrelated subjects. By then grouping the resulting words, Jordanous translated the 18 formulae proposed by Ritchie into 14 components of creativity, as can be seen in Figure 2.. With this definition established, researchers can now say: “This study is about the ‘Generation of Results’ aspect within the Pro-C domain, viewed at a personal level.” Surely, this kind of wording is enough to have direction in the field again? It should be, because now a plethora of subfields has been described (4x7x14 = 392 possible levels). However, the issue with Jordanous’ method is, it is an analysis of purely scientific texts. Not every person in the world is capable of writing scientific texts. So while her research does leave us with a properly outlined definition of all the components of creativity, it is based on texts written by scholarly trained men and women. However, is language not of all people rather than only the scholarly trained among us? Oxford dictionary defines language as “The method of human communication, either spoken or written, consisting of the use of words in a structured and conventional way.” This includes all humans, so perhaps it is time to find out what a more varied cross section of the population would define as creativity. The problem The problem here, as it has been throughout creativity research, is how to define creativity. Thus far, the criteria by which to judge creativity have been idiosyncratic. Graeme Ritchie used typicality, novelty and quality as the base variables by which creativity was to be judged (Ritchie, 2007). However, while seemingly fitting of the concept of creativity, these variables were selected by Ritchie himself. They are justified by claiming a “widespread 5.
(6) support” in discussions of creativity, but they have no scientific basis. Similarly, Teresa Amabile claims novelty and value as the “contemporary approach” (Amabile, 1996), but again there is no justification of these factors. If one then bases the work on unjustified variables, is that work scientifically justified? It is time to go back to the basis: what is creativity? To define creativity, perhaps one should not look at it analytically, but rather linguistically. After all, when something is to be judged as creative, it is done by all people. There are no licensed judges of creativity. Therefore, one must ask what all people see as creative. In this thesis, an attempt will be made to define creativity and its subsections in a psycholinguistic manner. The questions that need to be answered before creativity can be defined, are: - What words do people commonly associate with creativity? Creativity is a broad concept, which means there is a wide variety of words that can be associated with creativity. Which words are strongly associated with creativity? - How do people categorise words that are associated with creativity? After the first question has been answered, the resulting list of words needs to be divided up into categories. Which categories do participants assign, and is there a trend to be seen? By answering these two questions, the overarching question that this thesis investigated was answered: What are the components of creativity? The aforementioned questions were answered by employing several methods that are not very common within psychology. Before fully describing the methods used in this thesis, the research techniques must be explained in more detail. Free association To answer the first question, the technique of free association was used. Free association was first devised by Sigmund Freud in 1897, to be used in his psychoanalysis (Thurschwell, 2009). Later, free association was seen in close relation to the spreading activation model of semantic processing, first conceived by Collins and Loftus (1975). This model is seen as a network of interconnected nodes, in which each node represents a word or phrase. When a word is recalled in memory, its corresponding node is of course activated first. The nodes that are activated next are the nodes corresponding to the terms most closely related to the word that was remembered first. One may imagine a ripple effect in the node network. When a rock is thrown into a pond, the precise spot where the rock lands is activated first. After that, the closer a chosen location is to the landing spot, the sooner it will experience the ripple. This is a model of spreading activation. In relation to free association, it makes sense that when a participant is asked to say the first thing that comes to mind, the participant will utter the term most closely related to the stimulus presented. In an experiment, the technique of free association can be used to investigate what participants most closely relate to a chosen stimulus. For example, Guerrero et al. (2010) used the free association technique to study the culturally different perceptions of the term ‘traditional’, more precisely in a food context. Participants were asked by the experimenters to concentrate on food-related matters when providing their answers. Each participant was asked to elicit three different 6.
(7) words, within a maximum of 30 seconds. In this manner, the experimenters were able to acquire a set of 1743 responses, which was then used for further processing relevant for their study. It is important to note a few pitfalls that free association may suffer from. Firstly and foremostly, there is a big difference between continuous and discrete free association. In continuous association, a participant is free to recall as many associations as he can, the responses may be linked together. This means that when a participant gives five answers in quick succession, the last answer given may not be associated with the stimulus given by the experimenter, but rather with the answer given before the last one. In discrete free association, the participant is only allowed one answer per stimulus, meaning each answer should theoretically be associated with the experimenter’s stimulus rather than an answer given previously by the participant (Nelson, McEvoy & Schreiber, 2004). Aside from the mode of association, the primary language of the participant is important as well. Schmitt and Meara (1997) noted that there is a large different in the words recalled by second language speakers when compared to native speakers. The associations produced by native speakers have their basis in the semantic relations between words, whereas participants associating in a language that is not their mother tongue, they are more likely to produce so-called “clang associations”, similar-sounding words. In conclusion, creating a free association method is a risky undertaking, but when done well, it can provide critical information. Card sorting The second research question posed was answered by using the method of card sorting. Card sorting (not to be confused with the Wisconsin Card Sorting Task) is a method to allow participants to group together a set of individual concepts. The goal of a Card Sorting study is to create a representation of a mental model, because it requires participants to reveal their own representation of a hierarchical structure. Each participant is handed a set of index cards containing items, which he is then asked to group together. In an open card sorting study, the participant is allowed to create his own categories, leaving more freedom. Contrary, a closed card sorting study has preassigned categories, but since the goal of the study is to allow participants to create their own categorisation, that will not be used here. Card sorting is described by Harloff and Coxon (2007) as “a convenient way to evaluate how people organise a set (...) of well-defined entities (items)”. The method is convenient for both researchers and participants because there is no grading or scaling required. The earliest reference to the method is probably a facial-expression sorting study carried out by Hulin and Katz in 1935 (Coxon, 1999). However, due to its prevalent nature, it makes sense to apply hierarchical knowledge representation to a wider array of subjects. Because information technology strives for a hierarchical representation much like that found in humans, card sorting has been widely applied to usability testing. For example, Levi and Conrad (1997) used the method to investigate the similarity of tasks that can be performed on major websites. Using the results, they constructed a framework to which websites should adhere if they are to be user-friendly. Because card sorting experiments can be administered without the use of written language, children as young as eight years old can participate in the 7.
(8) experiments. A group of researchers employed by Microsoft used the method to create menu structures for a word processing program for children (Hanna, Risden, Czerwinski, Alexander, 1999). They asked children to group together tasks that can be performed with a word processor. By doing so, the children revealed which tasks they thought should be grouped under the same menu, thus creating a hierarchical menu structure. There are some issues that need to be observed when using card sorting as a research method. Hinkle (2008) lists four issues that need to be taken into account before carrying out a card sorting study. The first of these is dual group membership. In this study, and in card sorting in general, some items can possibly be placed in more than one group. Since each item is present exactly once, there is an element of forced choice. The results from one participant taking part in the card sorting study will not help much, but just like with association, there is strength in numbers. The more participants place two concepts together, the more closely related these concepts are in the mind of the population. As an example, view the following five words: - Keyboard - Printer - Mouse - Cat - Dog Keyboard and printer are likely to be placed together, because they are both computer hardware. Similarly, cat and dog are likely to be put together because they are both animals. Now, for mouse, there is a forced choice. Would one place mouse with the computer hardware, or with the animals? If 80% of the participants place mouse with the computer hardware, then the association between mouse and the other two words in that category is stronger than that between mouse and the other animals. By doing this for all the concepts in the study, the relations between words are revealed. The second issue that Hinkle lists is the so-called “miscellaneous group”. During the study, participants may be inclined to place ambiguous items together in a pile, thus unintentionally creating an extra category. By explaining the element of forced choice, this issue should be circumvented. If an item cannot be placed in any category, it simply forms a category on its own. The last two issues, individual differences and semantic meaning can be taken together for this study, because they are both actual goals of the study. Because this study strives for a representation of the concept of creativity given by more people than just those scholarly trained, individual differences are a positive. Thus, individual differences should be cherished. Similarly, Hinkle warns that semantic meaning may interfere with the primary goal of the study, but since semantic meaning is the primary goal, different interpretations of items should also be cherished. It seems therefore that card sorting is a perfect method for the analysis of complex linguistic concepts.. Method The two research questions were answered using a study built up in three parts. In the first study, participants were asked simply what words they associated with creativity. 8.
(9) Combined with an excerpt taken from the list constructed by Anna Jordanous, this resulted in a list of words that was then taken to the second part of the study. In this second part, participants were asked to give a single association for each word in the list. These associations were analysed using a method provided by Nelson, McEvoy and Schreiber (2004), which will be discussed in more detail later in this thesis. Every word that appeared as an answer in both the first and the second part of the study, was taken to the third and last part. Here, the card sorting task was employed to reveal the relations between the remaining words. By doing so, categories within this set of words could be identified. These categories are the components of creativity as they were analysed within this thesis. Study 1 Procedure The method of gathering a satisfactory sample of words related to creativity consisted of two parts. For the first part, the list of words taken from the work of Jordanous (2012) was used. From this list, three independent referees removed all the words that in their view did not relate to creativity. The lists made by the three referees were compared, and all the words that were kept by at least one referee made it onto the list, resulting in a list of 38 words. To add a colloquial sample of words, the general public was asked to provide some words by means of free association. First, the participant was explained that the goal of the study was to get associations for a later named word. When instructions were made clear, the participant was asked a single question: “Can you please give three words that you closely associate with the term creativity?” These terms were written down and processed for further use in the second part of the study. While Nelson, McEvoy and Schreiber (2004) note the risk implicit in continuous association over discrete association, compromises have to be made. Since each participant was required to be made aware of the study he or she participated in, it would have been too time-consuming to ask participants for only one word. When the results were in, three referees once again judged the words given by the populace, removing words that were not judged by all three to bear a relation to creativity. By adding each unique word to the list of 38 words from the list Jordanous created, a broad and varied sample of 80 terms related to creativity was established (see Appendix A). Participants In study 1, the participants could be practically anyone, as long as they could provide answers in either Dutch, German or English. An attempt was made to find a reasonably varied cross section of the population, meaning that not only university students were interviewed. Eventually, 36 people between the ages of 18 and 52 were asked what they associated with creativity. Materials No material was needed for this study other than a pen and paper to write the answers down. However, the list of words did have to be translated into Dutch and German for the 9.
(10) second study. Two German natives who also speak Dutch and English were responsible for the translation of the words. Analysis The data from study 1 did not require extensive analysis. The words that are listed in Appendix A came from two sources: 22 of the words came from the list that Anna Jordanous produced when she analysed two corpora of texts. Another 41 words came from study 1, and 17 words appeared in both sources. Study 2 Procedure In study 2, only participants took part who did not participate in the first study. Because the participants were not to know that the study was focused on creativity, they were simply told that the study was designed to investigate the concept of free association. After the debriefing, the participant was asked to take place in the cubicle. The reason for having the study under strict laboratory conditions was to reduce priming to an absolute minimum. For this reason, the cubicle was sparsely furnished, with just a desk, a chair and a computer present. The computer program responsible for taking the test was custom made in Processing, a simplified version of Java specifically aimed at creating graphical programs. The programming code can be found in Appendix B1. The computer administered the test by presenting the words from Appendix A in a random order. Because of the random presentation of the words, the priming effect that previous words had on the results should have been minimised across the group of participants. The participant then typed in one association for each presented word. The administration of the test lasted until every word from the list in Appendix A had been presented exactly once. For data gathering purposes, participants in this part of the study were asked to continue the experiment for two more parts: One part in which the words from Appendix A were presented in random order, to which participants had to answer with synonyms rather than associations. In the last part, the participants were asked to answer with antonyms. Once all three of these parts were finished, the participants were thanked for their cooperation. Participants The demands for people taking part in study 2 were somewhat more stringent than they were in study 1. Since there was a wide availability of German students as well as Dutch students at the University of Twente, the decision was made to do the second part of the study in both German and Dutch. However, as Paul Meara (1983) noted, there is a large difference between the words recalled by second language speakers, as compared to native speakers. The associations produced by native speakers have their basis in the semantic relation between words. However, participants associating in a language that is not their mother tongue, are more likely to produce so-called “clang associations”, associations based on similar sound rather than similar semantic meaning. For this reason, participants in study 2 had to have 10.
(11) either Dutch or German as their mother language. In study 2, 29 Dutch and 21 German people took part, resulting in a total of 50 participants. Materials For study 2, a secluded cubicle provided with a computer was needed. These cubicles were present at the University of Twente, which means the effects of participant priming were reduced to a minimum. The computer needed to be supplied with a self-developed test program, which presented the words on the list in a random order. This program has already been mentioned in the Procedure subsection. Analysis The data from study 2, which was carried out by the program in Appendix B1, needed to be counted. To count the number of unique answers to each stimulus, the data needed to be put through a number of processes. First, for convenience’s sake, the data needed to be extracted from the files (29 Dutch and 21 German files) and placed into a single, big file. The program in Appendix B2 took care of this. After a lot of manual correction, which mostly involved making sure everything was spelt correctly, the data was then ready to be counted by the program in Appendix B3. After everything was counted, program Appendix B4 then selected the words that were to be used in the third part of the study. The selection procedure had three conditions: - A word had to appear in both the first and the second experiment as an answer - A word had to appear more than once in the second study as an answer - The word could not be creative or any derivative of that base word The first condition simply means that a word is considered strongly associated with creativity if a word is both directly and indirectly associated with it. A direct association with creativity is achieved when a word is given as an association with the word creativity, in study 1. An indirect association means that a word was given as an associate in response to the associated words in study 2. For example, the words artist and painting may be given as an association with creativity. Then, in study 2, artist is given as a stimulus, to which painting is answered. The word painting is then given as an answer in both study 1 and study 2, and is thus considered strongly associated with creativity. The second condition was introduced to further reduce the effect of priming. Even though an attempt was made to reduce priming as much as possible by administering this test in strict laboratory settings, priming was still induced by the random word order. In some cases, the word painting may have been presented shortly before artist. This may have led some participants to answer painting when presented with the word artist, even though they would have given a different answer had this priming not occurred. To make sure that a word was not included in study 3 based solely on priming, a word had to be given as an answer on at least two different stimuli in study 2. A reason to choose a minimum of two different stimuli is that if the minimum were put on one stimulus, too many words would have been included in study 3, leading to confusion among the participants. On the other hand, if the minimum were placed at three or more, some words that are rightfully associated with creativity, may not be selected. Furthermore, if a word is incorrectly selected, it is unlikely to 11.
(12) gain a high number of relations in study 3, since it simply does not have any relation with the other words selected. Lastly, the third condition applies because the words creative or any of its derivatives, such as creativity or creation, could be given as answers in study 2. However, this would significantly change the outcome of the categorisation. If the word creativity were included, then only the words that are grouped with it in study 3can be said to be associated with creativity by that participant. On the other hand, if the word is not included, then all the groups created can be said to have some bearing to creativity. Other than using the results gained from this study for the selection of the words that were used in study 3, an analysis of variance was done to observe which source provided words more strongly associated with creativity. The two sources under investigation were the list of words associated with creativity by Anna Jordanous, and the words taken from the results of study 1. Words that came from both sources were ignored for this test. Thus, the ANOVA results compared the number of times the word create or any of its derivatives, creation, creative or creativity, were given as an associate in response to words from the two sources. By doing so, the strength of the two methods of gathering association words could be compared. Of course, only the 22 words from Jordanous’ list that were included in study 2 were used for analysis. Two words, artist and imagination have two different translations in Dutch and German. Both translations were excluded from the analysis, because the words were identified by both Jordanous and study 1. Study 3 Procedure In study 3, the 42 words that were selected after analysing study 1 and study 2 were given to a new group of participants. How these words were selected, is explained in the Analysis subsection for study 2. The words were written on index cards, one word per card. Before the participants were allowed to look at the cards, they were explained what they were supposed to do. They were explained that the words were to be divided into categories. The example from the card sorting explanation in the introduction was used to show what the purpose was. Furthermore, participants were told that there was no limit to the number of categories, or the size of a single category. If they felt a word did not belong into any other category, they could simply assign it a category of its own. After each participant finished the experiment, two photos were taken of the categorisation, so the data could be processed at a later point. Participants Study 3 was done by 40 different participants, and even though the study had been prepared in both Dutch and German, only Dutch people took part. The target was to have 50 participants in both study 2 and study 3, but because of time constraints and the lack of availability of people that had not already participated in another study, the number of participants for study 3 was set at 40. Furthermore, based on a study done by one of their own, Wood & Wood (2008) state that card sorting studies with as few as 25-30 participants 12.
(13) will likely yield similar results as those with several hundred participants. However, erring on the side of caution is not considered bad practice in this case, and thus 40 participants were tested. Materials Study 3 required 42 index cards with the selected words written on them, a chair and a table. To record the data for this experiment, a photo camera was needed as well.. Analysis The results from study 3 will be processed into a so-called heat map. If a single person places two words together in a category, then those two words get a 1 in the table of results. The table of results is simply a 42x42 table with the words labeled on the left and along the top. So if one person placed the words artist and painting together, then the word artist would get a 1 under painting and vice versa. By placing the results from all the participants on top of each other, the frequency of how often words were placed together became clear. However, by converting the frequencies into colours (low frequencies are yellow, high frequencies are red, hence the name heat map), a graphical representation is made which is much easier on the eye. The program responsible for creating the heat map is shown in Appendix C. Aside from the card sorting study, the counted results from study 2 were used for a comparative analysis. Nelson, McEvoy and Schreiber (2004) described a method of quantifying the association strength between words by creating a matrix. Within this matrix, the number of times an answer was associated with a stimulus is divided by the total number of participants to create the forward association strength. For example, if 14 of the 50 participants associated painting with the stimulus artist, then the forward association strength is 14/50 = 0.28. This way, association strength ranges from 0 (no associations) to 1 (all 50 participants had the same association). However, forward association strength does not account for backward association or indirect associations. In their method, Nelson et al. made a separate field for backward association, which is the number of associations when the stimulus and answer roles are reversed. In the previous example, the stimulus was artist and the answer was painting. Backward association strength is the number of times artist is answered to the stimulus painting. So if 8 people associated artist with painting, the backward association strength for the combination artist – painting is 8/50 = 0.16. In an NxN matrix, the forward association can be found by looking at the stimulus on the left and the answer at the top. The backward association can be found by finding the stimulus at the top, and the answer on the left side. Apart from forward and backward association strength, there is indirect association strength. Nelson et al. define this as associations with a link between them. For example, if drawing is associated with artist, and in turn painting is associated with drawing, then this constitutes an indirect association between artist and painting. If 19 people associate drawing with artist, and 26 people associate painting with drawing, then the indirect association strength is (19/50) * (26/50) = 0.38 * 0.52 = 0.1976. The problem with this thesis compared to the database Nelson et al. set up is that this thesis used a sample of 80 words, whereas Nelson 13.
(14) et al. had a sample of 5019 words. Since the number of indirect associations would have been very limited if there were no words to create these indirect associations, the rules were modified slightly. Rather than requiring that another stimulus from the list in Appendix A be in between the words, any word that was answered on two different stimuli constituted an indirect association. In a schematic way, according to Nelson et al. this is what is required for an indirect association between Stimulus and Answer2: Stimulus Answer1 Answer1 Answer2 In this thesis, this is the requirement for an indirect association between Stimulus1 and Stimulus2: Stimulus1 Answer Stimulus2 Answer The strength of this indirect association is the number of times Stimulus1 was associated with Answer divided by 50, multiplied by the number of times Stimulus2 was associated with Answer. An example: 7 people associated painting with artist, and 12 people associated painting with drawing. Then the indirect association strength is (7/50) * (12/50) = 0.14 * 0.24 = 0.0336. Since creating two different matrices would have been very confusing, the association strengths were given as a single score. The indirect association scores were simply added to both the forward and backward association strength. An example with three words: Stimulus Artist Artist Painting Painting Drawing Drawing. . Answer: painting: drawing: drawing: artist: artist: painting:. Forward association strength (x divided by 50) 12/50 = 0.24 17/50 = 0.34 20/50 = 0.4 8/50 = 0.16 10/50 = 0.2 4/50 = 0.08. This creates a 3x3 matrix, looking like this: Artist X 0.16 0.2. Artist Painting Drawing. Painting 0.24 X 0.08. Drawing 0.34 0.4 X. For the purpose of the example, a single indirect association is added: Artist Painting. . Art: Art:. 7/50 = 0.14 16/50 = 0.32 14.
(15) This means the indirect association strength between artist and painting is 0.14 * 0.32 = 0.0448. This strength is added to both the forward and backward strength between the two words, resulting in the following matrix:. Artist Painting Drawing. Artist X 0.2048 0.2. Painting 0.2848 X 0.08. Drawing 0.34 0.4 X. By creating this association strength matrix, the results from the card sorting study could be verified by comparing the association strength between words to the number of times words were placed together in the card sorting study. Before the association strength matrix could be created, the answers on the free association test had to be modified. Words which shared the same base word, such as person, personal and personality were all replaced with the same word, in this case person. The same went for words such as invent, inventor and invention. By reducing all words to their base form, the association becomes stronger. Furthermore, some words were written in both singular and plural forms. These words were all reduced to their singular form. Lastly, if there were words which could be reduced to words that appear on the list in Appendix D, this took priority. For example, the word innovative was written as innovation because that last word does appear on the list. All these changes were made to improve the quality of the association strength matrix.. Results Study 1 The results of the first study can be found in Appendix A, including whether the word came from the list Anna Jordanous made, or as a result of study 1, . Study 2 Because the results of study 2 are way too lengthy to publish here (2320 lines in Dutch, 1680 in German), only the results of the analysis of study 2 are shown. The 42 words that were selected for study 3 can be found in Appendix D. The association results from this study were used for further analysis as mentioned above, but that can be read after the heat maps have been discussed. Based on the results of the association study, the strength of the two methods for gathering association words could be compared. The words gathered from the text analysis method by Jordanous received creative or a derivative as an association 25 times (on average 1.14 times per word, or N = 22, = 1.14). The words gathered from study 1 were answered with creative 61 times (N = 41, = 1.49). While this data suggests that the average is higher for the results from study 1, an analysis of variance yields no significance (p = 0.613), leading 15.
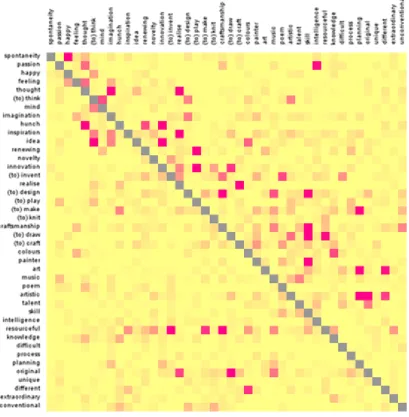
(16) to the conclusion that no significant difference could be identified between the two methods of gathering association words. Study 3 This section will begin by displaying the heat map (see Figure 3 on the next page), which is a result of the processing of the card sorting data. This heat map is a conversion of a numeric table to a coloured table. For the sake of completeness, the numeric table can be found in Appendix E. This map is easy on the eye, and should make any relations between words obvious in an instant.. Maybe this is not as clear as was once hoped. Relationships between individual words become clear now, because red squares indicate a strong relationship whereas yellow squares indicate a weak relationship, or no relationship at all. For example, on the fourth row (extraordinary), in the first column (different) there is a red square. This square shows that there is a strong relationship between the words extraordinary and different. A bit of thought reveals that this makes sense, as anything that is extraordinary is highly likely to be considered different from the norm as well. On the other end of the scale, on the top row 16.
(17) (different), in the third column (to knit), there is a bright yellow square because (to) knit is not at all associated with something being different. Again, after some thought this also makes sense. Knitting is a practical activity, whereas different is a conceptual word. While the two can go together, it is more difficult to imagine them together than different and extraordinary. So, while the individual relationships between words are now clear, the table itself is still confusing and hard to read. However, a rearranging of the words in the table may bring clarity. The rearranging of the words was done by using Hierarchical Cluster Analysis (HCA), a technique very well detailed by Anthony Coxon (1999). This method is capable of arranging words into a set of clusters based on their shared association strengths. For example, the association strengths for the words (to) draw, (to) craft, and (to) knit were the highest of all. These words then form a group. Going down the list, the association strength between different and extraordinary is also very high. These two words then form a separate group. Following the HCA method, every association between a pair of words can be added in three different ways: - Two new words: These words simply form a new group that for the moment remains separate from the other groups. - One new word and one existing word: The existing word is already in a group, so here the new word is simply attached to the already existing group, preferably as close to the existing word as possible. - Two existing words: This is much in the same way it is done with a new and an existing word, but rather than attaching one word to a group, an entire group is now attached to another group. This kind of association links two groups together, by attaching the words with the strongest associations within the two groups to each other. Sometimes this requires the rearranging of words within groups, so that the two words from different groups can be as close together as possible. At some point, the two associated words from different groups can not be exactly adjacent because another group has already taken that place. In that case, the smaller group will still be placed as close as possible to the bigger group, but placing them directly adjacent to each other is not possible. As can be read in Coxon’s work, the numerical basis for the HCA is quite complex. Luckily, computer software is available to do the work. The statistical programming environment R is capable of creating a dendrogram based on the card sorting results, using programming work detailed by Alan Salmoni (2012). The result of the HCA using R can be seen in Figure 4. In this figure, the relative positions of the horizontal lines represent the association strengths. The higher the line is, the weaker its strength.. 17.
(18) Now that the words are sorted according to association strength, the heat map can be cleared up by ordering the words based on the results obtained in the HCA. The results of the ordered heat map are displayed in Figure 5, below.. 18.
(19) Now, the results are much clearer. Immediately, one can see the squares that form groups of words. For example, in the top left corner there is a 5x5 square that is much darker than the yellow around it. This 5x5 square belongs to a group of five words: unconventional, different, extraordinary, original and unique. If this group were to be given a name, it would probably be originality. Based on the entire study, originality can be said to be a component of creativity. By going through the heat map and naming all the groups of words that reveal themselves, the psycholinguistic components of creativity are revealed. First, the groups must be identified. While it is possible to identify groups by looking at the heat map, Hierarchical Cluster Analysis has already shown its merit in identifying groups. The only question that remains based on the dendrogram in Figure 4 is how many groups need to be identified. The number of groups to be identified is fairly arbitrary, because the cut-off level can always be raised or lowered. By raising the cut-off level, fewer groups are created, but the groups will not be very specific. Contrary, by lowering the cut-off level, more specific groups will be created, but there will remain a number of groups too large to work with. In this case, a choice was made to go with eight categories. Creating eight categories simply means drawing a horizontal line at a certain level through the dendrogram so that eight different groups remain, as can be seen in Figure 6.. Here, it becomes obvious that if the cut-off level were to be raised ever so slightly, the two outer right groups would become lumped together. Raising it slightly further would group the two middle categories together as well. Conversely, if the cut-off level were to be lowered, the third group would be split in two, thus creating an extra category. One may say that the eight categories created here are either too specific, or not specific enough. Based on this dendrogram, anyone may create a different number of categories by arbitrarily raising or lowering the cut-off level. However, the card sorting results, and the dendrogram based on these results are inflexible. Now that the groups have been identified, it is time to assign labels to each category. These names are of course made up, but should reflect the nature of all the words present in each group. The table containing the groups can be found on the next page.. 19.
(20) Words Unconventional Different Extraordinary Original Unique Spontaneity Happy Feeling Passion (to) invent Realise Novelty Innovation Renewing Imagination Inspiration Resourceful Idea Hunch Planning Process (to) think Thought Mind Difficult Intelligence Knowledge Colours Craftsmanship (to) knit (to) craft (to) draw Poem Art Music Artistic Painter Talent Skill (to) make (to) play (to) design. Groups. Originality. Emotion. Inventiveness. Process. Intellectuality. Hobby. Performance. From thought to practice. Based on this analysis, there are eight components of creativity: 1. Originality – If a work is deemed original, then it is seen as creative. 2. Emotion – For a work to be judged as creative, it must evoke an emotion.. 20.
(21) 3. Inventiveness – An idea must be viewed as refreshing and novel for it to be creative. If an idea is old, then it is probably copied, and copying is generally not viewed as a creative action. 4. Process – Creativity is not something that is conjured from thin air. Generally, being perceived as creative takes time and effort. This process is a separate subject that could be researched. 5. Intellectuality – If a work is to have a semblance of creativity, then it must bring up the idea that a lot of thought has been put into the work. 6. Hobby – This category is creativity that might be equated to the small-C Beghetto and Kaufman listed. While it is not creativity in problem solving, it is creativity at home, at school or any other place where small, relatively insignificant works of art are created. 7. Performance – Performance can be seen as similar to the Hobby category, but performance usually takes place on bigger stages. In this category, the performer tends to be central, whereas in the Hobby category, the performance is most important. 8. From thought to practice – This last category can perhaps be joined with the Process category, because both are about the journey from idea to physical manifestation of that idea. However, the process is about the inner workings of creativity in the brain, whereas From thought to practice is about the visible stages between idea and practice.. Comparative analysis of the association study To be able to properly compare the association strength matrix, it is best to make it into a heat map again. Again, for sake of completeness, the numeric matrix can be found in Appendix F. In the appendix, numbers have been multiplied by 1000 for ease of reading. Most association strengths in the matrix do not go above 0.01 (on a scale from 0 to 1), but the maximum strength between two words in this study is 0.4. Because of that difference in scale, the strengths had to be amplified. In the heat map in Figure 7, on the next page, combinations with an association strength of 0.08 were already granted the strongest pink coloration. Keep in mind that forward and backward association strengths are different in this table, and thus the figure is not symmetrical.. 21.
(22) What becomes immediately clear from this graphical representation of the association strengths is that it seems haphazard at best. One can hardly establish a pattern from looking at this map, because even though the words along the left and top have been arranged in the same way as they were in the heat maps displaying the card sorting results, the pink spots appear to be mostly random. There is a slight pattern in the pink spots going from top left to bottom right, but the grouping as it is visible for the card sorting results is not at all present here. Perhaps a different look at things will change this. Because of the enormous difference in scale, low association strengths are completely invisible. If the map were to be based on the average strength rather than the absolute values, more insight could be gained. The map in Figure 8 is based purely on the average strength, 0.00649. Any association strength higher than this is marked with a red square, and anything lower than this is marked with a yellow square.. 22.
(23) This does not seem to be an improvement. The association strength based on the experiment and the method outlined by Nelson et al. does appear haphazard at best. There is one more way of charting the data which may reveal underlying patterns if they do exist: The scatterplot, which is displayed in Figure 9, on the next page. Because the range of association strengths derived from the Nelson et al. method lie so far apart, first the logarithm for each strength was taken before applying the scatter plot.. 23.
(24) While this scatter plot does reveal a tendency for the association strength to go up as the card sorting frequency for each word pair does, the goodness-of-fit (r² = 0.215) is not spectacular by any stretch of the imagination. Possible explanations for this discrepancy between the card sorting results and the association strengths will be investigated further in the Discussion section.. Discussion In this thesis, an attempt was made to tackle the problem of the large number of creativity definitions. creativity from a different angle, employing free association and card sorting. The results from the experiment carried out here can briefly be summarised by listing the groups again: 1. Originality 2. Emotion 3. Inventiveness 4. Process 5. Intellectuality 6. Hobby 7. Performance 8. From thought to practice 24.
(25) In most recent articles concerning the definition of creativity (for example Ford & Gioia, 2000; Ritchie, 2007; Jordanous, 2012), the terms novelty and value are mentioned as being the decisive factors in creativity. Most of the groups identified in this thesis can be placed in either of these categories. For example, emotion can be seen as valuable, because if something evokes an emotional reaction, it is likely to be of emotional value. Inventiveness and profound thought can both be placed under novelty, because inventiveness and profound thought all provide novel insight into certain subjects. On the other hand, splitting the categories of novelty and value up into smaller sections should ease the line of research. Rather than researching the vague concept of value, one may focus on researching emotional reactions. The separate research fields of emotion and creativity are vast, but a combination of the two is surprisingly rare. Amabile, Barsade, Mueller and Staw (2005) investigated the role emotion plays as a predictor for creative thought by studying daily diary entries. However, influence of emotion on the perception of creativity Aside from the further defining of novelty and value, two new categories can be added to the research as well. While intellectuality has been researched extensively, the link between intelligence and creativity is suspected, but not proven. Especially the concept of H-creativity, or big C as Kaufman and Beghetto named it, is suspected to be closely linked to creativity. Back in 1986, Runco and Albert attempted to link creativity to intelligence, and found that they are correlated until an IQ level of 120. However, this research was based on early definitions of creativity. In the introduction of this thesis, the conclusion was already drawn that these definitions were shaky at best. However, Mayer, Caruso & Salovey (1999) developed standard criteria which brought emotional intelligence closer to traditional intelligence. In this way, several of the categories identified in this thesis have already been combined. The last category that has not been discussed here is the creative process. Several of the identified categories can be said to fit one end of the creative process or the other. It starts with intellectuality, then continues down the path from thought to practice, which results in both hobby creativity and performance creativity. These categories can be equated to the Big C and Small C identified by Kaufman and Beghetto. However, recent research into the process of creativity appears to be lacking. As was very briefly mentioned in the introduction, Wallas already created a model for the creative process back in 1926. The research into the creative process played a big part in the development of the field of creativity research. However, the research into the process seems to have been somewhat neglected lately. While Todd Lubart (2001) published a well written review of the past, present and future of the models of the creative process, not many seem to have taken his advice for future research to heart yet. This leaves the matter of the discrepancy between the results from the card sorting study, and the results from the association strength analysis. One possible explanation is that there simply were not enough words with which to associate, preventing any real association strength from building up. The method for measuring association strength, provided by Nelson et al. was based on a word sample of over 5000 words, answered by more than 6000 participants (Nelson, McEvoy & Schreiber, 2004). In total, they gained nearly three quarters 25.
(26) of a million answers. This makes the 4000 answers given in this study look very paltry in comparison. A more extensive association analysis may increase the quality of the results. Another possible reason for the strange difference in results is the forced choice element in the card sorting study. Participants in a free association study are allowed to freely answer the questions (hence the name free association). Card sorting on the other hand, forces participants to choose from the words given by the experimenter. This severely limits the variability in the results and will thus make patterns emerge more easily. Several issues need to be addressed before the thesis is concluded. First of all, the selection of words from the free association results lacks a statistical basis. Because the combination of free association and card sorting is a brand new type of experimentation, the method of selecting words from the results of study 1 and 2 was left to the experimenter. On the other hand, the methods that were used here, in combination with the program codes in the appendices, can be used with very little adaptation. By using this method, any concept can be analysed in detail. However, it is difficult to say what the variance would be over a large number of these experiments. Running the first study again would most likely result in a slightly different set of words. Taking this set into the second and third studies will only exacerbate this divergence. However, despite there being a few changes in the set of words resulting from the first study, the hypothesis is that similar grouping will still occur, and thus the resulting components of creativity will remain the same. Another issue within this study was translation. For the experiments, both Dutch and German students were used and thus every word had to be translated into two languages. Later, for the sake of being able to properly report on the experiments, everything had to be translated into English as well. While the native German translators were excellent beyond a shadow of a doubt, there is always the problem of subtleties getting lost in translation. The categories would likely not have changed, but some words may or may not have been included in any of the three parts of the study, had they been administered in another language. Both because of translation and because of clang associations (associating based on sound rather than meaning), language was an issue throughout the experiments. It is my fervent hope that this method of concept analysis takes off. It provides a beautiful graphical representation, and I believe that any concept can be subject to analysis in this method. However, a real software developer should try his hand at creating a program that can run the concept analysis from start to finish.. Conclusion In this thesis, I was able to define the components of creativity by employing a completely new method. The definition of these components should provide some finer direction to the field of creativity research. When combined with Kaufman and Beghetto’s four C model of creativity (Kaufman & Beghetto, 2004) and the concentric circle model proposed by Hennessey & Amabile (2010), very specific research questions can be drawn up. As stated, this should give the field of creativity research some direction as to where to go next. Furthermore, existing research from other fields can also be used to answer some of the questions the field of creativity asks. For future research, it is important to focus on specific areas rather than studying the entire field of creativity, but without losing sight of what 26.
(27) research has been done in different parts of the field. For each of the identified eight categories, research has already been done, albeit not specifically aimed at creativity. By adapting existing research to the field of creativity, and creating new tools to objectively judge each of the identified eight categories independently, a broad measure of creativity can be constructed. When objective measures are established for each of the components, then can creativity be judged objectively, meaning that we no longer have to rely on such subjective terms as novelty, value and typicality. Only by distancing ourselves from such subjective measures can the field of creativity research further itself as a proper science. Then, and only then can it be used to use creativity to further the cause of man.. References Almeida, L. S., Prieto, L. P., Ferrando, M., Oliveira, E., & Ferrándiz, C. (2008). Torrance Test of Creative Thinking: The question of its construct validity. Thinking Skills and Creativity, 3(1), 53-58. Amabile, T. M. (1996). Creativity and innovation in organizations (Vol. 5). Boston: Harvard Business School. Amabile, T. M., Barsade, S. G., Mueller, J. S., & Staw, B. M. (2005). Affect and creativity at work. Administrative science quarterly, 50(3), 367-403. Beghetto, R. A., & Kaufman, J. C. (2007). Toward a broader conception of creativity: A case for "mini-c" creativity. Psychology of Aesthetics, Creativity, and the Arts, 1(2), 73. Boden, M. A. (2003). The creative mind: Myths and mechanisms. London, United Kingdom: Routledge. First published in 1990. Collins, A. M., & Loftus, E. F. (1975). A spreading-activation theory of semantic processing. Psychological review, 82(6), 407-428. Coxon, A.P.M. (1999). Sorting data: Collection and analysis. London, United Kingdom: Sage Publications. Ford, C. M., & Gioia, D. A. (2000). Factors influencing creativity in the domain of managerial decision making. Journal of Management, 26(4), 705-732. Guerrero, L., Claret, A., Verbeke, W., Enderli, G., Zakowska-Biemans, S., Vanhonacker, F., ... & Hersleth, M. (2010). Perception of traditional food products in six European regions using free word association. Food Quality and Preference, 21(2), 225-233. Hanna, L., Risden, K., Czerwinski, M., & Alexander, K. J. (1999). The role of usability research in designing children’s computer products. The design of children’s technology, 326. Harloff, J., & Coxon, A. P. M. (2005). How to Sort. A Short Guide on Sorting Investigations. 27.
(28) Hennessey, B.A. & Amabile, T.M. (2010). Creativity. Annual Review of Psychology, 61, 569598. Hinkle, V. (2008). Card-sorting: What you need to know about analyzing and interpreting card sorting results. Usability News, 10(2), 1-6. Jordanous, A. (2012). A standardised procedure for evaluating creative systems: Computational creativity evaluation based on what it is to be creative. Cognitive Computation, 4(3), 246-279. Kaufman, J. C., & Beghetto, R. A. (2009). Beyond big and little: The four C model of creativity. Review of General Psychology, 13(1), 1. Kim, K. H. (2006). Can we trust creativity tests? A review of the Torrance Tests of Creative Thinking (TTCT). Creativity research journal, 18(1), 3-14. Levi, M. D., & Conrad, F. G. (1997, March). Usability testing of world wide web sites. In CHI Extended Abstracts (p. 227). Lubart, T. I. (2001). Models of the creative process: Past, present and future. Creativity Research Journal, 13(3-4), 295-308. Mayer, J. D., Caruso, D. R., & Salovey, P. (1999). Emotional intelligence meets traditional standards for an intelligence. Intelligence, 27(4), 267-298. Meara, P. (1983). Word association in a foreign language. Nottingham Linguistics Circular, 11, 28-38. Nelson, D. L., McEvoy, C. L., & Schreiber, T. A. (2004). The University of South Florida free association, rhyme, and word fragment norms. Behavior Research Methods, Instruments, & Computers, 36(3), 402-407. Plucker, J. A., Beghetto, R. A., & Dow, G. T. (2004). Why isn't creativity more important to educational psychologists? Potentials, pitfalls, and future directions in creativity research. Educational Psychologist, 39(2), 83-96. Ritchie, G. (2007). Some empirical criteria for attributing creativity to a computer program. Minds and Machines, 17(1), 67-99. Runco, M. A., & Albert, R. S. (1986). The threshold theory regarding creativity and intelligence: An empirical test with gifted and nongifted children. Creative Child and Adult Quarterly, 11(4), 212-218. Runco, M. A., & Jaeger, G. J. (2012). The standard definition of creativity. Creativity Research Journal, 24(1), 92-96. 28.
(29) Salmoni, A. (2012). Open card sort analysis 101. Obtained on July 13th, 2014 from the UX booth website: http://www.uxbooth.com/articles/open-card-sort-analysis-101/ Schmitt, N., & Meara, P. (1997). Researching vocabulary through a word knowledge framework. Studies in second language acquisition, 19(1), 17-36. Spearman, C. (1904). "General Intelligence," Objectively Determined and Measured. The American Journal of Psychology, 15(2), 201-292. Thurschwell, P. (2013). Sigmund Freud. London, United Kingdom: Routledge. Torrance, E. P. (1966). The torrance tests of creative thinking-norms-technical manual research edition-verbal tests, forms A and B-figural tests, forms A and B. Princeton, NJ: Personnel Press. Wallas, G. (1926). The art of thought. G.J. Cape: London. Wood, J. R., & Wood, L. E. (2008). Card sorting: current practices and beyond. Journal of Usability Studies, 4(1), 1-6.. 29.
(30) Appendix A This is the list of 80 words that was compiled as a result of reviewing the word list Anna Jordanous had created, and the first part of the study. A signifies that a word came from the list made by Anna Jordanous, 1 indicates that the word came from the first part of the study. A+1 means that the word came from both. Dutch Anders Artiest Artistiek Breien Buitengewoon Componist Creatie Creatief Creëren Denken Divergent Esthetisch Fantasie Flexibiliteit Gedachte Gedicht Geest Genie Gevoel Grafisch Design Handvaardigheid Hippies Idee Ingeving Innovatie Innovatief Inspiratie Inspireren Intelligentie Interpretatie Inzicht Kennis Kleuren Kleurrijk Knutselen Kunst Kunstenaar Los Maken Moeilijk Muziek Muzikaal Nieuw Nieuwigheid Onconventioneel Ontwerpen. German Anders Artist Artistisch Stricken Außergewöhnlich Komponist Kreation Kreativ Kreieren Denken Divergent Ästethisch Phantasie Flexibilität Gedanke Gedicht Geist Genie Gefühl Grafisch Design Fingerfertigkeit Hippies Idee Eingebung Innovation Innovativ Inspiration Inspirieren Intelligenz Interpretation Einsicht Wissen Farben Farbenfroh Basteln Kunst Künstler Lose Machen Schwierig Musik Musikalisch Neu Neuartigkeit/Neuheit Unkonventionell Entwerfen. English Different Artist Artistic (To) Knit Extraordinary Composer Creation Creative (To) Create Thinking Divergent Aesthetic Imagination Flexibility Thought Poem Mind Genius Feeling Graphic Design Craftsmanship Hippies Idea Hunch Innovation Innovative Inspiration (To) Inspire Intelligence Interpretation Insight Knowledge Colours Colourful (To) Craft Art Artist Loose (To) Make Difficult Music Musical New Novelty Unconventional (To) Design. A/1/A+1 1 1* A+1 1 A+1 A 1 1 1 A+1 A A A+1 A+1 A A 1 A 1 A 1 1 A+1 A+1 A A A+1 A A 1 A A 1 1 1 1 A+1 1 1 1 1 A A+1 A+1 A+1 1. 30.
(31) Onzin Opleiding Oplossingen Originaliteit Origineel Out Of The Box Passie Plaatjes Planning Poëtisch Potentieel Proces Programmeren Schilder Schilderen Spelen Spellen Spontaan Spontaniteit Talent Tekenen Toneel Uiting Uitvinden Uitvinder Uniek Vaardigheid Verbeelding Vernieuwend Verwerkelijken Vindingrijk Vormen Vrij Denken Vrolijk. Unsinn Bildung Lösung Originalität Originell Out Of The Box Leidenschaft Bilder Planung Poetisch Potenzial Prozess Programmieren Maler Malen Spielen Spiele Spontan Spontanität Talent Zeichnen Theater Äußerung Erfinden Erfinder Einzigartig Fähigkeit Einbildung Erneuernd Verwirklichen Einfallsreich Gestallten Frei Denken Fröhlich. Nonsense Education Solution Originality Original Out Of The Box Passion Pictures Planning Poetic Potential Process (To) Program Painter (To) Paint (To) Play Games Spontaneous Spontaneity Talent (To) Draw Theater Expression Invent Inventor Unique Skill Imaginativenss Renewing Realise (To make real) Resourceful (To) Shape Free Thinking Happy. 1 1 1 A 1 1 1 1 1 A+1 A A A+1 A+1 1 A+1 A+1 A 1 A 1 1 1 A A 1 A 1 1 1 1 1 1 1. * The word Artist (second word in the table) has two different translations in both Dutch and German. However, there is only a single word for it in English. Regardless of this, the word has been added to the study in both translations (Artiest/Artist and Kunstenaar/Künstler). The former almost exclusively refers to a performer, such as a musician or a dancer. On the other hand, the latter is reserved for someone that creates art, such as a painter or a poet.. 31.
(32) Appendix B1 It needs to be noted that Processing programs can be written in multiple tabs. As to not lose oversight, the program was spread over a multitude of windows, which are all displayed separately below. It also needs to be noted that all the coding done for this experiment was done by someone with practically no prior experience. To an expert, it is therefore very likely to look shabby and confusing. There are probably many ways to optimise the code, and the programming language is likely not the best choice either. However, it did what it was supposed to do, which was obviously the most important. Running the program results in three different text files: One for association, one for synonyms and one for antonyms. Combined with the mother language of the participant, and his participant number, these files are created: Antonyms NL 01.txt Association NL 01.txt Synonyms NL 01.txt These text files hold the words that were presented, in the order that they were presented in, along with the answers given by the participants. The stimuli and answers were separated by spaces, which in hindsight was a big mistake that cost a lot of extra work. After all, if an answer in any of the text files contained a space (which turned out to not be too uncommon), there is no way for code to detect the difference between a space in the stimulus or the answer. Now, as may become obvious from reading the programming code, the goal was to start with a starting screen in which participants were asked to select their mother tongue. From then on, the program was separated into a Dutch and a German side. The program’s flowchart can be seen in Figure X, below. In this appendix, the code is listed according to this order. Note: Some windows contain text. Explanations/translations are listed at the end of the code. Main program code: int hsize = 800; int vsize = 600; String state = "Intro"; PFont times; String[] listNL; String[] listDE; String[] resultsANL; String[] resultsSNL; String[] resultsTNL; String[] resultsADE; String[] resultsSDE; String[] resultsTDE; String deelnemer = "";. 32.
(33) String asNL = ""; String asDE = ""; String syNL = ""; String syDE = ""; String anNL = ""; String anDE = ""; int randomANL = 1; int randomADE = 1; int randomSNL = 1; int randomSDE = 1; int randomTNL = 1; int randomTDE = 1; int ANL = 0; int ADE = 0; int SNL = 0; int SDE = 0; int TNL = 0; int TDE = 0; void setup() { background(255); size(hsize,vsize); smooth(); times = createFont("Times New Roman", 16, true); }. void draw() { textFont(times); if(state == "Intro") { Intro(); } if(state == "InstructionNL") { InstructionNL(); } if(state == "InstructionDE") { InstructionDE(); } if(state == "AssociationNL") { AssociationNL(); } if(state == "AssociationDE") { AssociationDE(); } if(state == "SynonymNL") { SynonymNL(); } if(state == "SynonymDE") { SynonymDE(); } if(state == "AntonymNL") { AntonymNL(); }. 33.
(34) if(state == "AntonymDE") { AntonymDE(); } if(state == "EndNL") { EndNL(); } if(state == "EndDE") { EndDE(); } }. void mousePressed() { if(state == "Intro") { if(hsize/2-65 < mouseX && hsize/2-35 > mouseX && vsize/2-45 < mouseY && vsize/2-15 > mouseY) { if(buttonNL == 0) { buttonNL = 1; buttonDE = 0; } else { buttonNL = 0; } } if(hsize/2-65 < mouseX && hsize/2-35 > mouseX && vsize/2+5 < mouseY && vsize/2+35 > mouseY) { if(buttonDE == 0) { buttonDE = 1; buttonNL = 0; } else { buttonDE = 0; } } if(hsize/2-50 < mouseX && hsize/2+50 > mouseX && (3*vsize/4)-20 < mouseY && (3*vsize/4)*20 > mouseY) { if(buttonNL == 1) { state = "InstructionNL"; } if(buttonDE == 1) { state = "InstructionDE"; } } } }. void keyPressed() { if(state == "InstructionNL" || state == "InstructionDE") { if (keyCode == BACKSPACE) { if (deelnemer.length() > 0) { deelnemer = deelnemer.substring(0, deelnemer.length()-1); } } else if (keyCode == ENTER) { instNL = instNL + 1; instDE = instDE + 1; } else if (keyCode != SHIFT && keyCode != CONTROL && keyCode != ALT) { deelnemer = deelnemer + key; }. 34.
Figure
Related documents
2) Rotate manual shift lever back toward rear of vehicle 2 notches to Neutral position. Ensure gearshift is in Neutral. While holding manual shift lever lightly toward the
The uniaxial compressive strengths and tensile strengths of individual shale samples after four hours exposure to water, 2.85x10 -3 M cationic surfactant
organisasjonslæring, arbeidsplasslæring, uformell og formell læring, læring gjennom praksis, sosial praksis og så videre vil derfor være nyttige når man skal foreta en studie
Kendra houses calculated from the Moon in this example, are the fifth (first house calculated from the Moon), eighth (fourth house calculated from the Moon), eleventh (seventh
ABC: Artificial Bee Colony; ANN: Artificial Neural Network; CBO: Coupling Between Objects; CK: Chidamber & Kemerer; CODe-Imp: Combinatorial Optimisation for Design Improvement;
Using a Public Goods Game, we are interested in assessing how cooperation rates change when agents can play one of two different reactive strategies, i.e., they can pay a cost in
As inter-speaker variability among these the two groups was minimal, ranging from 0% to 2% of lack of concord in the 21-40 group and from 41% to 46% in the 71+ generation, we
individual item is less critical. Our starting point was an existing examination format that we believe functions well to assess the appropriate abilities. In the process of
