ORIGINAL RESEARCH
HEAD & NECK
CT Imaging Correlates of Genomic Expression for Oral Cavity
Squamous Cell Carcinoma
C.R. Pickering, K. Shah, S. Ahmed, A. Rao, M.J. Frederick, J. Zhang, A.K. Unruh, J. Wang, L.E. Ginsberg, A.J. Kumar, J.N. Myers, and J.D. Hamilton
ABSTRACT
BACKGROUND AND PURPOSE: Imaging correlates of genetic expression have been found for prognostic and predictive biomarkers of some malignant diseases, including breast and brain tumors. This study tests the hypothesis that imaging findings correlate with relevant genomic biomarkers in oral cavity squamous cell carcinoma.
MATERIALS AND METHODS: Surplus frozen tissue from 27 untreated patients with oral cavity squamous cell carcinoma who underwent preoperative CT imaging was analyzed for gene expression. A team of neuroradiologists blinded to the genomic analysis results reviewed an extensive list of CT findings. The imaging correlated with genomic expression for cyclin D1, angiogenesis-related genes (vascular endothelial growth factor receptors and ligands), which relate to enhancement on the basis of other tumor types; and epidermal growth factor receptor, which may relate to proliferation and mass effect.
RESULTS:Expression of vascular endothelial growth factor receptors 1 and 2 correlated with the enhancement of the primary tumor (P⫽ .018 andP⫽.025, respectively), whereas the epidermal growth factor receptor correlated with mass effect (P⫽.03). Other exploratory correlations included epidermal growth factor receptor to perineural invasion (P⫽.05), and certain vascular endothelial growth factor receptors and ligands to mass effect (P⫽.03) and increased (P⫽.01) or decreased (P⫽.02) primary tumor size.
CONCLUSIONS: We report that CT imaging correlates with gene expression in untreated oral cavity squamous cell carcinoma. Enhance-ment of the primary tumor and degree of mass effect correlate with relevant genomic biomarkers, which are also potential drug targets. Eventually, treatment decisions may be aided by combining imaging findings into meaningful phenotypes that relate directly to genomic biomarkers.
ABBREVIATIONS:ECS⫽extracapsular spread; EGFR⫽epidermal growth factor receptor; HPV⫽human papillomavirus; HU⫽Hounsfield unit; OSCC⫽oral cavity squamous cell carcinoma; VEGF⫽vascular endothelial growth factor
H
ead and neck squamous cell carcinoma is the sixth most common cancer with approximately 600,000 cases per year worldwide and approximately 50,000 cases per year in the United States.1,2Despite advances in treatment, the 5-year survival rate of patients with squamous cell carcinoma remains at 40%–50%.3 The most common site involved is the oral cavity.1Known risk factors include alcohol; tobacco; and, to a lesser degree, humanpapillomavirus (HPV).4As in most solid tumors, squamous cell carcinoma is usually caused by genetic alterations. Tumors in to-bacco users tend to have more genomic alterations than in HPV-associated disease,5and these alterations may contribute to treat-ment resistance.
Treatment failure most frequently takes the form of local and regional recurrences, but as disease control in these areas im-proves, treatment failures are more often a result of distant me-tastasis. The presence of cervical lymph node metastases, espe-cially extracapsular spread (ECS), is a reliable adverse prognostic factor.6The promise of basing treatment decisions on specific driver gene mutations or changes in expression, known as genomic biomarkers, has yet to be fully realized because of our poor understanding of the mechanisms of regional and distant metastases of squamous cell carcinoma.
Imaging phenotypes may convey relevant genomic informa-tion. Correlation of imaging morphologic features to the geno-type and gene expression have already been made in other tumor
Received July 6, 2012; accepted after revisions November 14.
From the Departments of Head and Neck Surgery (C.R.P., M.J.F., J.N.M.), Diagnostic Radiology (K.S., S.A., L.E.G., A.J.K., J.D.H.), and Bioinformatics and Computational Biology (A.R., J.Z., A.K.U., J.W.), The University of Texas MD Anderson Cancer Cen-ter, Houston, Texas.
Paper previously presented at: Annual Meeting of the American Society of Neuro-radiology, April 21–26, 2012; New York, New York.
Please address correspondence to Jackson Hamilton, MD, MD Anderson Cancer Center, Unit 1482, PO Box 301402, Houston, TX 77230-1402; e-mail: jhamilton1@ mdanderson.org
Indicates open access to non-subscribers at www.ajnr.org
sites, such as the breast, liver, or brain.7-15Advantages of imaging include a larger area of coverage than pathologic specimens, which extends evaluation to tissue beyond the surgical resection margins, and less expense than combinations of multiple genomic tests, especially if obtained anyway as routine practice. If imaging findings can correlate with clinically useful molecular or genomic biomarkers, then a potential exists for improved tissue sample targeting,8clinical decision making, response monitoring,16and discovering and validating molecular targets.17 For example, higher expression of a gene correlated with invasion in glioblas-toma by MR imaging and was subsequently found to be a prog-nostic biomarker of survival.17However, imaging-to-genetic cor-relations have yet to be demonstrated for squamous cell carcinoma of the oral cavity (OSCC).
Epidermal growth factor receptor (EGFR) is a tyrosine kinase receptor on the cell surface related to cell growth that is both a predictive biomarker in head and neck squamous cell carci-noma18,19and a chemotherapy target.3,20EGFR expression has been related to the ratio of contrast-enhanced tumor and necrosis in brain tumors9and primary tumor size and nodal metastasis for breast cancer.21Vascular endothelial growth factor (VEGF) li-gands and receptors are signaling proteins involved in angiogen-esis and are targets for chemotherapy.9VEGF expression has been related to brain and liver tumor enhancement and elevated per-fusion.10,11,15Cyclin D protein alters cell cycle progression and interacts with several proteins and receptors, including tumor ne-crosis factor alpha and retinoblastoma protein. Cyclin D1 may be a marker of poor prognosis and higher recurrence rates in OSCC, especially of the tongue,22,23and has been associated with smaller, well-defined breast cancers.24We tested the hypothesis that CT imaging findings correlate with selected genomic biomarkers in patients with OSCC.5,25
MATERIALS AND METHODS
Genomics
After institutional review board approval, untreated patients with OSCC underwent extensive genomic evaluation of surplus frozen tissue removed during a clinically indicated surgical procedure. A total of 27 of these patients had good-quality pathology specimens that underwent genomic analysis and also preoperative contrast-enhanced CT examinations for retrospective review. Exome se-quencing for some of these patients has been published previ-ously.5Only gene expression was examined for this analysis. Total RNA was isolated by using Tri Reagent (Sigma-Aldrich, St. Louis, Missouri) according to the manufacturer’s instructions. RNA was hybridized to the Human Exon 1.0ST expression array platform (Affymetrix, Santa Clara, California) according to the manufac-turer’s instructions. Data were background-corrected with robust multiarray average and quantile normalized in R (R statistical computing software; http://www.r-project.org/) with the aro-ma.affymetrix library. Probes were averaged across each gene. The groups of genes assessed in this preliminary study included cyclin D1 protein, EGFR, and VEGF ligands (VEGF-A, -B, and -C) and receptors including VEGF-r1 (also known as FMS-like tyrosine kinase receptor 1), VEGF r2 (kinase insert domain receptor or fetal liver kinase 1), and VEGF-r3 (FMS-like tyrosine kinase
re-ceptor 4). Additional demographic, pathology, and follow-up data were gathered. HPV status was noted if available.
Imaging
Imaging analysis was done by consensus of 2 board-certified neu-roradiologists. A third reader was used to resolve discrepancies. All readers were blinded to genetic results.
The CT technique changed during the course of the study. Most patients underwent imaging on a 16-detector LightSpeed CT scanner (GE Healthcare, Milwaukee, Wisconsin) with axial 1.25- to 2.5-mm collimation at 120 kVp and 200 –240 mA, after injection of 120 mL of Omniscan (GE Healthcare) at 3 mL/s with a 90-second delay. A second angled acquisition was performed as necessary to eliminate dental artifacts.
Bidimensional measurements of the primary tumor and, if present, the largest metastatic lymph node were made on axial images. The cross-sectional area [for an ellipse⫽(1⁄2long axis⫻ 1⁄2short axis)] and the ratio of the long axis over the short axis
[image:2.594.301.534.57.343.2]were calculated. Enhancement of the primary site and of the larg-est solid component of lymph nodes was measured by a represen-tative region of interest in Hounsfield units (HU). The enhance-ment of the submandibular gland was used as a positive control to normalize the values among patients (lesion HU/submandibular gland HU). For the primary tumor, borders were judged as ill- vs well-defined and as regular vs irregular. Invasion into adjacent structures was noted. Mass effect was graded as none, mild if there was⬍1 cm displacement of airway or other adjacent structures, moderate for 1–2 cm displacement and marked if ⬎ 2 cm. Perineural extension of the primary tumor or ECS from lymph nodes was assessed both by imaging and subsequent pathologic
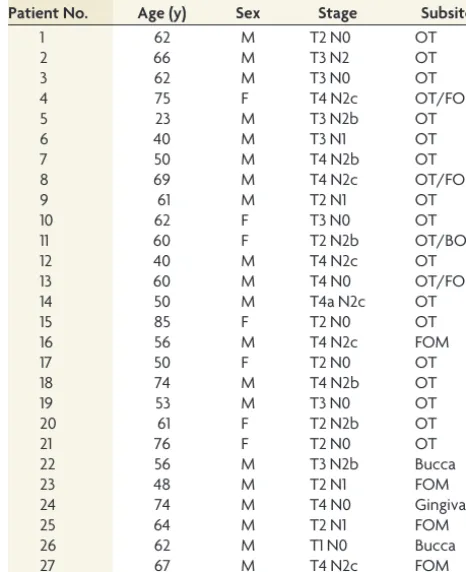
Table 1: Patient demographics
Patient No. Age (y) Sex Stage Subsite
1 62 M T2 N0 OT
2 66 M T3 N2 OT
3 62 M T3 N0 OT
4 75 F T4 N2c OT/FOM
5 23 M T3 N2b OT
6 40 M T3 N1 OT
7 50 M T4 N2b OT
8 69 M T4 N2c OT/FOM
9 61 M T2 N1 OT
10 62 F T3 N0 OT
11 60 F T2 N2b OT/BOT
12 40 M T4 N2c OT
13 60 M T4 N0 OT/FOM
14 50 M T4a N2c OT
15 85 F T2 N0 OT
16 56 M T4 N2c FOM
17 50 F T2 N0 OT
18 74 M T4 N2b OT
19 53 M T3 N0 OT
20 61 F T2 N2b OT
21 76 F T2 N0 OT
22 56 M T3 N2b Bucca
23 48 M T2 N1 FOM
24 74 M T4 N0 Gingiva
25 64 M T2 N1 FOM
26 62 M T1 N0 Bucca
27 67 M T4 N2c FOM
examination. Necrosis was estimated by fifths (0%–20%, 20%– 40%, etc) for both primary and lymph nodes. The presence of calcification or ulceration was also noted.
Statistics
Associations between gene expression and imaging variables were assessed by use of Pearson correlation and ordinal regression for contiguous and categoric imaging features, respectively. Bonfer-roni correction set the adjusted significant level at aPvalueⱕ
.00036 for an unadjustedPvalueⱕ.05. Specific hypotheses to be tested based on other tumor types included 1) positive correla-tions between VEGF expression and enhancement10,11; 2) EGFR expression with necrosis, tumor size, and presence of nodal me-tastasis9,21; and 3) a negative correlation with cyclin D1 expres-sion and tumor size and invaexpres-sion.24We also hypothesized that because EGFR relates to growth and proliferation, it would have a positive correlation to mass effect,8though this trend has not been reported previously. To check for confounding factors and groups of imaging features, we also assessed the associations among imaging features themselves by using or-dinal regression (categoric vs continuous), Pearson correlation (continuous vs continuous), or the Fisher exact test (categoric vs categoric).
RESULTS
Images were available from 2001–2010. The average age of the patients was 59⫾13 years; of 27 patients, 20 (74%) were men (Table 1). Most tumors were located in the oral tongue (19/27, or 59%), with 4 tumors involving the floor of the mouth, 3 tumors involving the bucca or gingiva, and 4 tumors involving a combi-nation of sites. Primary tumors were staged pathologically as T1 in 1 patient, T2 in 9 patients, T3 in 6 patients, and T4 in 11 patients. Nodal staging was N0 in 10 patients, N1 in 4 patients, N2 in 13 patients, and N3 in no patients. Only 1 patient with a T4 N2b cancer of the oral tongue was found to test positive for HPV.
Imaging results revealed a spectrum of findings. The average size of the primary tumor was 3.6⫾1.2 cm in the long axis with an elliptic cross-sectional area of 6.1⫾5.8 cm2. All primary tumors enhanced to some degree with either avid enhancement (absolute 119⫾29 HU or normalized ratio 1.2⫾0.3), minimal enhance-ment (3 patients: absolute 89⫾16 HU or normalized ratio 1.2⫾ 0.2), or in 1 case rim enhancement with a primarily necrotic tu-mor. A total of 9 patients had invasion deep into the muscle, 3 had invasion into the bone, and the remaining patients did not have deep invasion. Although no gross perineural extension was seen on imaging, 8 patients had perineural invasion by pathologic ex-amination. Most tumors were irregular (n⫽22), ill defined (n⫽
21), and partially necrotic (n⫽21), and had mild to moderate mass effect (n⫽19) with few ulcers (n⫽9) and no calcifications. Of the 17 patients with pathologic nodal disease, 2 had tumors that were not readily detected on CT scanning. Of the affected largest lymph nodes, the average size was 1.4⫾0.4 cm in the long axis. Most lymph nodes enhanced (n⫽
12) and were necrotic (n⫽10), with 8 patients having ECS on pathologic ex-amination (only one of which was iden-tified on imaging). In these presurgical patients, no nodal calcification was seen and distant metastatic disease was not found.
Expression of VEGF receptors 1 and 2 correlated with enhancement of the primary tumor (P⫽.018 andP⫽.025, respectively; Fig 1), whereas EGFR cor-related with mass effect (P⫽.03; Fig 2). The hypothesis that EGFR would
corre-FIG 1. Scatterplot showing relationship of increased enhancement and VEGF receptors 1 and 2 expression. The linear fitting demon-strates that as the absolute enhancement in HU increases, the recep-tor expression (in log base 2) also increases.
[image:3.594.54.285.168.347.2]FIG 2. Bar graph reflecting positive correlation between the grading of mass effect and the expression of EGFR (in log base 2) with standard deviation bars.
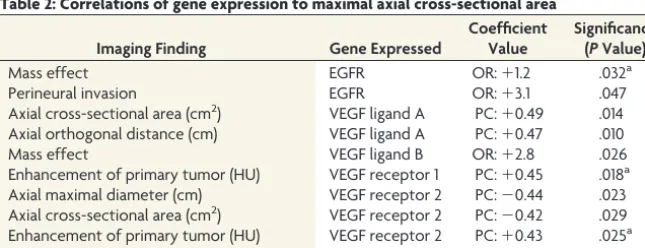
Table 2: Correlations of gene expression to maximal axial cross-sectional area
Imaging Finding Gene Expressed
Coefficient Value
Significance (PValue)
Mass effect EGFR OR:⫹1.2 .032a
Perineural invasion EGFR OR:⫹3.1 .047
Axial cross-sectional area (cm2) VEGF ligand A PC:⫹0.49 .014
Axial orthogonal distance (cm) VEGF ligand A PC:⫹0.47 .010
Mass effect VEGF ligand B OR:⫹2.8 .026
Enhancement of primary tumor (HU) VEGF receptor 1 PC:⫹0.45 .018a
Axial maximal diameter (cm) VEGF receptor 2 PC:⫺0.44 .023
Axial cross-sectional area (cm2) VEGF receptor 2 PC:⫺0.42 .029
Enhancement of primary tumor (HU) VEGF receptor 2 PC:⫹0.43 .025a
Enhancement of submandibular gland (HU) VEGF receptor 2 PC:⫹0.43 .026
Note:—cm indicates centimeter; OR, ordinal regression; PC, Pearson correlation.
[image:3.594.52.286.402.531.2] [image:3.594.54.377.590.714.2]late with necrosis, primary tumor size, or lymph node metastases was not supported. No significant correlations were found for cyclin D protein, VEGF ligand C, or VEGF receptor 3. However, a trend was observed toward cyclin D1 expression and decreased orthogonal primary tumor size (P⫽.11). Additional exploratory correlations that did not survive correction of significance values for multiple correlations are given in Table 2. As demonstrated in Fig 3, when the estimated cross-sectional area of the primary tu-mor increased, the expression of VEGF ligand A increased (P⫽
.01) but expression of VEGF receptor 2 decreased (P⫽.03). We also tested associations among imaging characteristics to look for confounding variables and groups of imaging character-istics. Larger tumors (maximal diameter, orthogonal, and cross-sectional area) tended to have more mass effect (P⫽.0018 –P⫽
.0035). The largest-diameter tumors correlated with invasion into muscle or bone (P⫽.04). The patients who had moderate to marked mass effect or perineural invasion on pathologic exami-nation had higher EGFR expression compared with those patients with neither moderate to marked mass effect nor perineural inva-sion (10.7⫾0.7 vs 10.2⫾0.4, respectively;P⫽.05 by unpairedt
test). Furthermore, 4 (50%) of 8 patients with moderate to marked mass effect had perineural invasion, but 4 (33%) of 12 patients with mild mass effect and none (0%) of 7 patients with no
mass effect had perineural invasion. This trend was not quite sta-tistically significant (P⫽.08; Fisher exact test between marked-mass-effect group and no-marked-mass-effect group). Also, enhancement tended to correlate with both the tumor and the submandibular gland as a regional control (P⫽.00005), possibly because of con-trast bolus differences among patients.
DISCUSSION
We tested correlates of the CT imaging appearance with genomic expression in a group of patients with previously untreated OSCC. Initial results suggest that degree of enhancement and mass effect indicate particular genetic alterations, similar to asso-ciations in other tumor types and related to drug targets. Limita-tions to this study included the small population, small number of genes tested, the relatively long period during which patients un-derwent imaging with varying imaging techniques, and the gen-eral nature of the retrospective review. None of the image-to-gene associations survived correction for the multiple correlations and, therefore, must be viewed with some skepticism. However, the associations demonstrated by other tumor types (eg, enhance-ment and VEGF receptors 1 and 2) are more likely to be true according to Bayesian probability. These simple correlations be-tween a single imaging measurement and single gene expression are reductions of the complex interactions between the host stroma and the tumor.
Despite these limitations, the correlations suggest that grouping imaging findings into imaging phenotypes may further correlate with specific driver genes. Increased EGFR has corre-lated previously with worse stage and prognosis with treatment resistance.18,19,26The association between size with mass effect and invasion, which also correlated with EGFR expression, may help to elucidate the association with tumor grade. The grouping of clinical and imaging findings into representative phenotypes could not only help in understanding and predicting genomic expression but also reinforce imagers’ search patterns and the risk for invasion, which may not be directly visualized on imaging.
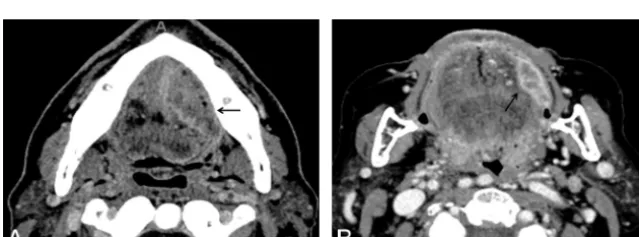
Smaller tumors had increased expression of different genes (VEGF receptor 2) than larger tumors (EGFR, VEGF ligand A), suggesting that tumor size and growth pattern are governed by underlying genomic expression and not solely by the time until diagnosis (Fig 3). Thus, a large tumor with invasion could suggest EGFR predominant expression, whereas a small tumor with avid enhancement could suggest increased VEGF receptor 2 expression (Fig 4). The differential ex-pression of VEGF ligands and receptors with varying imaging features indicates that further work is needed to under-stand the reported association between high VEGF expression and increased re-currence rates with poor survival out-come, which did not clarify the subtypes of the receptor or ligand.27
CONCLUSIONS
In summary, we demonstrated correla-tions between CT findings and OSCC
FIG 3. Scatterplot showing relationship of increasing primary tumor ellipsoid estimated cross-sectional area with increasing VEGF ligand A and decreased receptor 2 expression (in log base 2) with linear fitting.
[image:4.594.54.286.336.512.2] [image:4.594.55.375.562.680.2]gene expression. The size and invasion of the tumor (and there-fore stage and prognosis) may relate to specific driver gene expres-sion. Further studies are needed with a greater number of patients, additional imaging modalities, additional tumor sites, and other potentially relevant genes to determine if grouping imaging fea-tures related to gene expression into imaging phenotypes is useful in the management of head and neck squamous cell carcinoma.
Disclosures: Curtis Pickering—RELATED: Grant:NIH and CPRIT.* Mitchell Freder-ick—RELATED: Grant:NIH and Texas CPRIT, Comments: Genomic studies were funded by peer-reviewed grants from the NIH and Texas Cancer Prevention Insti-tute. Jiexin Zhang—RELATED: Grant:NIH and CPRIT.* *Money paid to institution.
REFERENCES
1. Ferlay J, Shin HR, Bray F, et al.Estimates of worldwide burden of cancer in 2008: GLOBOCAN 2008.Int J Cancer2010;127:2893–917 2. Jemal A, Siegel R, Xu J, et al.Cancer statistics, 2010.CA Cancer J Clin
2010;60:277–300
3. Leemans CR, Braakhuis BJ, Brakenhoff RH.The molecular biology of head and neck cancer.Nat Rev Cancer2011;11:9 –22
4. Argiris A, Karamouzis MV, Raben D, et al.Head and neck cancer.
Lancet2008;371:1695–709
5. Agrawal N, Frederick MJ, Pickering CR, et al.Exome sequencing of head and neck squamous cell carcinoma reveals inactivating muta-tions in NOTCH1.Science2011;333:1154 –57
6. Spector ME, Gallagher KK, Light E, et al.Matted nodes: poor prog-nostic marker in oropharyngeal squamous cell carcinoma indepen-dent of HPV and EGFR status.Head Neck2012;34:1727–33 7. Makkat S, Luypaert R, Stadnik T, et al.Deconvolution-based
dy-namic contrast-enhanced MR imaging of breast tumors: correla-tion of tumor blood flow with human epidermal growth factor re-ceptor 2 status and clinicopathologic findings–preliminary results.
Radiology2008;249:471– 82
8. Diehn M, Nardini C, Wang DS, et al.Identification of noninvasive imaging surrogates for brain tumor gene-expression modules.Proc Natl Acad Sci U S A2008;105:5213–18
9. Furnari FB, Fenton T, Bachoo RM, et al. Malignant astrocytic glioma: genetics, biology, and paths to treatment. Genes Dev
2007;21:2683–710
10. Leo C, Giaccia AJ, Denko NC.The hypoxic tumor microenviron-ment and gene expression.Semin Radiat Oncol2004;14:207–14 11. Maia AC, Jr., Malheiros SM, da Rocha AJ, et al.MR cerebral blood
volume maps correlated with vascular endothelial growth factor expression and tumor grade in nonenhancing gliomas.AJNR Am J Neuroradiol2005;26:777– 83
12. Shimizu H, Kumabe T, Shirane R, et al.Correlation between choline level measured by proton MR spectroscopy and Ki-67 labeling in-dex in gliomas.AJNR Am J Neuroradiol2000;21:659 – 65
13. Emblem KE, Scheie D, Due-Tonnessen P, et al.Histogram analysis of
MR imaging-derived cerebral blood volume maps: combined gli-oma grading and identification of low-grade oligodendroglial sub-types.AJNR Am J Neuroradiol2008;29:1664 –70
14. Jenkinson MD, du Plessis DG, Smith TS, et al.Histological growth patterns and genotype in oligodendroglial tumours: correlation with MRI features.Brain2006;129:1884 –91
15. Kanematsu M, Osada S, Amaoka N, et al.Expression of vascular endothelial growth factor in hepatocellular carcinoma and the sur-rounding liver: correlation with angiographically assisted CT.AJR Am J Roentgenol2004;183:1585–93
16. Emblem KE, Bjornerud A, Mouridsen K, et al.T(1)- and T(2)(*)-dominant extravasation correction in DSC-MRI: part II-predicting patient outcome after a single dose of cediranib in recurrent glio-blastoma patients.J Cereb Blood Flow Metab2011;31:2054 – 64 17. Zinn PO, Mahajan B, Sathyan P, et al.Radiogenomic mapping of
edema/cellular invasion MRI-phenotypes in glioblastoma multi-forme.PLoS One2011;6:e25451
18. Rubin Grandis J, Melhem MF, Gooding WE, et al.Levels of TGF-alpha and EGFR protein in head and neck squamous cell carcinoma and patient survival.J Natl Cancer Inst1998;90:824 –32
19. Pectasides E, Rampias T, Kountourakis P, et al.Comparative prog-nostic value of epidermal growth factor quantitative protein ex-pression compared with FISH for head and neck squamous cell car-cinoma.Clin Cancer Res2011;17:2947–54
20. Bauman JE, Michel LS, Chung CH.New promising molecular tar-gets in head and neck squamous cell carcinoma.Curr Opin Oncol
2012;24:235– 42
21. Choi BB, Kim SH, Kang BJ, et al.Diffusion-weighted imaging and FDG PET/CT: predicting the prognoses with apparent diffusion co-efficient values and maximum standardized uptake values in pa-tients with invasive ductal carcinoma. World J Surg Oncol
2012;10:126
22. Mahdey HM, Ramanathan A, Ismail SM, et al.Cyclin D1 amplifica-tion in tongue and cheek squamous cell carcinoma.Asian Pac J Can-cer Prev2011;12:2199 –204
23. Feng Z, Guo W, Zhang C, et al.CCND1 as a predictive biomarker of neoadjuvant chemotherapy in patients with locally advanced head and neck squamous cell carcinoma.PLoS One2011;6:e26399 24. van Diest PJ, Michalides RJ, Jannink L, et al.Cyclin D1 expression in
invasive breast cancer. Correlations and prognostic value.Am J Pathol1997;150:705–11
25. Stransky N, Egloff AM, Tward AD, et al.The mutational landscape of head and neck squamous cell carcinoma.Science2011;333:1157– 60 26. Chung CH, Zhang Q, Hammond EM, et al.Integrating epidermal growth factor receptor assay with clinical parameters improves risk classification for relapse and survival in head-and-neck squamous cell carcinoma.Int J Radiat Oncol Biol Phys2011;81:331–38 27. Smith BD, Smith GL, Carter D, et al.Prognostic significance of