CLINICAL REPORT
PEDIATRICS
Comparison of Spin-Echo T1- and T2-Weighted and
Gradient-Echo T1-Weighted Images at 3T in Evaluating Very
Preterm Neonates at Term-Equivalent Age
B. Sarikaya, A.M. McKinney, B. Spilseth, and C.L. Truwit
ABSTRACT
SUMMARY: Term-equivalent imaging can assess myelination status in very preterm infants (⬍30 weeks’ gestational age at birth). How-ever, myelination assessment has yet to be compared among GRE-T1WI, SE-T1WI, and SE-T2WI at 3T. We aimed to compare the rates of myelination among those 3 sequences in 11 very preterm neonates who underwent 3T MR imaging at term-equivalent age and subsequently had normal neurologic development. On each sequence, 2 neuroradiologists individually assessed 22 structures. SE-T2WI depicted a higher myelination rate (present in 58.2%– 66.4% of all structures) than either GRE-T1WI (51.6%– 63.9%) or SE-T1WI (20.5%–38.5%), while GRE-T1WI had the highest interobserver agreement (, 0.56;P⬍.0001). Myelination was present in 90%–100% of patients within the corpus callosum splenium, DSCP, ICP, lateral lemniscus, and spinal tract/nucleus of cranial nerve V on SE-T2WI, and in the DSCP, ICP, lateral lemniscus, medial lemniscus, pyramidal decussation, PLIC, and superior cerebellar peduncle on GRE-T1WI, occurring in similar structures as previously shown at 1.5T and 1T. However, it is not clear whether these findings represent true myelination versus precursors to myelination.
ABBREVIATIONS:DSCP⫽decussation of superior cerebellar peduncles; GRE⫽gradient-recalled echo; ICP⫽inferior cerebellar peduncle; PLIC⫽posterior limb of the internal capsule, SE⫽spin-echo
T
erm-equivalent brain MR imaging has been used as a predic-tor of late outcome in preterm infants in many centers, though it remains a controversial part of early clinical manage-ment.1,2One reason some have advocated an initial MR imagingas standard practice at term-equivalent age is that as many as 10%–15% of very preterm infants (ⱕ30 weeks’ gestational age at birth) develop cerebral palsy, while up to 50% may subsequently exhibit a neurobehavioral problem.3
MR imaging can detect more subtle forms of white matter injury and aids in the assessment of the extent of myelination, a surrogate marker of brain maturation.
At 1.5T and at 1T, earlier studies have demonstrated that cer-tain structures are expected to be myelinated at term and term-equivalent imaging on SE-T1WI and SE-T2WI, most notably the DSCP, ICP, medial lemniscus, PLIC, and the superior cerebellar peduncle.4,5However, there are as of yet no studies regarding the
myelination patterns of premature infants imaged at
term-equiv-alent age by using GRE-T1WI at 3T.6Also, there has not yet been
a comparative evaluation of different T1WI acquisition methods at 3T, such as GRE-T1WI versus SE-T1WI, for detecting myeli-nation. This is important because SE-T1WI exhibits less gray-white differentiation at 3T; we observed, before our study, that GRE-T1WI may depict T1-bright myelination earlier than SE-T1WI in infants at 3T. Hence, in this study, we set out to evaluate myelination at term-equivalent age in very premature infants with subsequently normal neurologic development; our goal was to determine which regions consistently exhibit myelination on these sequences by comparing various landmarks, based largely on a previous study by Barkovich.4
MATERIALS AND METHODS
Internal review board approval was obtained for this retrospective study. An imaging data base and clinical record review during 3 years (January 2007–January 2010) yielded 24 very preterm in-fants (⬍30 weeks) who underwent 3T MR imaging at term-equiv-alent age (38 – 42 weeks) that used all 3 sequences, SE-T1WI, GRE-T1WI, and SE-T2WI, and had no neurologic symptoms at clinical follow-up at 9 months of age or older (as determined by a pediatric neurologist), based on inclusion criteria from a previous study with a similar patient population.7Of the 24 patients from
the data base search, 13 were excluded at initial review: 9 due to MR imaging abnormalities such as hypoxic-ischemic insult or T1-bright periventricular foci (n⫽4), germinal matrix or paren-Received April 28, 2012; accepted after revision July 29.
From the Department of Radiology/Neuroradiology, University of Minnesota and Hennepin County Medical Centers, Minneapolis, Minnesota.
Paper previously presented in preliminary form at: 48th Annual Meeting of the American Society of Neuroradiology and Neuroradiology Education and Research Foundation Symposium, May 15–20, 2010; Boston, Massachusetts.
Please address correspondence to Basar Sarikaya, Department of Radiology, Uni-versity of Minnesota, MMC 292, 420 Delaware St SE, Minneapolis, MN, 55455; e-mail: [email protected]
chymal hemorrhage (n⫽3), periventricular leukomalacia (n⫽ 1), or a congenital structural abnormality (n⫽1). The remainder of excluded patients were due to suboptimal imaging or severe motion (n⫽4). Of the remaining 11 patients included for anal-ysis, 5 were male and 6 were female, with a gestational age at birth ranging from 25 weeks⫹5 days to 28 weeks⫹1 day.
MR Imaging Technique
All studies were performed on a single 3T MR imaging unit (In-tera; Philips Medical Systems, Best, the Netherlands), with pa-tients sedated by a pediatric intensivist. The imaging parameters for GRE-T1WI were a volumetric acquisition of 9.8/4.6 ms/8°/ 15–20 cm/1 (TR/TE/flip angle/FOV/NEX), with a matrix of 169⫻ 169 –240⫻240, a section thickness of 1 mm (0 mm gap), and an acquisition time of approximately 5 minutes; these were recon-structed and stored within the PACS in the axial plane at a section thickness of 3 mm. For SE-T1WI, the parameters were 353– 734/10 ms/14 –20 cm/1 (TR/TE/FOV/NEX), with a matrix of 168⫻132–265⫻205, axial thickness of 3 mm (0.3- to 1-mm gap), and an acquisition time of approximately 5 minutes. For turbo SE-T2WI, the parameters were a turbo factor of 14; 3000/ 80 –122 ms/14 –20 cm/2 (TR/TE/FOV/NEX); a matrix of 268⫻ 190 – 400⫻312; an axial section thickness of 3 mm (0.3- to 1-mm gap); and an acquisition time of approximately 2.5 minutes.
Image Interpretation
Two staff neuroradiologists (A.M.M.,C.L.T.,each with⬎7 years’ experience in interpreting neonatal MR imaging), independently assessed 22 structures, evaluating each sequence separately. The structures were adapted from a previous study and were the
ante-rior and posteante-rior commissures, anteante-rior limb of the internal cap-sule, brachium of the inferior colliculus, corpus callosum sp-lenium, cranial nerve V fascicle, corticospinal tracts, DSCP, habenular commissure, ICP, lateral geniculate nucleus, lateral lemniscus, medial lemniscus, medial longitudinal fasciculus, op-tic nerves, opop-tic radiations, opop-tic tracts, pyramidal decussation, PLIC, perirolandic cortex, superior cerebellar peduncle, and the spinal tract/nucleus of cranial nerve V.4The staff members
con-sulted a dedicated imaging atlas to delineate the location of smaller brain stem structures.8Each of the 22 structures was
tab-ulated as “myelinated” (⫹, relatively hyperintense on GRE/SE-T1WI or hypointense on SE-T2WI compared with surrounding structures or periventricular white matter), “nonmyelinated” (⫺), or “equivocal” (⫾).
Regarding statistical analysis for each sequence, the overall myelination rates of all structures were calculated, and an inter-observerwas calculated.
RESULTS
Regarding all 11 patients included for imaging review, the myeli-nation rates according to reviewers 1 and 2, respectively, were “definitely positive” (ie, scored as “⫹”) in 58.2% and 66.4% of all 22 structures analyzed on SE-T2WI, 51.6% and 63.9% on GRE-T1WI, and 20.5% and 38.5% on SE-T1WI.
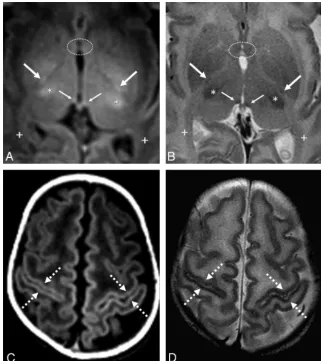
The Table shows the percentage of patients myelinated in each region. The anterior limbs of the internal capsules and optic radi-ations were consistently nonmyelinated as expected (Fig 1), while the anterior and posterior commissures and the medial longitu-dinal fasciculi consistently lacked myelination on both SE-T1WI
Percentage of patients myelinated in each region per the 2 observers
SE T2WI SE T1WI GRE T1WI
Observer 1 Observer 2 Observer 1 Observer 2 Observer 1 Observer 2
AC 36.4% (4/11) 0% (0/11) 0% (0/11) 0% (0/11) 0% (0/11) 0% (0/11)
ALIC 0% (0/11) 0% (0/11) 0% (0/11) 0% (0/11) 0% (0/11) 0% (0/11)
BIC 54.5% (6/11) 100% (11/11) 9% (1/11) 45.5% (5/11) 36.4% (4/11) 100% (11/11)
CCS 90.9% (10/11)a 90.9% (10/11)a 9% (1/11) 45.5% (5/11) 18.2% (2/11) 90.9% (10/11)
CNV 63.6% (7/11) 100% (11/11) 0% (0/11) 45.5% (5/11) 81.8% (9/11) 90.9% (10/11)
CST 0% (0/11) 36.4% (4/11) 27.3% (3/11) 45.5% (5/11) 36.4% (4/11) 81.8% (9/11)
DSCP 100% (11/11)a 100% (11/11)a 27.3% (3/11) 81.8% (9/11) 100% (11/11)a 100% (11/11)a
HC 81.8% (9/11) 72.7% (8/11) 54.5% (6/11) 63.6% (7/11) 72.7% (8/11) 72.7% (8/11)
ICP 90.9% (10/11)a 100% (11/11)a 72.7% (8/11) 63.6% (7/11) 90.9% (10/11)a 100% (11/11)a
LGN 18.2% (2/11) 63.6% (7/11) 0% (0/11) 27.3% (3/11) 27.3% (3/11) 72.7% (8/11)
LL 100% (11/11)a 100% (11/11)a 54.5% (6/11) 81.8% (9/11) 100% (11/11)a 100% (11/11)a
ML 81.8% (9/11) 100% (11/11) 9.1% (1/11) 81.8% (9/11) 90.9% (10/11)a 100% (11/11)a
MLF 27.3% (3/11) 36.4% (4/11) 0% (0/11) 0% (0/11) 0% (0/11) 9% (1/11)
ON 45.5% (5/11) 18.2% (2/11) 9% (1/11) 9% (1/11) 72.7% (8/11) 27.3% (3/11)
OR 0% (0/11) 0% (0/11) 0% (0/11) 0% (0/11) 0% (0/11) 0% (0/11)
OT 81.8% (9/11) 63.6% (7/11) 27.3% (3/11) 27.3% (3/11) 45.5% (5/11) 36.4% (4/11)
PC 18.2% (2/11) 9.1% (1/11) 0% (0/11) 0% (0/11) 0% (0/11) 0% (0/11)
PD 63.6% (7/11) 100% (11/11) 18.2% (2/11) 27.3% (3/11) 90.9% (10/11)a 100% (11/11)a
PLIC 81.8% (9/11) 90.9% (10/11) 81.8% (9/11) 81.8% (9/11) 100% (11/11)a 100% (11/11)a
PRC 81.8% (9/11) 100% (11/11) 0% (0/11) 45.5% (5/11) 18.2% (2/11) 72.7% (8/11)
SCP 81.8% (9/11) 90.9% (10/11) 36.4% (4/11) 54.5%(6/11) 90.9% (10/11)a 100% (11/11)a
STV 90.9% (10/11)a 100% (11/11)a 18.2% (2/11) 36.4% (4/11) 72.7% (8/11) 63.6% (7/11)
Note:—AC indicates anterior commissure; ALIC, anterior limb of the internal capsule; BIC, brachium of the inferior colliculus; CCS, corpus callosum splenium; CNV, cranial nerve V; CST, corticospinal tracts; HC, habenular commissure; LGN, lateral geniculate nucleus; LL, lateral lemniscus; ML, medial lemniscus; MLF, medial longitudinal fasciculus; ON, optic nerve; OR, optic radiations; OT, optic tracts; PC, posterior commissure; PRC, perirolandic cortex; PD, pyramidal decussation; SCP, superior cerebellar peduncle; STV, spiral tract/nucleus of cranial nerve V.
and GRE-T1WI and exhibited a very low myelination rate on SE-T2WI.
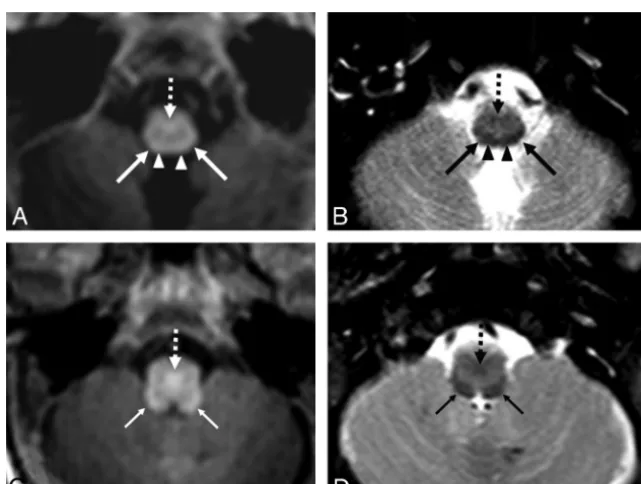
Structures such as the DSCP, ICP, and lateral lemniscus had quite high myelination rates and high agreement between observers, with 90%–100% of patients being myelinated in those 3 structures on both SE-T2WI and GRE-T1WI (Figs 2 and 3). The medial lemniscus, PLIC, and the superior cerebellar peduncle also exhibited nearly as high rates of myelination, with a range of 81.8%–100% for both ob-servers, based on both SE-T2WI and GRE-T1WI.
According to both observers, SE-T2WI showed higher rates of
myelination than GRE-T1WI in the following sites: optic tracts, peri-rolandic cortex, and the spinal tract/nucleus of cranial nerve V. On the other hand, per both observers, GRE-T1WI had higher myelina-tion rates than SE-T2WI in the following sites: corticospinal tracts, optic nerves, PLIC, and the superior cerebellar peduncle (Figs 4 and 5). GRE-T1WI was clearly superior to SE-T1WI for detecting myeli-nation in all sites that had a myelimyeli-nation rate of⬎0% (Figs 1–3).
Interobserveron GRE-T1WI was moderate-high (⫽0.56); and on both SE-T2WI (⫽0.43) and SE-T1WI (⫽0.40), it was moderate (eachP⬍.0001).
FIG 1. GRE-T1WI (A), SE-T1WI (B), and SE-T2WI (C) at the level of the nonmyelinated anterior commissure (arrows) and optic radiations (dashed arrows) in a very preterm infant (27 weeks⫹3 days) imaged at term-equivalent age (40 weeks⫹2 days). Note the myelinated PLIC (thin arrows) and habenular commissure (thin dashed arrows), both of which were myelinated in most infants on both GRE-T1WI and on SE-T2WI.
[image:3.594.54.531.47.216.2] [image:3.594.56.532.259.532.2]DISCUSSION
Myelination, a dynamic process in the developing brain, may be the most important indicator of brain maturation.5 This fact
prompted us to determine which anatomic structures had high rates of myelination at 3T. On the basis of both SE-T2WI and GRE-T1WI, we found these sites to be the DSCP, ICP, and the lateral lemniscus, each of which had myelination in 90%–100% of term-equivalent patients, according to both observers. Other sites, such as the corpus callosum splenium, DSCP, medial lem-niscus, pyramidal decussation, PLIC, superior cerebellar pedun-cle, and spinal tract/nucleus of cranial nerve V also exhibited nearly as high rates of myelination but were favored by 1 sequence (either SE-T2WI or GRE-T1WI). We also found that SE-T2WI showed slightly higher overall rates of myelination and that GRE-T1WI clearly outperformed SE-GRE-T1WI in myelination evaluation at 3T.
Assessment of normal myelination is one of the most impor-tant questions to be answered by neonatal imaging, for which previous studies at lower field strengths have used SE-T1WI to assess the degree of myelination.4,5,9,10Because the myelination
patterns at 3T and on GRE-T1WI are largely unknown, we as-sessed myelination in term-equivalent infants to not only deter-mine their myelination patterns but to also compare 3 commonly used sequences at 3T in a head-to-head manner. To our knowl-edge, there are no previous studies comparing the myelination patterns on GRE-T1WI with either SE-T1WI or SE-T2WI in ne-onates or premature infants. On the basis of our results, GRE-T1WI was superior to SE-GRE-T1WI both in detecting rates of “myeli-nation” of each structure and regarding interobserver agreement. We acknowledge that it has not been proved that such structures are hyperintense as a result of successful myelination.
Our results were similar in some aspects to those in a previous
FIG 3. Comparison among GRE-T1WI (A), SE-T1WI (B), and SE-T2WI (C) at the level of the midbrain in a very preterm infant (26 weeks⫹0 days) imaged at term-equivalent age (40 weeks⫹1 day). The DSCP (arrows) and the brachium of the inferior colliculus (dashed arrows) are depicted. The DSCP was myelinated in all term-equivalent infants on both GRE-T1WI and SE-T2WI, while the brachium of the inferior colliculus was variably myelinated on these 2 sequences.
[image:4.594.58.531.49.183.2] [image:4.594.132.453.239.481.2]study of 12 term neonates performed at a lower field strength, in which structures such as the DSCP, ICP, lateral lemniscus, medial lemniscus, pyramidal decussation, PLIC, and the superior cere-bellar peduncle also demonstrated higher rates of myelination on GRE-T1WI than in our study.4However, our study may
contra-dict prior data that T1-weighted precedes T2-weighted images in detecting myelination; in particular, our study found a higher rate of myelination within the optic tracts, perirolandic cortex, and spinal tract/nucleus of cranial nerve V on SE-T2WI compared with GRE-T1WI at 3T. In a previous study of very preterm infants imaged at term-equivalent age at 1T, the authors compared 3 different sequences (SE-T1WI, inversion recovery, and SE-T2WI) and found a higher percentages of myelination on SE-T1WI rel-ative to SE-T2WI in most white matter structures; the large ma-jority of patients exhibited myelination in the DSCP, ICP, lateral lemniscus, medial lemniscus, PLIC, and superior cerebellar pe-duncle.5Such results are similar to our findings on SE-T2WI and
GRE-T1WI, with the addition of a high rate of myelination of the corpus callosum splenium and spinal tract/nucleus of cranial nerve V on SE-T2WI, and the cranial nerve V fascicle and pyra-midal decussation on GRE-T1WI (each⬎80%).
Additionally, our study at 3T found a slightly greater extent of myelination overall on SE-T2WI than on GRE-T1WI, which may be due to several factors. First, the use of a 3T field strength likely played a role, in which there is theoretically a 3-fold increase in SNR from 1T that augments the visualization of abnormalities on SE-T2WI.11-14Second, SE-T2WI at 3T may display greater
back-ground white matter hyperintensity in premature patients, thus creating greater contrast of certain structures to background white matter. Third, the difference in rates of myelination detec-tion between SE-T2WI and GRE-T1WI is slight and could even be accounted for by interobserver differences.
We acknowledge that it has yet to be proved that T1-bright signal within structures on GRE-T1WI represents true myelina-tion. The potential drawback of SE-T1WI at 3T is that the gray-white matter contrast on SE-T1WI is lessened compared with lower field strengths; this occurs due to prolongation of the T1 times of tissue to the point at which T1 times can be closer to-gether.15,16Because the overall contrast between various
ana-tomic landmarks of the brain is likely diminished on SE-T1WI at 3T, GRE-T1WI has been proposed as an alternative to obtain T1WI at 3T. Our results suggest that GRE-T1WI could potentially
FIG 5. GRE-T1WI (AandC) and SE-T2WI (BandD) in a very preterm infant (26 weeks⫹4 days) imaged at term-equivalent age (40 weeks⫹2 days).
[image:5.594.132.454.47.409.2]replace SE-T1WI as a sequence to evaluate myelination at 3T.17
However, this necessitates future evaluation with long-term fol-low-up MR imaging and clinical data to determine whether such T1-bright structures truly reflect active myelination or are precur-sors of myelination. In this regard, a preliminary study using dif-fusion tensor imaging in preterm infants at term-equivalent age had noted higher fractional anisotropy in such regions but still questioned whether those findings reflected accelerated myelina-tion or maturamyelina-tion versus activity focally induced in affected pathways.18Thus, future studies could use diffusion tensor
imag-ing to determine whether T1-hyperintense and T2-hypointense regions at 3T truly reflect myelination.18-21
This study had several limitations, including the inherent lim-itations of a retrospective study. Qualitative analysis based on subjective scoring can also be considered a limitation, in the ab-sence of a consensus review, though subjectivity is inherent in regular daily practice. We note that 1 goal of this study was to evaluate for such “subjectivity” at 3T to ascertain whether and in what structures myelination could be reproducibly identified and found that, at a minimum, the DSCP, ICP, and lateral lemniscus were reliably identified as myelinated by both observers on both SE-T2WI and GRE-T1WI. Technical limitations also exist, such as motion between sequences or artifacts such as pulsation, which could alter the visualization of smaller structures. Also, other lim-itations include the lack of a control group (such as term infants) with which to compare myelination patterns, the relatively small number of patients, and the lack of a longitudinal follow-up im-aging with time. Despite the fact that the patients within this study demonstrated normal neurologic development at least up to 9 months, we acknowledge that minor neurologic deficits and de-velopmental delays could become manifest at later ages.
CONCLUSIONS
Our results suggest that both SE-T2WI and GRE-T1WI are much more sensitive than SE-T1WI in detecting myelination in term-equivalent very preterm infants at 3T. While SE-T2WI detects a slightly greater rate of myelination, GRE-T1WI has higher inter-observer reliability. At a minimum, the DSCP, ICP, and lateral lemniscus can be reliably identified as myelinated on both SE-T2WI and GRE-T1WI. However, this pattern has yet to be vali-dated in healthy term infants, and further prospective research is necessary to confirm whether the bright signal on GRE-T1WI and dark signal on SE-T2WI at 3T in such structures truly represent myelination.
Disclosures: Alexander M. McKinney—UNRELATED:Board Membership: Vital Im-ages (Minnetonka, Minnesota),Comments: Advisory Board member, less than $2000 per year compensation.
REFERENCES
1. El-Dib M, Massaro AN, Bulas D, et al.Neuroimaging and neurode-velopmental outcome of premature infants. Am J Perinatol
2010;27:803–18
2. Milgrom J, Newnham C, Anderson PJ, et al.Early sensitivity training for parents of preterm infants: impact on the developing brain. Pe-diatr Res2010;67:330 –35
3. Jacobs S, Hunt R, Tarnow-Mordi W, et al.Cooling for newborns with hypoxic ischemic encephalopathy.Cochrane Database Syst Rev
2003;4:CD003311
4. Barkovich AJ.MR of the normal neonatal brain: assessment of deep structures.AJNR Am J Neuroradiol1998;19:1397– 403
5. Counsell SJ, Maalouf EF, Fletcher AM, et al.MR imaging assessment of myelination in the very preterm brain.AJNR Am J Neuroradiol
2002;23:872– 81
6. Wintersperger BJ, Runge VM, Biswas J, et al.Brain tumor enhance-ment in MR imaging at 3 Tesla: comparison of SNR and CNR gain using TSE and GRE techniques.Invest Radiol2007;42:558 – 63 7. Aeby A, Liu Y, De Tie`ge X, et al.Maturation of thalamic radiations
between 34 and 41 weeks’ gestation: a combined voxel-based study and probabilistic tractography with diffusion tensor imaging.
AJNR Am J Neuroradiol2009;30:1780 – 86
8. Naidich TP, Duvernoy HM, Delman BN, et al.Duvernoy’s Atlas of the Human Brain Stem and Cerebellum.New York: Springer-Verlag; 2009 9. Rutherford MA, Pennock JM, Counsell SJ, et al.Abnormal magnetic resonance signal in the internal capsule predicts poor neurodevel-opmental outcome in infants with hypoxic-ischemic encephalopa-thy.Pediatrics1998;102:323–28
10. Liauw L, Palm-Meinders IH, van der Grond J, et al.Differentiating normal myelination from hypoxic-ischemic encephalopathy on T1-weighted MR images: a new approach.AJNR Am J Neuroradiol
2007;28:660 – 65
11. Edelstein WA, Glover GH, Hardy CJ, et al.The intrinsic signal-to-noise ratio in NMR imaging.Magn Reson Med1986;3:604 –18 12. Runge VM, Patel MC, Baumann SS, et al.T1-weighted imaging of the
brain at 3 Tesla using a 2-dimensional spoiled gradient echo tech-nique.Invest Radiol2006;41:68 –75
13. Nielsen K, Rostrup E, Frederiksen JL, et al.Magnetic resonance im-aging at 3.0 Tesla detects more lesions in acute optic neuritis than at 1.5 Tesla.Invest Radiol2006;41:76 – 82
14. Runge VM, Case RS, Sonnier HL.Advances in clinical 3-Tesla neu-roimaging.Invest Radiol2006;41:63– 67
15. Lu H, Nagae-Poetscher LM, Golay X, et al.Routine clinical brain MRI sequences for use at 3.0 Tesla. J Magn Reson Imaging
2005;22:13–22
16. Hu X, Norris DG.Advances in high-field magnetic resonance imag-ing.Annu Rev Biomed Eng2004;6:157– 84
17. Stehling C, Niederstadt T, Kramer S, et al.Comparison of a T1-weighted inversion-recovery-, gradient-echo- and spin-echo se-quence for imaging of the brain at 3.0 Tesla[in German].Rofo
2005;177:536 – 42
18. Gime´nez M, Miranda MJ, Born AP, et al.Accelerated cerebral white matter development in preterm infants: a voxel-based morphome-try study with diffusion tensor MR imaging. Neuroimage
2008;41:728 –34
19. Gao W, Lin W, Chen Y, et al.Temporal and spatial development of axonal maturation and myelination of white matter in the develop-ing brain.AJNR Am J Neuroradiol2009;30:290 –96
20. Hu¨ppi PS, Posse S, Lazeyras F, et al.Magnetic resonance in preterm and term newborns: 1H-spectroscopy in developing human brain.
Pediatr Res1991;30:574 –78