ORIGINAL RESEARCH
ADULT BRAIN
Longitudinal Microstructural Changes in Traumatic Brain
Injury in Rats: A Diffusional Kurtosis Imaging, Histology, and
Behavior Study
XM.-L. Wang,XM.-M. Yu,XD.-X. Yang,X Y.-L. Liu,XX.-E. Wei, andXW.-B. Li
ABSTRACT
BACKGROUND AND PURPOSE: Traumatic brain injury is a major public health problem worldwide. Accurately evaluating the brain microstructural changes in traumatic brain injury is crucial for the treatment and prognosis assessment. This study aimed to assess the longitudinal brain microstructural changes in traumatic brain injury in the rat using diffusional kurtosis imaging.
MATERIALS AND METHODS: Diffusional kurtosis imaging was performed in a group of 5 rats at preinjury and 3, 14, and 28 days after traumatic brain injury. The diffusional kurtosis imaging parameters were measured in the bilateral cortex, hippocampus, and corpus callosum. Another 4 groups of 5 rats were used in brain immunohistochemistry analysis of neuron (neuron-specific nuclear protein [NeuN]), astroglia (glial fibrillary acidic protein [GFAP]), microglia (ionized calcium binding adaptor molecule 1 [Iba-1]), and myelin (myelin basic protein [MBP]) in the same area as the diffusional kurtosis imaging parameter measurements. Furthermore, 2 groups of 6 rats underwent a Morris water maze test at 28 days after traumatic brain injury. The diffusional kurtosis imaging parameters, immunohistochemistry results, and Morris water maze test results were compared longitudinally or between traumatic brain injury and control groups.
RESULTS:Compared with baseline, traumatic brain injury in the rat showed higher mean kurtosis and mean diffusivity values in the ipsilateral perilesional cortex and hippocampus and lower fractional anisotropy values in the corpus callosum (P⬍.05). The traumatic brain injury group showed higher staining of GFAP and Iba-1 and lower immunohistochemistry staining of NeuN and MBP in all ipsilateral ROIs (P⬍.05). There was no significant difference in the contralateral ROIs in diffusional kurtosis imaging parameters or immunohistochemistry results. The Morris water maze test revealed lower platform crossing times in the probe test (P⬍.05).
CONCLUSIONS: Our study indicated that there were longitudinal changes in diffusional kurtosis imaging parameters, accompanied by multiple pathologic changes at different time points following traumatic brain injury, and that mean kurtosis is more sensitive to detect microstructural changes, especially in gray matter, than mean diffusivity and fractional anisotropy.
ABBREVIATIONS:Da⫽axial diffusion; DKI⫽diffusional kurtosis imaging; Dr⫽radial diffusion; FA⫽fractional anisotropy; GFAP⫽glial fibrillary acidic protein; Iba-1⫽ionized calcium binding adaptor molecule 1; IHC⫽immunohistochemistry; Ka⫽axial kurtosis; Kr⫽radial kurtosis; MBP⫽myelin basic protein; MD⫽mean diffusivity; MK⫽mean kurtosis; NeuN⫽neuron-specific nuclear protein; TBI⫽traumatic brain injury
T
raumatic brain injury (TBI) is one of the most serious public health problems worldwide. After injury, a significant num-ber of patients with TBI will experience neurologic andnon-neu-rologic disorders, among which cognitive impairment is most common.1Although most patients recover to baseline cognitive function within 1–3 months, some patients have persistent cog-nitive impairment.2,3At present, how TBI could lead to the oc-currence and persistence of cognitive impairment is poorly un-derstood. Finding a reliable noninvasive biomarker to accurately evaluate brain pathologic changes after TBI is crucial for TBI management and prognosis assessment.
MR imaging, as a noninvasive tool, is increasingly used to assess the pathologic changes in TBI. Diffusion tensor imaging has shown great promise in evaluating the brain microstructural Received March 28, 2018; accepted after revision June 2.
From the Departments of Radiology (M.-L.W., M.-M.Y., X.-E.W., W.-B.L.) and Neuro-surgery (D.-X.Y., Y.-L.L.), Shanghai Jiao Tong University Affiliated Sixth People’s Hospital, Shanghai Jiao Tong University School of Medicine, Shanghai, China; and Imag-ing Center (W.-B.L.), Kashgar Prefecture Second People’s Hospital, Kashgar, China.
Ming-Liang Wang and Meng-Meng Yu contributed equally to this work. This work was supported by the National Natural Science Foundation of China (No. 81271540, 81301213), Natural Science Foundation of Xinjiang Province (No. 2016D01C083), Medical-Engineering Cross Project of Shanghai Jiao Tong University (No. YG2015MS19), the Shanghai Health and Family Planning Commission research projects (No. 20164Y0065), and the Shanghai Key Discipline of Medical Imaging (No. 2017ZZ02005).
Please address correspondence to Wen-Bin Li, MD, No. 600, Yi Shan Rd, Shanghai 200233, China; e-mail: [email protected]
Indicates open access to non-subscribers at www.ajnr.org
Indicates article with supplemental on-line photos.
changes. DTI assumes a Gaussian distribution for the water mol-ecule in measured tissue and could quantify water molmol-ecule di-rectional diffusion characteristics.4The DTI parameters, includ-ing fractional anisotropy (FA) and mean diffusivity (MD) changes, have been widely used to assess white matter injury in both hu-man5-8and animal studies.9-12However, the actual distribution of water in brain tissue is usually non-Gaussian, especially for the largely isotropic gray matter. The DTI technique might not detect the real microstructural pathologic changes.
Diffusional kurtosis imaging (DKI), using the non-Gaussian model of water diffusion, could overcome this limitation.13,14 Apart from DTI parameters, it provides additional kurtosis met-rics, including mean kurtosis (MK), to depict the heterogeneity of brain microstructure. Previous studies have shown that the MK value in the thalamus might be useful in the early prediction of brain damage and cognitive outcome.15,16As for the underlying pathologic changes, only reactive astrogliosis has proved to be directly linked to increased MK values in an acute and subacute TBI animal study.17
However, apart from reactive astrogliosis, TBI has other pathologic processes, including but not limited to neuron loss, axonal damage, demyelination, and microgliosis, which may also have an effect on diffusional kurtosis.18-20The MR imaging pa-rameters should be a summary marker of all the possible TBI microstructural pathologic changes.21Figuring out the radiolog-ic-pathologic relationship and the evolving laws in the process of TBI will improve the interpretation of DKI parameter changes and finally promote the application of the DKI sequence in the clinical diagnosis and assessment of patients with TBI.
In this study, we hypothesized the following: 1) There would be changes in DKI parameters at different time points following TBI, and 2) DKI parameters could reflect multiple pathologic changes in the process of TBI. Our study aimed to investigate the longitudinal changes of DKI parameters and pathologic changes in the TBI rat brain. These findings will deepen our knowledge of longitudinal microstructural pathologic changes of TBI and pro-mote the use of the DKI sequence in clinical practice.
MATERIALS AND METHODS
Traumatic Brain Injury Rat ModelAll work was performed in accordance with the Institutional An-imal Care and Experiment Committee of Shanghai Jiao Tong University Affiliated Sixth People’s Hospital. Five adult male Sprague-Dawley rats (250 –300 g) underwent longitudinal MR imaging examinations preinjury and 3, 14, and 28 days after TBI. Another 20 adult male rats were assigned to 4 groups (preinjury and 3, 14, and 28 days after TBI) for histopathologic analysis. Further-more, 2 groups of adult male rats (TBI group,n⫽6 and control group,n⫽6) had a Morris water maze test at 28 days after TBI.
The induction of TBI was done by a controlled cortical impact device (PinPoint Precision Cortical Impactor PCI3000; Hatteras Instruments, Cary, North Carolina). First, Sprague-Dawley rats were anesthetized with ketamine and mounted in a stereotaxic frame. Second, a Ø4-mm craniotomy was created at 3.5 mm pos-terior and 4 mm lateral to the bregma, exposing the dura mater. Third, a 3-mm impactor tip connected to the controlling system was used to deliver the controlled cortical impact at a deformation
depth of 1.5 mm, a velocity of 2 m/s, and a dwell time of 100 ms. Rats were excluded if the dura mater integrity was breached. Last, the cranial opening was sealed with bone wax. Control animals underwent the same operation without the impact intervention.
MR Imaging Protocol and DKI Data Analysis
MR imaging was performed on a BioSpec 7T 20-cm horizontal bore scanner (Bruker BioSpin, Rheinstetten, Germany). The rats were fixed in an MR imaging– compatible rat head stereotaxic holder with ear and tooth bars. During the imaging time, the rat was anesthetized with 1%–2% isoflurane anesthesia and 1 L/min of oxygen administration. An MR imaging– compatible small-an-imal monitoring system was used to monitor the ansmall-an-imal’s respi-ration rate and body temperature. The rats underwent T2-weighted and DKI examinations at preinjury and 3, 14, and 28 days after TBI.
T2-weighted images were obtained to observe the general brain lesion using the following parameters: TR, 4500 ms; TE, 20, 60, 100, 140 ms; FOV, 30⫻30 mm; matrix, 128⫻128; slice thickness, 1 mm; rare factor, 2. DKI was acquired using a spin-echo spin-echo-planar imaging diffusion sequence with 2 repetitions, using 20 different diffusion-encoding directions. Four b-values (b⫽0, 650, 1300, 2000 s/mm2) were acquired for each direction. Other imaging parameters were as follows: TR/TE, 3500/50 ms;
␦/⌬, 5ms/18ms; 19 axial slices; FOV, 30⫻30 mm; matrix, 128⫻ 128; slice thickness, 1 mm.
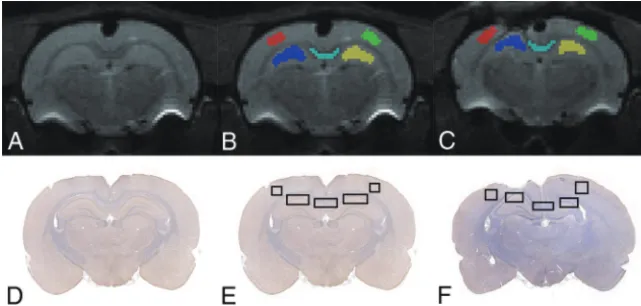
Diffusional Kurtosis Estimator software was used to calculate the DKI parameters (https://www.nitrc.org/projects/dke/).22The calculated DKI parameters included MK, axial kurtosis (Ka), and radial kurtosis (Kr); FA, MD, axial diffusion (Da); and radial dif-fusion (Dr). Using ITK-SNAP software (www.itksnap.org),23we manually drew multiple ROIs, including ipsilateral and contralat-eral to the injury in the cortex, hippocampus, and corpus callo-sum (Fig 1) on theb⫽0 image at around 3– 4 mm posterior to bregma. These ROIs were selected because they were all possibly related to cognitive impairment in the TBI animal model.24,25The individual drawing the ROI was trained before analysis of the study data. The ROIs should be sufficiently large but not defined to the edge of the tissues on the section. A single voxel width was used for the delineation of corpus callosum. Then, the ROIs were transferred to identical sites on the FA, MD, Da, Dr, MK, Ka, and Kr maps in the same rat. The average regional value for each DKI parameter was recorded from the voxels within each ROI.
Immunohistochemistry Staining and Semiquantitative Analysis
Servicebio Technology), microglia (ionized calcium binding adaptor molecule 1 [Iba-1]; 1:1000; Wuhan Servicebio Technol-ogy), and myelin (myelin basic protein [MBP]; 1:100; Wuhan Servicebio Technology).
Brain IHC images were captured using a microscope for cell counting of NeuN⫹, GFAP⫹, and Iba-1⫹cells and the IHC stain-ing area of MBP. Three random FOVs of each section at a magni-fication of⫻20 were obtained to quantify the IHC result to match the MR imaging measured area (Fig 1). The mean values were used to indicate the positive cell numbers or area percentage in each region. Quantification of positive stained cells or area was performed manually using a computer-based image analysis system (Image J 1.51; National Institutes of Health, Bethesda, Maryland).
Cognitive Assessment
Morris water maze tests were performed to assess spatial learning and memory at 28 days after TBI.26The testing paradigm in-cluded 5 daily training trials and a probe trial.
Another two groups of rats (TBI group,n⫽6 and control group,n⫽6) underwent the Morris water maze tests. First, all the rats underwent a block of 4 trials per day on 5 consecutive days to locate the hidden platform. The interval between trials was 15 minutes, and the start position was different for each trial. Each rat was allowed 90 seconds to find the hidden platform and stay on it for 15 seconds. The latency to locate the platform was recorded as the escape latency time. If the rat could not find the platform within 90 seconds, it was guided to the platform and stayed on the platform for 15 seconds, and the latency time was recorded as 90 seconds.
One day after the last training trial, the platform was removed, and the rats were placed in the opposite quadrant and allowed to explore the removed platform in water for 60 seconds. During the probe trial, 3 parameters, including the number of platform-site crossovers, the time spent in the target quadrant, and the swim-ming speed during 60 seconds, were recorded for each rat.
Statistical Analysis
Statistical analysis was performed with the Statistical Package for Social Sciences (IBM, Armonk, New York) software for Windows, Version 20.0, and graphs were plotted using GraphPad Prism 6.0
software (GraphPad Software, San Di-ego, California). The Morris water maze and IHC data were expressed as the mean ⫾ standard error of the mean. DKI parameter data were expressed as mean⫾SD. The DKI parameters and the Morris water maze data were com-pared by repeated-measures ANOVA, followed by pairedttests. Differences in IHC qualitative data were analyzed us-ing 1-way ANOVA, followed by post hoc LSD (least significant difference) tests. Statistical significance was set atP⬍.05.
RESULTS
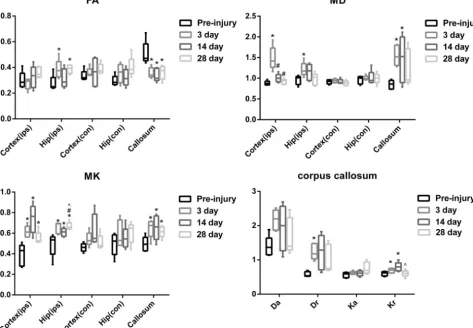
DKI Parameter Changes in TBI Representative DKI parameter maps at all time points from baseline to 28 days after TBI are shown in On-line Fig 1.Figure 2shows the longitudinal DKI parameter changes.
In the ipsilateral perilesional cortex, significant differences were found in MK (F⫽9.703,P⫽.002) and MD (F⫽16.528,P⫽ .014). Compared with baseline, TBI rats had higher MK at 3 days (P⫽.034), 14 days (P⫽.015), and 28 days (P⫽.02), reaching the peak at 14 days and recovering at 28 days after TBI. TBI rats also had higher MD at 3 days (P⫽.013). Compared with 3 days after TBI, higher MD was also found at 14 days (P⫽.005) and 28 days (P⫽.019) after TBI. There was no significant difference in FA values (P⬎.05). Furthermore, no significant changes were found in the contralateral perilesional cortex (P⬎.05).
There were also significant differences in the ipsilateral hip-pocampus in MK (F⫽13.291,P⬍.001), MD (F⫽3.671,P⫽ .044), and FA (F⫽6.358,P⫽.008). Compared with baseline, similar higher MK at 3 days (P⫽.02), 14 days (P⫽.013), and 28 days (P⫽.042) and higher MD at 3 days after TBI (P⫽.023) were found. Compared with 28 days after TBI, lower MK was found at 3 days (P⫽.023) and 14 days (P⫽.003) after TBI. Furthermore, higher FA was also found at 3 days (P⫽.002) and 28 days (P⫽ .008). No significant changes were found in the contralateral hip-pocampus either (P⬎.05).
As for the corpus callosum, significant differences were also found in MK (F⫽6.713,P⫽.007), MD (F⫽4.162,P⫽.031), FA (F⫽9.255,P⫽.002), Dr (F⫽3.478,P⫽.05), and Kr (F⫽ 11.828,P⫽.001). Compared with baseline, TBI rats had higher MK at 3 days (P⫽.008), 14 days (P⫽.009), and 28 days (P⫽ .014); higher MD at 3 days (P⫽.005) and 14 days (P⫽.043); lower FA at 3 days (P⫽.005), 14 days (P⫽.036), and 28 days (P⫽ .013); higher Dr at 3 days (P⫽.005) as well as higher Kr at 3 days (P⬍.001) and 14 days (P⫽.014) after TBI. The Kr at 14 days was also higher (P⫽.008) than that at 28 days after TBI.
IHC Quantitative Changes in TBI
On-line Fig 2 shows the representative IHC staining of NeuN, GFAP, Iba-1, and MBP in the ipsilateral perilesional cortex, hip-pocampus, and corpus callosum at preinjury and 3, 14, and 28 days after TBI.Fig 3shows the IHC staining changes at each time point.
[image:3.594.55.376.48.201.2]In the ipsilateral perilesional cortex, GFAP⫹and Iba-1⫹cells increased significantly at 3 days (P⬍.001;P⬍.001), 14 days (P⬍ .001;P⬍.001), and 28 days (P⬍.001;P⫽.012) compared with preinjury, reaching the peak at 3 days after TBI. On the other hand, NeuN⫹cells and the IHC staining area of MBP decreased significantly at 3 days (P⫽.001;P⬍.001), 14 days (P⫽.045;P⫽ .049), and 28 days (P⫽.003;P⬍.001), reaching the lowest point at 3 days and beginning to recover at 14 days after TBI. There was no significant difference in the contralateral perilesional cortex (P⬎.05).
In the ipsilateral hippocampus, GFAP⫹cells also increased significantly at 3 days (P⫽.012), 14 days (P⫽.014), and 28 days (P⫽.027). Iba-1⫹cells increased significantly at 3 days (P⫽.005) and 14 days (P⬍.001), reaching the peak at 14 days after TBI. NeuN⫹cells and the IHC staining area of MBP decreased signif-icantly at 3 days (P⬍.001;P⬍.001), 14 days (P⫽.001;P⫽.001), and 28 days (P⬍.001;P⫽.001). There was also no significant difference in the contralateral hippocampus (P⬎.05).
Like the ipsilateral perilesional cortex, GFAP⫹and Iba-1⫹ cells increased significantly at 3 days (P⫽.001;P⫽.007), 14 days (P⫽.034;P⫽.018), and 28 days (P⫽.046;P⫽.048) in the corpus callosum, reaching a peak at 3 days after TBI. MBP de-creased significantly at 3 days (P⬍.001), 14 days (P⬍.001), and 28 days (P⬍.001), reaching the lowest point at 3 days and begin-ning to recover at 14 days after TBI.
Cognitive Changes in TBI
Compared with the control group, the TBI group demonstrated no significant difference in escape latency time in training trials (P⬎.05). In the probe test, the TBI group had lower platform crossing times (P⫽.017). Furthermore, there was no statistical significance in the time in the target quadrant and swimming speed between the 2 groups (P⬎.05) (Fig 4).
DISCUSSION
DKI is a useful tool for detecting brain abnormalities. Figuring out the radiologic-pathologic relationship and the evolving laws in the process of TBI is important. Our study revealed that there were longitudinal changes in DKI parameters, which were sugges-tive of multiple pathologic changes at different time points fol-lowing TBI. Moreover, MK is more sensitive for detecting micro-structural changes, especially in gray matter, than MD and FA. Overall, our findings indicate that DKI could be used to detect and reflect brain microstructural changes induced by TBI.
[image:4.594.55.529.52.380.2]FIG 3. Changes in NeuN⫹, GFAP⫹, and Iba-1⫹cells and MBP area for the bilateral cortex (ips, con), bilateral hippocampus (ips, con), and corpus callosum.AsteriskindicatesP⬍.05, compared with preinjury;hash tag,P⬍.05, compared with 3 days after TBI;caret,P⬍.05, compared with 14 days after TBI; ips, ipsilateral; con, contralateral.
[image:5.594.51.536.48.360.2] [image:5.594.52.531.428.705.2]2 time points. Because our study also demonstrated higher MK values in the ipsilateral perilesional cortex at all 3 time points, our results are relatively consistent with those in their study. Further-more, significantly higher MD values were only observed at 3 days after TBI, and no significant difference was found in FA values. Our study indicates that MK is more sensitive for detecting mi-crostructural changes in the cortex.
As for the underlying pathologic changes, our study showed increased GFAP⫹and Iba-1⫹cells in the ipsilateral perilesional cortex, reaching a peak at 3 days after TBI. This finding was con-sistent with those in previous studies.27,28With the proliferation of GFAP⫹and Iba-1⫹cells, the perilesional cortex tissue would become more complex and thus have higher MK values. At pres-ent, reactive astrogliosis has been proved to be associated with higher MK values.17However, the MK values peaked at 14 days after TBI seemed inconsistent with the peak of GFAP⫹and Iba-1⫹ cells. This inconsistency was possible because there would be other pathologic changes after TBI contributing to the MK peak. Our study also revealed decreased NeuN⫹and MBP staining in the ipsilateral perilesional cortex, reaching the lowest point at 3 days and beginning to recover at 14 days after TBI. This was rela-tively consistent with previous studies. Wiley et al29found neuron loss at 1 day and increased NeuN staining at 7 days after TBI. The study of Liu et al30found the lowest MBP expression at 3 days, and it increased in the ipsilateral perilesional cortex at 14 days after TBI. Because neuron loss and myelin disruption will cause loose cellular structure, these pathologic changes might lower the MK values, which have been found in patients with Alzheimer dis-ease31and demyelinating disease.32Thus, the MK value could peak at 14 days, not 3 days, after TBI.
Because the obtained voxel diffusion signal is a summation of all brain microstructural effects, which have different or even sim-ilar effect on the diffusion signal, the relationship between brain microstructural changes and diffusion behavior was rather com-plex.33Thus, the MK value change in the perilesional cortex could result from all or only a subset of the investigated pathologic changes.
In the ipsilateral hippocampus, our study revealed higher MK values at all 3 time points. This was relatively consistent with findings in previous studies. Zhuo et al17found higher MK values in the ipsilateral hippocampus at 7 days after TBI. Another study using a blast TBI model also revealed higher MK values at 7, 14, and 28 days after TBI.34Our study also found higher MD values only at 3 days after TBI, and higher FA values at 3 and 28 days after TBI. Our study indicated that MK is more sensitive to detect mi-crostructural changes in the hippocampus.
Like the perilesional cortex, the perilesional hippocampus had increased GFAP⫹and Iba-1⫹cells and decreased NeuN⫹and MBP staining. These findings were consistent with those in pre-vious studies.27,30At present, the reactive astrogliosis has also been proved to be associated with higher MK values in the hip-pocampus.17The FA value was also increased significantly in the perilesional hippocampus. A previous study indicated that gliosis contributes to the higher FA values in gray matter.9Our study suggests that the DKI parameters in the perilesional hippocampus could also result from all or only a subset of the investigated pathologic changes.
In the corpus callosum, higher MK values were found at all 3 time points. The study of Zhuo et al17also indicated higher MK values in the corpus callosum at 7 days after TBI. Lower FA values and higher MD values were found in the corpus callosum, which was consistent with previous studies.12,35Furthermore, our study found higher Dr at 3 days and higher Kr at 3 and 14 days after TBI. As for the pathologic changes, the corpus callosum showed in-creased GFAP⫹and Iba-1⫹cells and decreased MBP staining, findings consistent with those in previous studies.10,12,35 After TBI, primary axonal damage and further Wallerian degeneration will cause myelin loss. This could cause a decrease in FA and an increase in MD. MK might mainly result from the proliferation of astrocyte and microglia cells, which was further confirmed by higher Kr values. Our study suggests that DKI could provide sup-plementary information.
In our study, rats in the TBI group had lower platform crossing times in the probe test at 1 month after TBI, which was suggestive of cognitive impairment. In fact, previous studies have reported poorer performance on the Morris water maze tests as early as 2 weeks after TBI.36-38We speculated that persistent cortex, hip-pocampus, and corpus callosum abnormalities revealed by the DKI parameter changes would cause disruption of the brain cog-nitive network, thus leading to cogcog-nitive impairment.
Our study has limitations. First, because the MR imaging, his-tologic analysis, and neurocognitive tests were performed on dif-ferent groups of rats, we could not perform a correlational study between DKI parameters and histologic and neurocognitive data directly. Second, although we did multiple pathologic analyses of IHC in our study, other pathologic changes might also exist and contribute to the DKI parameter changes. Furthermore, we only investigated the brain histologic cell number. However, the cell distribution patterns could also influence the DKI parameters. Third, although the controlled cortical impact model has been widely used in TBI animal studies, the animal model still has dif-ferences compared with clinical patients with TBI. Clinical TBI encompasses diverse injury mechanisms, injury locations, and in-jury severity.39One should be careful in the interpretation of DKI parameters in clinical patients with TBI. Fourth, the sample size used in this study was relatively small. A future large-sample study is needed to replicate our results.
CONCLUSIONS
Our study indicated that there were longitudinal changes in DKI parameters, accompanied by multiple pathologic changes at dif-ferent time points following TBI. MK is more sensitive for detecting microstructural changes, especially in gray matter, than MD and FA. Overall, DKI could be a potentially useful tool for detecting and reflecting brain microstructural changes induced by TBI.
REFERENCES
1. Masel BE, DeWitt DS.Traumatic brain injury: a disease process, not an event.J Neurotrauma2010;27:1529 – 40CrossRef Medline
2. Langlois JA, Rutland-Brown W, Wald MM.The epidemiology and impact of traumatic brain injury: a brief overview.J Head Trauma Rehabil2006;21:375–78CrossRef Medline
3. Schretlen DJ, Shapiro AM.A quantitative review of the effects of traumatic brain injury on cognitive functioning.Int Rev Psychiatry
2003;15:341– 49CrossRef Medline
4. Basser PJ, Mattiello J, LeBihan D.MR diffusion tensor spectroscopy and imaging.Biophys J1994;66:259 – 67CrossRef Medline
5. Salmond CH, Menon DK, Chatfield DA, et al.Diffusion tensor im-aging in chronic head injury survivors: correlations with learning and memory indices.Neuroimage2006;29:117–24CrossRef Medline
6. Kraus MF, Susmaras T, Caughlin BP, et al.White matter integrity and cognition in chronic traumatic brain injury: a diffusion tensor imaging study.Brain2007;130:2508 –19CrossRef Medline
7. Kinnunen KM, Greenwood R, Powell JH, et al.White matter damage and cognitive impairment after traumatic brain injury.Brain2011; 134:449 – 63CrossRef Medline
8. Fakhran S, Yaeger K, Alhilali L.Symptomatic white matter changes in mild traumatic brain injury resemble pathologic features of early Alzheimer dementia.Radiology2013;269:249 –57CrossRef Medline
9. Budde MD, Janes L, Gold E, et al.The contribution of gliosis to diffusion tensor anisotropy and tractography following traumatic brain injury: validation in the rat using Fourier analysis of stained tissue sections.Brain2011;134:2248 – 60CrossRef Medline
10. Tu TW, Williams RA, Lescher JD, et al.Radiological-pathological correlation of diffusion tensor and magnetization transfer imaging in a closed head traumatic brain injury model.Ann Neurol2016;79: 907–20CrossRef Medline
11. Singh K, Trivedi R, Devi MM, et al.Longitudinal changes in the DTI measures, anti-GFAP expression and levels of serum inflammatory cytokines following mild traumatic brain injury.Exp Neurol2016; 275(Pt 3):427–35CrossRef Medline
12. Pischiutta F, Micotti E, Hay JR, et al.Single severe traumatic brain injury produces progressive pathology with ongoing contralateral white matter damage one year after injury.Exp Neurol2018;300: 167–178CrossRef Medline
13. Jensen JH, Helpern JA, Ramani A, et al.Diffusional kurtosis imaging: the quantification of non-Gaussian water diffusion by means of magnetic resonance imaging.Magn Reason Med2005; 53:1432– 40CrossRef Medline
14. Jensen JH, Helpern JA.MRI quantification of non-Gaussian wa-ter diffusion by kurtosis analysis.NMR Biomed2010;23:698 –710
CrossRef Medline
15. Grossman EJ, Ge Y, Jensen JH, et al.Thalamus and cognitive impair-ment in mild traumatic brain injury: a diffusional kurtosis imaging study.J Neurotrauma2012;29:2318 –27CrossRef Medline
16. Grossman EJ, Jensen JH, Babb JS, et al.Cognitive impairment in mild traumatic brain injury: a longitudinal diffusional kurtosis and perfusion imaging study.AJNR Am J Neuroradiol2013;34:951–57, s1–3CrossRef Medline
17. Zhuo J, Xu S, Proctor JL, et al.Diffusion kurtosis as an in vivo im-aging marker for reactive astrogliosis in traumatic brain injury.
Neuroimage2012;59:467–77CrossRef Medline
18. Johnson VE, Stewart W, Smith DH.Axonal pathology in traumatic brain injury.Exp Neurol2013;246:35– 43CrossRef Medline
19. Kou Z, VandeVord PJ.Traumatic white matter injury and glial activation: from basic science to clinics.Glia2014;62:1831–55
CrossRef Medline
20. Faden AI, Loane DJ.Chronic neurodegeneration after traumatic brain injury: Alzheimer disease, chronic traumatic encephalopa-thy, or persistent neuroinflammation?Neurotherapeutics2015;12: 143–50CrossRef Medline
21. Wang ML, Li WB.Cognitive impairment after traumatic brain injury: the role of MRI and possible pathological basis.J Neurol Sci
2016;370:244 –50CrossRef Medline
22. Tabesh A, Jensen JH, Ardekani BA, et al.Estimation of tensors and tensor-derived measures in diffusional kurtosis imaging. Magn Reason Med2011;65:823–36CrossRef Medline
23. Yushkevich PA, Piven J, Hazlett HC, et al.User-guided 3D active contour segmentation of anatomical structures: significantly improved efficiency and reliability. Neuroimage 2006;31: 1116 –28CrossRef Medline
24. Vertes RP.Interactions among the medial prefrontal cortex, hip-pocampus and midline thalamus in emotional and cognitive pro-cessing in the rat.Neuroscience2006;142:1–20CrossRef Medline
25. Chida Y, Kokubo Y, Sato S, et al.The alterations of oligodendrocyte, myelin in corpus callosum, and cognitive dysfunction following chronic cerebral ischemia in rats. Brain Res 2011;1414:22–31
CrossRef Medline
26. Vorhees CV, Williams MT.Morris water maze: procedures for as-sessing spatial and related forms of learning and memory.Nat Pro-toc2006;1:848 –58CrossRef Medline
27. Chen S, Pickard JD, Harris NG.Time course of cellular pathology after controlled cortical impact injury.Exp Neurol2003;182:87–102
CrossRef Medline
28. Susarla BT, Villapol S, Yi JH, et al.Temporal patterns of cortical proliferation of glial cell populations after traumatic brain injury in mice.ASN Neuro2014;6:159 –70CrossRef Medline
29. Wiley CA, Bissel SJ, Lesniak A, et al.Ultrastructure of diaschisis lesions after traumatic brain injury.J Neurotrauma2016;33:1866 – 82CrossRef Medline
30. Liu MC, Akle V, Zheng W, et al.Extensive degradation of myelin basic protein isoforms by calpain following traumatic brain injury.
J Neurochem2006;98:700 –12CrossRef Medline
31. Gong NJ, Chan CC, Leung LM, et al.Differential microstructural and morphological abnormalities in mild cognitive impairment and Alzheimer’s disease: evidence from cortical and deep gray mat-ter.Hum Brain Mapp2017;38:2495–508CrossRef Medline
32. Guglielmetti C, Veraart J, Roelant E, et al.Diffusion kurtosis imaging probes cortical alterations and white matter pathology following cuprizone induced demyelination and spontaneous remyelination.
Neuroimage2016;125:363–77CrossRef Medline
33. Umesh Rudrapatna S, Wieloch T, Beirup K, et al.Can diffusion kur-tosis imaging improve the sensitivity and specificity of detecting microstructural alterations in brain tissue chronically after exper-imental stroke? Comparisons with diffusion tensor imaging and histology.Neuroimage2014;97:363–73CrossRef Medline
34. Zhuo J, Keledjian K, Xu S, et al.Changes in diffusion kurtosis imaging and magnetic resonance spectroscopy in a direct cranial blast traumatic brain injury (dc-bTBI) model.PLoS One2015;10: e0136151CrossRef Medline
35. Harris NG, Verley DR, Gutman BA, et al.Bi-directional changes in fractional anisotropy after experiment TBI: disorganization and reorganization?Neuroimage2016;133:129 – 43CrossRef Medline
36. Scheff SW, Baldwin SA, Brown RW, et al.Morris water maze deficits in rats following traumatic brain injury: lateral controlled cortical impact.J Neurotrauma1997;14:615–27CrossRef Medline
37. Radabaugh HL, Carlson LJ, O’Neil DA, et al.Abbreviated environ-mental enrichment confers neurobehavioral, cognitive, and histo-logical benefits in brain-injured female rats.Exp Neurol2016;286: 61– 68CrossRef Medline
38. Brabazon F, Wilson CM, Jaiswal S, et al.Intranasal insulin treatment of an experimental model of moderate traumatic brain injury.
J Cereb Blood Flow Metab2017;37:3203–18CrossRef Medline