ORIGINAL RESEARCH
ADULT BRAIN
Whole-Tumor Histogram and Texture Analyses of DTI for
Evaluation of
IDH1-Mutation and 1p/19q-Codeletion Status in
World Health Organization Grade II Gliomas
XY.W. Park,XK. Han,XS.S. Ahn,XY.S. Choi,X J.H. Chang,X S.H. Kim,X S.-G. Kang,XE.H. Kim, andXS.-K. Lee
ABSTRACT
BACKGROUND AND PURPOSE: Prediction of theisocitrate dehydrogenase 1(IDH1)-mutation and 1p/19q-codeletion status of World Health Organization grade ll gliomas preoperatively may assist in predicting prognosis and planning treatment strategies. Our aim was to characterize the histogram and texture analyses of apparent diffusion coefficient and fractional anisotropy maps to determine IDH1-mutation and 1p/19q-codeletion status in World Health Organization grade II gliomas.
MATERIALS AND METHODS: Ninety-three patients with World Health Organization grade II gliomas with knownIDH1-mutation and 1p/19q-codeletion status (18IDH1wild-type, 45IDH1mutant and no 1p/19q codeletion, 30IDH1-mutant and 1p/19q codeleted tumors) underwent DTI. ROIs were drawn on every section of the T2-weighted images and transferred to the ADC and the fractional anisotropy maps to derive volume-based data of the entire tumor. Histogram and texture analyses were correlated with theIDH1-mutation and 1p/19q-codeletion status. The predictive powers of imaging features forIDH1wild-type tumors and 1p/19q-codeletion status in IDH1-mutant subgroups were evaluated using the least absolute shrinkage and selection operator.
RESULTS:Various histogram and texture parameters differed significantly according toIDH1-mutation and 1p/19q-codeletion status. The skewness and energy of ADC, 10th and 25th percentiles, and correlation of fractional anisotropy were independent predictors of anIDH1 wild-type in the least absolute shrinkage and selection operator. The area under the receiver operating curve for the prediction model was 0.853. The skewness and cluster shade of ADC, energy, and correlation of fractional anisotropy were independent predictors of a 1p/19q codeletion inIDH1-mutant tumors in the least absolute shrinkage and selection operator. The area under the receiver operating curve was 0.807.
CONCLUSIONS: Whole-tumor histogram and texture features of the ADC and fractional anisotropy maps are useful for predicting the IDH1-mutation and 1p/19q-codeletion status in World Health Organization grade II gliomas.
ABBREVIATIONS:FA⫽fractional anisotropy; GLCM⫽gray level co-occurrence matrices;IDH⫽isocitrate dehydrogenase; IDM⫽inverse different moment; LASSO⫽least absolute shrinkage and selection operator; WHO⫽World Health Organization
T
he World Health Organization (WHO) classification of glio-mas was updated in 2016.1For the diagnosis of WHO grade IIgliomas, theisocitrate dehydrogenase (IDH)-mutation and 1p/ 19q-codeletion status are used in combination with the histologic phenotype; the genotype takes precedence over the histologic
phenotype in discordant cases. The molecular subtypes of WHO grade II gliomas are divided into 3 classes:IDHwild-type,IDH
mutant without 1p/19q codeletion, andIDHmutant with 1p/19q-codeletion.1These molecular subtypes reportedly vary in
progno-sis and chemosensitivity.2Patients with grade II astrocytomas and IDHwild-type have significantly poorer prognoses than those withIDH-mutant tumors; the 5-year progression-free survival and overall survival rates are 14% and 51% versus 42% and 93%, respectively.3Moreover, patients with gliomas withIDH
muta-tions were more sensitive to chemoradiation therapy and had lon-ger survival than those with theIDHwild-type.4Additionally, Received October 22, 2017; accepted after revision December 29.
From the Department of Radiology (Y.W.P.), Ewha Womans University College of Medicine, Seoul, Korea; and Departments of Radiology and Research Institute of Radiological Science (Y.W.P., K.H., S.S.A., Y.S.C., S.-K.L.), Neurosurgery (J.H.C., S.-G.K., E.H.K.), and Pathology (S.H.K.), Yonsei University College of Medicine, Seoul, Korea. This work was supported by the Basic Science Research Program through the Na-tional Research Foundation of Korea funded by the Ministry of Science, Informa-tion and CommunicaInforma-tion Technologies, and Future Planning
(2017R1D1A1B03030440).
Please address correspondence to Sung Soo Ahn, MD, PhD, Department of Radiol-ogy and Research Institute of Radiological Science, Yonsei University College of Medicine, 50-one Yonsei-ro, Seodaemun-gu, Seoul 120-752, Korea; e-mail: [email protected].
Indicates open access to non-subscribers at www.ajnr.org.
Indicates article with supplemental on-line tables.
Indicates article with supplemental on-line photos.
1p/19q codeletion predicts therapeutic response and survival.5
Thus, predicting theIDH-mutation and 1p/19q-codeletion status of WHO grade II gliomas preoperatively may aid in predicting prognosis and planning treatment strategies.
IDHmutation and 1p/19 codeletion may reflect alterations in tumor cell proliferation and microvessel density that exhibit char-acteristic features on ADC and fractional anisotropy (FA) param-eters. The ADC is an index of tumor cellularity, reflecting tumor burden and correlating negatively with glioma grade.1,6DTI
pro-vides information about the motion of water protons at the cel-lular level7; the directional restriction of water diffusivity can be
measured as the FA, which correlates with myelinated fiber tract integrity.8,9ADC and FA histograms may predict histologic
sub-types, such as oligodendroglioma, oligoastrocytoma, and astrocy-toma in WHO grade II gliomas.10,11However, these studies did
not obtain molecular markers, and mean or histogram percentile values of ADC and FA have limitations in terms of evaluation of gliomas, due to the heterogeneity.12Histogram-based measures
can reflect the intensity distribution of a volume of interest, but not the spatial distribution of these intensities.13On the other
hand, texture analysis features show the characteristics of the en-tire tumor and allow noninvasive quantification of tumor fea-tures, such as tumor uniformity, heterogeneity, smoothness, ran-domness, and symmetry.14
To the best of our knowledge, there have been no previous reports that have comprehensively examined the whole-tumor histogram and texture features (ie, ADC and FA parameters), ac-cording to theIDH-mutation and 1p/19q-codeletion status of grade II gliomas. This study evaluated the role of histogram and texture analyses of ADC and FA maps based on the entire tumor volume in determining theIDH-mutation and 1p/19q-codeletion status of grade II gliomas, preoperatively.
MATERIALS AND METHODS
Patient PopulationThe institutional review board waived the need for obtaining in-formed patient consent for this retrospective study. Between Jan-uary 2007 and FebrJan-uary 2017, one hundred ninety-six patients
with pathologically diagnosed WHO grade II gliomas were included in this study. Inclusion criteria were as follows: 1) WHO grade II gliomas confirmed by histopathology; and 2) patients who un-derwent preoperative MR imaging, in-cluding DTI, with a b-value of 600 s/mm2. Exclusion criteria were the
fol-lowing: 1) an unknownIDH1-mutation status (n⫽86), 2) patients with a previ-ous history of brain tumor (n⫽6), 3) patients with incomplete MR imaging sequences or suboptimal images (n⫽7), and 4) patients younger than18 years of age (n⫽4). The flow chart of the study population is shown in theFigure. The mean interval between the MR imaging examination and the operation was 10.73⫾12.49 days.
Immunohistochemical analysis and peptide nucleic acid–mediated clamping polymerase chain reac-tion were performed to detect theIDH1R132H mutation.15For
immunohistochemistry, monoclonal antibody H09 was used, and the degree ofIDH1-R132H staining was determined as positive in patients with any stained cells or as negative in those without any stained cells.16If immunohistochemistry results were negative for IDH1-R132H, we confirmed theIDH1status by peptide nucleic acid–mediated clamping polymerase chain reaction. Fluores-cence in situ hybridization analysis was used to investigate 1p/19q codeletion.17
MR Imaging Protocol
Preoperative MR imaging was performed with a 3T MR imaging scanner (Achieva; Philips Healthcare, Best, the Netherlands) with an 8-channel sensitivity encoding head coil. The preoperative MR imaging protocol included T1-weighted (TR/TE, 1800 –2000/ 10 –15 ms; FOV, 240 mm; section thickness, 5 mm; matrix, 256⫻ 256), T2-weighted (TR/TE, 2800 –3000/80 –100 ms; FOV, 240 mm; section thickness, 5 mm; matrix, 256⫻256), and FLAIR (TR/TE, 9000 –10,000/110 –125 ms; FOV, 240 mm; section thick-ness, 5 mm; matrix, 256⫻256) sequences. 3D contrast-enhanced T1-weighted images (TR/TE, 6.3– 8.3/3.1– 4 ms; FOV, 240 mm; section thickness, 1 mm; matrix, 192⫻192) were acquired after administering 0.1 mL/kg of gadolinium-based contrast material (gadobutrol, Gadovist; Bayer Schering Pharma, Berlin, Ger-many). Whole-brain DTI was performed with b-values of 600 and 0 s/mm2, 32 directions, and the following parameters: TR/TE,
8413.4/77 ms; FOV, 220 mm; section thickness, 2 mm; matrix, 112⫻112; acceleration factor, 2.5; and with an acquisition time of 5 minutes 20 seconds.
Image Postprocessing: Volume Acquisition
DTI data were processed off-line with the Medical Image Process-ing, Analysis, and Visualization software package, Version 7.0 (National Institutes of Health; https://mipav.cit.nih.gov/). T2-weighted images were coregistered to ADC and FA maps using affine transformation with normalized mutual information as a cost function,18,19and the ROIs were drawn on every tumor
section on T2-weighted images using a semiautomatic method, with signal intensity thresholds as previously described.20The ROIs, were
drawn by a single neuroradiologist (Y.W.P) and confirmed by an-other neuroradiologist (S.S.A.) and were transferred to ADC and FA maps.
Histogram and Texture Analysis of ADC and FA
First-Order Statistics Including Histogram Parameters. ADC and FA histogram parameters consisting of the mean value and SD were calculated from ROIs overlaid on ADC and FA maps. For cumulative ADC and FA histograms, the 10th, 25th, 50th, 75th, and 90th percentile ADC and FA values in the histogram were generated.10Skewness and kurtosis were also calculated.
Second-Order Statistics via Gray Level Co-Occurrence Mat-rices. Texture analysis via gray level co-occurrence matrices (GLCM) allows extraction of second-order statistical texture fea-tures from images.21Co-occurrence matrix texture considers the
relationship between 2 pixels, the reference and neighboring pixel, reflecting local heterogeneity. We used the following pa-rameters for quantitative analysis of the summation of 2D ROIs: contrast, dissimilarity, inverse different moment 1 (IDM1), ho-mogeneity or IDM2, energy, maximum probability, entropy, mean, variance, SD, correlation, cluster shade, and cluster prom-inence in ADC and FA maps. Altogether, ADC and FA map fea-tures were quantified by various feafea-tures, including their degrees of uniformity (IDM1, homogeneity [IDM2], angular second mo-ment, and energy), heterogeneity (contrast, dissimilarity, vari-ance, and SD), smoothness (correlation), randomness (entropy), and symmetry (cluster shade and prominence). To obtain rota-tional invariant features, we computed the co-occurrence matrix by averaging⬎4 uniformly distributed angular directions (0°, 45°, 90°, and 135°).
Statistical Analysis
The differences between ADC and FA histogram parameters andIDH1-mutation status were assessed using the Studentt
test or the Mann-WhitneyUtest, according to normality test results. Because the number of significant imaging features was relatively large, compared with the number of patients when comparing theIDH1wild-type andIDH1-mutant groups, we used the regularization method to assess the predictive power of the imaging features based on the least absolute shrinkage and selection operator (LASSO), which reduces the potential risk of overfitting or false discovery. LASSO involves
penaliz-ing irrelevant variables to zero and retains only useful features, thereby effectively reducing the number of variables. We used 5-fold cross-validation to find the optimal regularization pa-rameter for LASSO. We estimated the area under the receiver operating curve to assess the predictive ability of variables by selecting significant variables based on LASSO. The 5-fold cross-validated area under the receiver operating curve is the average of the predictive areas under the receiver operating characteristic curve of 5 validation datasets generated by the cross-validation process.
The identical process was performed to evaluate correlations between ADC and FA histograms and 1p/19q-codeletion status in theIDH1-mutant subgroup.
Statistical analysis was performed using R statistical and com-puting software (Version 3.3.1; http://www.r-project.org/). Sta-tistical significance was set atP⬍.05.
RESULTS
The characteristics of the 93 enrolled patients with WHO grade II gliomas are summarized inTable 1. Eighteen patients had
IDH1wild-type tumors, 45 hadIDH1-mutant without 1p/19q-codeletion tumors, and 30 had IDH1-mutant with 1p/19q-codeletion tumors.
Histogram and Texture Analyses of ADC and FA Values for DeterminingIDH1-Mutation Status
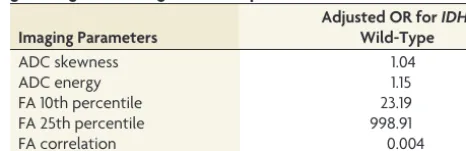
Various histogram and texture analyses features differed signifi-cantly between the IDH1 wild-type and IDH1-mutant groups (On-line Table 1). Among these factors, 5 were independently associated with predicting theIDH1mutation based on the LASSO procedure (Table 2). TheIDH1wild-type group had higher skewness and energy of ADC and FA 10th and 25th percentiles, whereas the
[image:3.594.51.536.55.171.2]IDH1-mutant group had a higher FA correlation. The area under the receiver operating curve for the optimal model was 0.853 (95% con-fidence interval, 0.761– 0.945).
Table 1: Patient characteristics according to theIDH1-mutation status and 1p/19q-codeletion statusa IDH1Wild-Type
(n= 18)
IDH1Mutant without 1p/19q Codeletion (n= 45)
IDH1Mutant with 1p/19q Codeletion (n= 30)
Age (yr) (mean) 49.57⫾3.45 40.80⫾1.25 45.10⫾1.91
Sex
Male 8 (44.4) 27 (60) 13 (43.3)
Female 10 (55.6) 18 (40) 17 (56.7)
Karnofsky performance status (mean) 88.89⫾1.37 90.67⫾1.12 91.00⫾1.39
Extent of resection
Gross total resection 7 (38.9) 29 (64.5) 15 (50)
Subtotal/partial resection 7 (38.9) 14 (31.1) 14 (46.7)
Biopsy 4 (22.2) 2 (4.4) 1 (3.3)
a
Unless otherwise indicated, data are presented as number of patients (%).
Table 2: Prediction model for anIDH1-mutation status in WHO grade II gliomas using the LASSO procedure
Imaging Parameters
Adjusted OR forIDH1 Wild-Type
ADC skewness 1.04
ADC energy 1.15
FA 10th percentile 23.19
FA 25th percentile 998.91
[image:3.594.300.533.210.285.2]Histogram and Texture Analyses of ADC and FA Values for Determining 1p/19q-Codeletion Status in the IDH1-Mutant Group
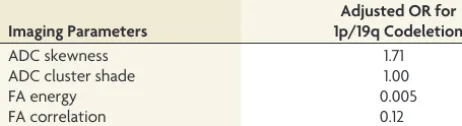
Various histogram and texture analysis features were significantly different according to the 1p/19q-codeletion status in theIDH1 -mutant subgroup (On-line Table 2). Among these factors, 4 were independently associated with predicting the 1p/19q-codeletion status on the basis of the LASSO procedure (Table 3). The 1p/19q-codeletion group had higher ADC skewness and cluster shade, whereas the group without 1p/19q codeletion had higher FA en-ergy and FA correlation. The area under the receiver operating curve for the optimal model was 0.807 (95% confidence interval, 0.649 – 0.965). Representative cases according toIDH1-mutation and 1p/19q-codeletion status are demonstrated in On-line Fig 1. On-line Fig 2 shows the heat map according toIDH1-mutation and 1p/19q-codeletion status, which reveals the strong relation-ship between significant histogram and texture features of ADC and FA maps (P⬍.05) and molecular subtypes.
DISCUSSION
WHO grade II gliomas are heterogeneous at both genetic and histopathologic levels, with intratumoral spatial variation22; we
comprehensively analyzed the histogram and texture features of whole tumors using ADC and FA maps according to the molecu-lar subtypes.
ADC and FA histogram analyses differ significantly according to histopathologic subtypes or molecular markers of WHO grade II/III gliomas.10,23,24However, some study groups followed the
2007 WHO classification, and texture analyses have not been per-formed in all studies. Spatial textures in the ADC and FA signals arise from destruction of normal anatomy by tumors, vasogenic edema, tumor cellularity, degenerative changes, or the compres-sion of normal structures, including some that are imperceptible to human eyes. The notion that texture analysis can reveal visually imperceptible tumor information extends beyond radiology to histopathology; texture analysis (in conjunction with histopa-thology) has been reported to be more accurate than histopathol-ogy alone in predicting prognosis in malignant gliomas.25 In
WHO grade II gliomas, IDH wild-type tumors showed lower ADC and higher FA values thanIDH1-mutant tumors, in agree-ment with our results.11,23,26Generally, increased tumor cell
pro-liferation and angiogenesis increase tumor cellularity,27and the
diffusivity of water molecules is restricted in environments with high cellular density, resulting in lower ADCs.28Therefore, this
finding suggests thatIDHmutation is associated with lower tu-mor cellularity29and explains why the presence of anIDH
muta-tion is a favorable prognostic marker in patients with glioma.2
DTI-based FA values have received attention in the detection of glioma infiltration.30Previous studies have suggested that
tu-mors with higher FA values have higher tumor cell density and a relatively high Ki-67 index in malignant brain tumors, which in-dicate greater malignancy potential.30,31Therefore, the
mecha-nisms underlying lower FAs in WHO grade II gliomas withIDH
mutations may involve a lower rate of proliferation and aggres-siveness and lower tumor cell densities of these tumors. In our study, various ADC and FA histograms and texture features dif-fered statistically significantly according toIDH1-mutation sta-tus; this finding is useful for enhancing the understanding of tu-mor heterogeneity according toIDH1-mutation status. TheIDH1
wild-type group had higher skewness and energy of ADC and 10th and 25th percentiles of FA, whereas the IDH1-mutant group demonstrated higher FA correlation. The energy represents the orderliness of the image; when the image is highly organized, the energy values are high. Correlation is a measure of the linear de-pendence of gray levels on those of neighboring pixels (ie, local gray-level dependence); higher values can be obtained for similar gray-level regions. Thus, theIDH1wild-type group demonstrated higher ADC orderliness, whereas theIDH1-mutant group had a higher frequency of similar FA value regions. Few studies have analyzed the texture features of T1 contrast-enhanced or T2 FLAIR images according to theIDH1-mutation status of WHO grade II gliomas32,33; but none performed DTI analyses, which
provide insight into the spatial distribution of the tumor cellular-ity and myelinated fiber tract integrcellular-ity.
In a recent study, diffusion characteristics from visual assess-ment were significantly different according to the 1p/19q-codele-tion status inIDH1-mutant grade II gliomas.34For further
eval-uation of the roles of diffusion characteristics in determining the 1p/19q-codeletion status of WHO grade II gliomas, we evaluated histogram and texture features measured quantitatively, which can be more objective. Our results demonstrate that histogram and texture features can be effective for predicting 1p/19q-code-letion status. The 1p/19q-code1p/19q-code-letion group demonstrated higher ADC skewness, whereas the 1p/19q-intact group had higher FA energy and FA correlation. Thus, the 1p/19q-codeletion group showed more ADC asymmetry, whereas the 1p/19q-intact group had higher FA organization and more regions with similar FA values. Previous studies showed discrepant results of association between 1p/19q codeletion and ADC and/or FA features in WHO grade II gliomas,24,26,35,36which may be due to different study
groups, smaller sample sizes, and different imaging analyses. Sev-eral studies included oligoastrocytic or oligodendroglial tumors based on histopathology, according to the 2007 WHO classifica-tion, regardless ofIDH-mutation status; then the authors classi-fied them according to 1p/19q codeletion status. Therefore, a small number of patients withIDHwild-type gliomas might have been included. Additionally, previous studies included fewer WHO grade II gliomas with evaluation of focal ROIs of the tumor instead of the entire tumor volume.
Because WHO grade II glioma is a heterogeneous tumor with cystic or calcified areas, ADC or FA values calculated in small ROIs cannot represent the cellular density or arrangement of the whole tumor. However, we analyzed tumors according to 1p/19q-codeletion status in anIDH1-mutant subgroup throughout the whole tumor volume, using comprehensive texture analyses.
[image:4.594.54.285.66.129.2]IDH1-mutant with 1p/19q-codeletion tumors showed lower Table 3: Prediction model for 1p/19q-codeletion status inIDH1
-mutant WHO grade II gliomas using the LASSO procedure
Imaging Parameters
Adjusted OR for 1p/19q Codeletion
ADC skewness 1.71
ADC cluster shade 1.00
FA energy 0.005
ADC and higher FA values thanIDH1-mutant without 1p/19q-codeletion tumors.IDH-mutant with 1p/19q-codeletion tumors are markedly infiltrated by perineuronal satellitosis, with more persistent neurons, as seen on pathology, which may explain their higher FA values.11If the neurons are spared and the volume of
invasion is less, edema should be less, which may explain the lower ADC values in such tumors.11Calcification is another pathologic
finding related to differences in ADC and FA values according to the 1p/19q-codeletion status inIDH1-mutant tumors; microcal-cifications are seen in up to 90% of IDH-mutant with 1p/19q codeletion tumors.11Tumors with calcifications are expected to
have lower ADC values, due to lack of water movement in the calcified region.
Our study had several limitations. First, it was based on a sin-gle-center, retrospectively collected dataset. Second, prognostic markers were not analyzed because patients with WHO II gliomas have a relatively long overall survival. Further studies are needed to correlate prognostic markers, such as overall survival and pro-gression-free survival with genotypic and imaging features. Third,
b⫽600 s/mm2was used instead ofb⫽1000 s/mm2or higher in
DTI. This low b-value may have resulted in overestimation of ADC values due to perfusion effects. However, this would have little effect on analyzing the difference between molecular groups because the pixels as a whole are affected. Fourth, only IDH1
R132H mutation was detected in our hospital, and a small pro-portion of IDH2-mutation or non-IDH1R132H mutation tu-mors was not detected. However, it has been previously reported that the predominant amino acid sequence alteration inIDH1
mutation is R132H, accounting for 92.7% of the detected muta-tions in WHO grade II and III gliomas.37Fifth, this retrospective
study did not investigate the direct relationship between ADC and tumor cellularity from histologic specimens. However, previous studies have proved the negative correlation between ADC and tumor cellularity.38,39
CONCLUSIONS
Histogram and texture features of ADC and FA maps of the entire tumor volume differ according to theIDH1-mutation and 1p/ 19q-codeletion status in WHO grade II gliomas and may be help-ful for predicting molecular status.
Disclosures: Sung Soo Ahn—RELATED:Grant: This research received funding from the Basic Science Research Program through the National Research Foundation of Korea funded by the Ministry of Science, Information and Communication Technol-ogies, and Future Planning (2017R1D1A1B03030440).* *Money paid to the institution.
REFERENCES
1. Louis DN, Perry A, Reifenberger G, et al.The 2016 World Health Organization classification of tumors of the central nervous system: a summary.Acta Neuropathol2016;131:803–20CrossRef Medline
2. Brat DJ, Verhaak RG, Aldape KD, et al; Genome Atlas Research Net-work .Comprehensive, integrative genomic analysis of diffuse low-er-grade gliomas.N Engl J Med2015;372:2481–98CrossRef Medline
3. Metellus P, Coulibaly B, Colin C, et al.Absence of IDH mutation identifies a novel radiologic and molecular subtype of WHO grade II gliomas with dismal prognosis. Acta Neuropathol 2010;120: 719 –29CrossRef Medline
4. Olar A, Wani KM, Alfaro-Munoz KD, et al.IDH mutation status and role of WHO grade and mitotic index in overall survival in grade
II-III diffuse gliomas.Acta Neuropathol2015;129:585–96CrossRef Medline
5. Jenkins RB, Blair H, Ballman KV, et al.A t (1; 19)(q10; p10) mediates the combined deletions of 1p and 19q and predicts a better progno-sis of patients with oligodendroglioma.Cancer Res2006;66:9852– 61
CrossRef Medline
6. Omuro A, DeAngelis LM. Glioblastoma and other malignant gliomas: a clinical review.JAMA2013;310:1842–50CrossRef Medline
7. Balss J, Meyer J, Mueller W, et al.Analysis of the IDH1 codon 132 mutation in brain tumors. Acta Neuropathol 2008;116:597– 602
CrossRef Medline
8. Chenevert TL, Brunberg JA, Pipe JG.Anisotropic diffusion in hu-man white matter: demonstration with MR techniques in vivo. Ra-diology1990;177:401– 05CrossRef Medline
9. Hansen JR.Pulsed NMR study of water mobility in muscle and brain tissue.Biochim Biophys Acta1971;230:482– 86CrossRef Medline
10. Tozer DJ, Ja¨ger HR, Danchaivijitr N, et al.Apparent diffusion coef-ficient histograms may predict low-grade glioma subtype.NMR Biomed2007;20:49 –57CrossRef Medline
11. Khayal IS, McKnight TR, McGue C, et al.Apparent diffusion coeffi-cient and fractional anisotropy of newly diagnosed grade II glio-mas.NMR Biomed2009;22:449 –55CrossRef Medline
12. Ryu YJ, Choi SH, Park SJ, et al.Glioma: application of whole-tumor texture analysis of diffusion-weighted imaging for the evaluation of tumor heterogeneity.PLoS One2014;9:e108335CrossRef Medline
13. Brynolfsson P, Nilsson D, Henriksson R, et al.ADC texture: an im-aging biomarker for high-grade glioma? Medical Phys 2014;41: 101903CrossRef Medline
14. Davnall F, Yip CS, Ljungqvist G, et al. Assessment of tumor heterogeneity: an emerging imaging tool for clinical practice? In-sights Imaging2012;3:573– 89CrossRef Medline
15. Yan H, Parsons DW, Jin G, et al.IDH1 and IDH2 mutations in glio-mas.N Engl J Med2009;360:765–73CrossRef Medline
16. Takano S, Tian W, Matsuda M, et al.Detection of IDH1 mutation in human gliomas: comparison of immunohistochemistry and se-quencing.Brain Tumor Pathol2011;28:115–23CrossRef Medline
17. Riemenschneider MJ, Jeuken JW, Wesseling P, et al.Molecular diag-nostics of gliomas: state of the art.Acta Neuropathol 2010;120: 567– 84CrossRef Medline
18. Cha J, Kim S, Kim HJ, et al.Differentiation of tumor progression from pseudoprogression in patients with posttreatment glioblas-toma using multiparametric histogram analysis.AJNR Am J Neuro-radiol2014;35:1309 –17CrossRef Medline
19. Maes F, Collignon A, Vandermeulen D, et al.Multimodality image registration by maximization of mutual information.IEEE Trans Med Imaging1997;16:187–98CrossRef Medline
20. Ko SB, Choi HA, Carpenter AM, et al.Quantitative analysis of hem-orrhage volume for predicting delayed cerebral ischemia after sub-arachnoid hemorrhage.Stroke2011;4:669 –74CrossRef Medline
21. Haralick RM, Shanmugam K.Textural features for image classifica-tion.IEEE Trans Syst Man Cybern1973;610 –21CrossRef
22. Paulus W, Peiffer J Intratumoral histologic heterogeneity of gliomas: a quantitative study.Cancer1989;64:442– 47Medline
23. Xiong J, Tan WL, Pan JW, et al.Detecting isocitrate dehydrogenase gene mutations in oligodendroglial tumors using diffusion tensor imaging metrics and their correlations with proliferation and mi-crovascular density.J Magn Reson Imaging2016;43:45–54CrossRef Medline
24. Jenkinson MD, Smith TS, Brodbelt AR, et al.Apparent diffusion coefficients in oligodendroglial tumors characterized by genotype.
J Magn Reson Imaging2007;26:1405–12CrossRef Medline
25. Zacharaki EI, Morita N, Bhatt P, et al.Survival analysis of patients with high-grade gliomas based on data mining of imaging vari-ables.AJNR Am J Neuroradiol2012;33:1065–71CrossRef Medline
27. Fischer I, Gagner JP, Law M, et al.Angiogenesis in gliomas: biol-ogy and molecular pathophysiolbiol-ogy.Brain Pathol2005;15:297– 310Medline
28. Yamasaki F, Kurisu K, Satoh K, et al.Apparent diffusion coefficient of human brain tumors at MR imaging.Radiology2005;235:985–91
CrossRef Medline
29. Bralten LB, Kloosterhof NK, Balvers R, et al.IDH1 R132H decreases proliferation of glioma cell lines in vitro and in vivo.Ann Neurol
2011;69:455– 63CrossRef Medline
30. Beppu T, Inoue T, Shibata Y, et al.Fractional anisotropy value by diffusion tensor magnetic resonance imaging as a predictor of cell density and proliferation activity of glioblastomas.Surg Neurol
2005;63:56 – 61; discussion 61CrossRef Medline
31. Kinoshita M, Hashimoto N, Goto T, et al.Fractional anisotropy and tumor cell density of the tumor core show positive correlation in diffusion tensor magnetic resonance imaging of malignant brain tumors.Neuroimage2008;43:29 –35CrossRef Medline
32. Yu J, Shi Z, Lian Y, et al.Noninvasive IDH1 mutation estimation based on a quantitative radiomics approach for grade II glioma.Eur Radiol2017;27:3509 –22CrossRef Medline
33. Li Z, Wang Y, Yu J, et al.Deep learning based radiomics (DLR) and its usage in noninvasive IDH1 prediction for low grade glioma.Sci Rep2017;7:5467CrossRef Medline
34. Leu K, Ott GA, Lai A, et al.Perfusion and diffusion MRI signatures in histologic and genetic subtypes of WHO grade II-III diffuse glio-mas.J Neurooncol2017;134:177– 88CrossRef Medline
35. Khayal IS, Vandenberg SR, Smith KJ, et al.MRI apparent diffusion coefficient reflects histopathologic subtype, axonal disruption, and tumor fraction in diffuse-type grade II gliomas.Neuro Oncol2011; 13:1192–201CrossRef Medline
36. Park Y, Han K, Ahn S, et al.Prediction of IDH1-mutation and 1p/ 19q-codeletion status using preoperative MR imaging phenotypes in lower grade gliomas. AJNR Am J Neuroradiol2018;39:37– 42
CrossRef Medline
37. Hartmann C, Meyer J, Balss J, et al.Type and frequency of IDH1 and IDH2 mutations are related to astrocytic and oligodendroglial dif-ferentiation and age: a study of 1,010 diffuse gliomas.Acta Neuro-pathol2009;118:469 –74CrossRef Medline
38. Kono K, Inoue Y, Nakayama K, et al.The role of diffusion-weighted imaging in patients with brain tumors.AJNR Am J Neuroradiol
2001;22:1081– 88Medline
39. Sugahara T, Korogi Y, Kochi M, et al.Usefulness of diffusion-weighted MRI with echo-planar technique in the evaluation of cellularity in gliomas. J Magn Reson Imaging1999;9:53– 60