CHEMICAL STABILISATION OF WHAKA TERRACE LOESS
CHRISTCHURCH
A thesis
submitted in partial fulfillment of the requirements for the Degree
of
Master of Science in Engineering Geology in the
University of Canterbury by
B.H.Tehrani
University of Canterbury
The dispersive and erodible nature of some loess soils on the Port
Hills results in a variety of mass movement, surface and sub-surface
erosion features. These features produce engineering problems for
residential development, and chemical stabilisation techniques have been used to reduce and/or prevent further erosion by rendering the soils non-dispersive and non erodible.
Field and laboratory investigations were undertaken to characterise the dispersive and erodible nature of Whaka Terrace subdivision loess, as well as to assess changes in chemistry and mineralogy of the chemically stabilised soils. Field investigation included engineering geological mapping, geophysical surveying, hand auger hole drilling and logging, and sampling.
The application of 1%, 2%, and 4% hydrated lime, quicklime,
Portland cement, gypsum, and a mixture of hydrated lime and gypsum (on a 1:1 basis) was used to stabilise erodible loess-colluvium in the laboratory. Evaluation tests included permeability, pinhole erodibility, jar slaking, uniaxial swelling, crumb dispersion, unconfined compressive strength, undrained shear strength, and the determination of optimum moisture content, Atterberg limits and grainsize distribution. Soil chemistry was analysed using pH, soluble salts, organic content, cation
exchange capacity and XRF, while XRD, SEM and EDAX were used to study
soil mineralogy and fabric.
Application of 1 and 2% quicklime and hydrated lime produces a non-erodible, non-dispersive and durable material which resists slaking
and swelling during saturation, and wetting and drying cycles.
Application of Portland cement at higher concentration (2 'and 4%) produces similar results to that of hydrated lime and quicklime, while gypsum fails to produce a non-erodible and durable material. Furthermore, although the application of a mixed hydrated lime and gypsum stabiliser produces a non-dispersive and non-erodible material, it fails to produce a durable material and mixed stabiliser soils possess a high potential for swelling and slaking.
TABLE OF CONTENT
Page CHAPTER ONE : INTRODUCTION
1.1. Project Background 1
1.2. Principles Of Chemical Stabilisation 1
1.2.1. Durability 4
1.2.2. Volume Stability 4
1.2.3. Strength 4
1.3. Study Objectives 7
1.4. Previous Work 7
1.4.1. Geology 7
1.4.2. Chemical Stabilisation 9
1.5. Site Description 11
1.5.1. Location 11
1.5.2. Bedrock Geology 11
1.5.3. Loess Deposits and Loess-colluvium deposits 13
1.5.4. Tunnel Gullies 13
1.5.5. Seepage Zones 15
1.6. Investigation Methodology 15
1.6.1. Field Methods 15
1.6.2. Laboratory Methods 15
1.7. Thesis Format 18
CHAPTER TWO : PHYSICAL AND INDEX PROPERTIES 2.1. Introduction
2.1.1. Sampling Methods 2.1.2. Laboratory Programme
20
20
20
2.2. Density/Moisture Content Relationships 2.2.1. In-Situ Samples
2.2.2. Recompacted Samples 2.2.3. Treated Samples 2.3. Grainsize
2.3.1. Field Sample
2.3.2. Stabilised Samples 2.4. Plasticity
2.4.1. Test Methods
2.4.2. Treated and Untreated Samples 2.5. Permeability
2.5.1. Test Methods
2.5.2. Treated and Untreated Samples 2.6. Dispersion/Erosion
2.6.1. Background
2.6.2. Test Methods and Results 2.6.3. Emerson Crumb Test
2.6.4. Pinhole Test 2.7.S1aking
2.7.1. Terminology and Test Methods 2.7.2. Untreated Samples
2.7.3. Treated Samples 2 . 8 . Swe 11 i ng
2.8.1. Test Methods and Results 2.8.2. Field Samples
2.8.3. Stabilised Samples 2.9. Synthesis
Page 23 23 23 24 28 28 28 34 34 34 39 39 39 43 43 43 46 46
50
50
51
51
55
55
55
56
CHAPTER THREE: STRENGTH CHARACTERISTICS 3.1. Introduction
3.2. Unconfined Compressive Strength 3.2.1. Test Methods and Results 3.2.2. Untreated Samples
3.2.3. Strength Gain
3.2.3.1. Hydrated Lime-treated Samples 3.2.3.2. Quicklime-treated Samples 3.2.3.3. Cement-treated Samples 3.2.3.4. Gypsum-treated Samples 3.2.3.5. Principal Conclusions 3.2.4. Strength/Density Relationship 3.2.5. Strain At Peak Strength
3.2.6. Stress/Strain Relationship 3.3. Shear Strength
3.3.1. Test Methods and Results 3.3.2. Untreated Samples
3.3.3. Hydrated Lime treated Samples 3.3.4. QUicklime-treated Samples 3.3.5. Cement-treated Samples 3.3.6. Gypsum-treated Samples 3.4. Synthesis
CHAPTER FOUR: SOIL CHEMISTRY AND MINERALOGY 4.1. Introduction
4.2. Soil Chemistry
4.2.1. Test Methods And Results
Page
62 63 63 63
64
64
64
68
68
69
69
71 74 77 77 77
79
82 82 82 84
86
86
86
Page
4.2.2. Organic Carbon Content 87
4.2.3. Soluble Salt Concentration 87
4.2.4. Cation Exchange Capacity 91
4.2.5. X-Ray Fluorescence Analysis 94
4.2.6. pH 94
4.3. Soil Mineralogy 98
4.3.1. Tests Methods And Results 98
4.3.2. Untreated Samples 102
4.3.2.1. XRD and SEM Analyses of Clay Fraction 102 4.3.2.2. XRD and SEM Analyses of Bulk Fraction 102
4.3.3. Treated Samples 106
4.3.3.1. XRD Analyses 109
i) Clay Fraction 109
ii) Bulk Fraction III
4.3.3.2. SEM and EDAX Analyses III
i) Cement-treated samples 112
ii) Quickllime-treated Samples 115
iii) Gypsum-treated Samples 118
4.4. Synthesis 123
CHAPTER FIVE: Summary and Conclusions 5.1 Loess Erodibility
5.2 Laboratory Stabilisation Trials 5.2.1 Test Methods
5.2.2. Physical and Index Properties Changes 5.2.3. Strength Characteristics
5.2.4. Chemical and Mineralogical Changes
5.3. Conclusions and Recommendations 5.3.1. Principal Conclusions 5.3.2. Further Investigations
REFERENCES APPENDICES
1 : Terminology
2: Miscellaneous Soil Tests 3: Grainsize Analyses
4: Permeability Test
5: Emerson Dispersion Test 6: Pinhole Erodi bil ity Test 7: Slaking
8: Uniaxial Swell ing 9: Strength Tests 10: Soil Chemical Tests
11: XRD Analyses 12: SEM Analyses
Page 129 129 129
LIST OF FIGURES
FIGURE Page
1.1 Banks Peninsula location map. 2
1.2 Location diagram for Whaka Terrace. 3
1.3 Crack in concrete kerb. S
1.4 Service trench failure. S
I.S General slope failure model. 6
1.6 Slope movement at Whaka Terrace. 6 1.7 Simplified geological map of Banks Peninsula. 8 1.8 Origin of Banks Peninsula loess deposits. 8 1.9 Relationship between slope/regolith type. 10 1.10 Distribution of loess deposits on 10
Banks Peninsula.
1.11 Panoramic view of Whaka Terrace. 1.12 Engineering geological plan, Whaka
Terrace Subdivision, Whaka Terrace Subdivision (in map pocket).
1.13 Auger logs and sections, Whaka Terrace Subdivision (in pocket at rear).
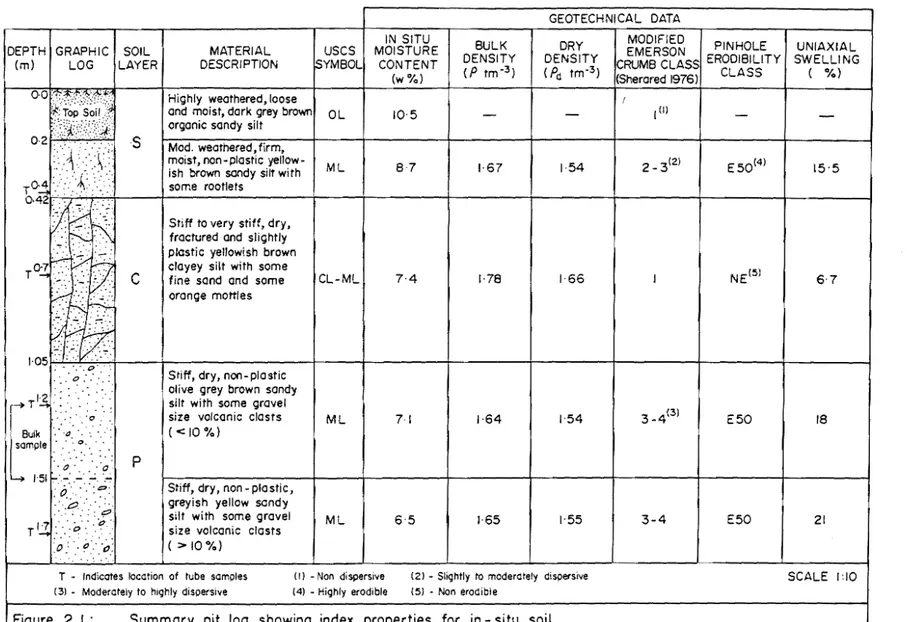
1.14 Summary pit log.
I.ISa A typical shallow tunnel gullies. 1.ISb Various shallow tunnel gullies. 1.16 Seepage from exit of tunnel gullies. 1.17 Collection of bulk sample using backhoe. 2.1 Summary pit log showing index properties
for in-situ soil.
12 map pocket
map pocket
2.2 Test programme summary.
2.3 Effect of chemical stabiliser on optimum moisture content and dry density.
Page 22 25
2.4 Optimum moisture content / density relationship. 26 2.5 Effect of chemical stabiliser on grainsize 29
distribution.
2.6 The effect of the application of hydrated lime 32 on the sand size fraction of different soils.
2.7 Effect of chemical stabilisers on plasticity. 35 2.8 Activity of treated and untreated loess-colluvium 37
samples.
2.9 Sectional view of falling head permeability 40 apparatus.
2.10 Permeability and compacted density. 41 2.11 Emerson Crumb Test for untreated and 47
stabilised samples.
2.12 Erodibility of treated and untreated samples. 48 2.13 Jar Slake Test for untreated and 1% stabilised 52
samples.
2.14 Jar Slake Test for 2% and 4% cement and 54 gypsum-treated samples.
2.15 Swellability of natural and stabilised loess. 57
3.1 Unconfined compressive strength for treated and untreated samples.
66
Page 3.2 Unconfined compressive strength and compacted 67
dry density for lime additions to parent loess, Port Hills (Evans & Bell, 1981).
3.3 Averaged maximum compressive strength for the 67 control and lime-treated soils, (Glassey, 1986).
3.4 relationship between percentage of stabiliser 70 used, dry density, and unconfined compressive
strength.
3.5 Strain values at peak strength for untreated and treated soils.
3.6 Stress/Strain curves for natural soil and chemically stabilised soils.
3.7 Modulus of elasticity for untreated and chemically stabilised samples.
3.8 Cohesion values for control soil and stabilised soils.
3.9 Angle of internal friction for the control soil and stabilised soils.
3.10 Shear strength for the control and chemically stabilised soils.
4.1 Relationship between S.A.R. and soluble salt concentration in pore water for whaka Terrace loess-colluvium.
4.2 Relationship between soil pH and solubility of silica.
73
75
76
78
81
83
89
4.3 Relationship between solubility of hydroxides, quartz and soil pH.
4.4 Diffractogram pattern of an oriented mount of clay fraction.
4.5 SEM Micrograph of clay minerals in untreated sample.
4.6 Powder sample diffraction pattern of untreated Whaka Terrace loess-colluvium and quicklime stabilised soil.
Page 95
101
104
103
4.7 Distribution of silt size quartz and feldspar 104 grains in Whaka Terrace loess-colluvium.
4.8 Size and morphology of quartz and plagioclase 107 grains.
4.9 High (x 3, 500) magnification of a plagioclase 107 crystal.
4.10 X-Ray diffraction pattern of clay fraction of 110 untreated and stabilised soil.
4.11 SEM micrograph of clay fraction of cement treated samples after 14 days moist curing. 4.12 SEM micrograph of a crumb of cement-treated
samples after 90 days moist curing.
113
113
4.13 Pozzolanic products at (x 6,000) magnification. 114 4.14 Pozzolanic product in a cement-treated 114
samples (x 7000).
4.15 Clay fraction of quicklime-treated samples after 14 days moist curing.
116
4.16 The crystallisation of "foil like" calcium hydrated silica and tobermorite gel.
4.17 High magnification (x 4000) of calcium hydrated silica.
4.18 Elemental distribution of silicate for quicklime-treated sample.
4.19 Elemental distribution of calcium for quicklime-treated sample.
4.20 Elemental distribution of aluminate for quicklime-treated sample.
Page
116
119
119
120
120
4.21 Soil fabric of quicklime-treated samples. 121 4.22 Clay fraction of a gypsum-treated sample after 121
14 days moist curing.
4.23 SEM micrograph of soil fabric of the 122 gypsum-treated sample.
4.24 Gypsum-treated sample show lack of evidence of pOllolanic products after 90 days moist curing.
LIST OF TABLES Table
2.1 Effect of chemical stabilisers on dry density and optimum moisture content. 2.2 Effect of chemical stabilisers on
grainsize distribution.
2.3 Effect of chemical stabilisers on plasticity and activity.
2.4 Permeability of treated and untreated samples.
Page
27
30
38
2.5 dispersivity of field and stabilised samples. 46 2.6 Pinhole tests data for treated and untreated 49
samples.
2.7 Slaking indices for recompacted field and stabilised samples.
53
2.8 Uniaxial swelling strain data for field and 58 stabilised samples.
3.1 Unconfined Compressive strength Test results for untreated and treated samples.
3.2 Dry density and compressive strength values for treated and untreated samples.
3.3 Undrained shear strength parameters.
4.1 Chemical and mineralogical properties of
loess-colluvium from Whaka terrace (Port Hills).
65
72
80
88
Page 4.2 Effect of chemical stabilisers on the cation 92
exchange capacity and pH of Whaka Terrace loess-colluvium.
4.3 Chemical composition of stabiliser agents. 93 4.4 Major element analysis in Whaka Terrace 96
loess-colluvium.
4.5 Grainsize analysis of chemical stabiliser agents. 97 4.6 Relative abundances of clay minerals in the clay 100
fraction of Whaka Terrace loess-colluvium.
4.7 Relative abundances of quartz and feldspar 105 minerals in Whaka Terrace loess-colluvium.
4.S Elemental distribution in a plagioclase from lOS SEM micrograph in Fig 4.9.
4.9 Elemental distribution of pozzolanic products lOS from SEM micrograph of cement-treated sample
in Fig 4.14.
4.10 Elemental distribution of pozzolanic products 117 from SEM micrograph of quicklime-treated sample
in Fig 4.17.
CONTENT OF MAP POCKET
Figure 1.12 Engineering geological plan, Whaka Terrace Subdivision.
ACKNOWLEDGEMENTS
My sincere thanks to the following organisations and individuals for their assistance:
My supervisors, Dave Bell and Dr Jarg Pettinga for their guidance and help during the project and editing of thesis drafts.
The academic and technical staff of the Geology Department, University of Canterbury.
Dr Campbell, Mr Huntly, and Susi from the Soil Science Department of Lincoln College for their assistance during laboratory investigations.
Lee Leonard for drafting, Kerry Swanson, M. Ingerfe1d for operating the S.E.M. and Edax, and Tracey for printing.
John van dyke, Civil Engineering (University of Canterbury) for allowing me to use his Lab.
Philip Glassey for his Kiwi sense of humour and field assistance.
My classmates Ron, Mike, Dale, John, Grant, Parviz, Charlie and Dave.
Many thanks to my dear friend Udo Wezenberg for his kindness and honour. I wish the best for him.
My brothers and sisters and my wife's family for their encouragement and their financial assistance.
Special thanks to my dear mother for her support and financial assistance.
I would especially like to thank my wife Simin, for her typing, assistance and encouragement during the course of this study and many thanks to my son Hiva.
CHAPTER ONE INTRODUCTION 1.1 Project Background
Banks Peninsula consists of the eroded calderas of the Lyttelton and Akaroa volcanoes, which were active in Miocene times and which are now mantled by aeolian quartzofe1dspathic loess deposits of Quarternary age. The dispersive and erosive nature of some loess soils produces a variety of engineering problems for residential development on the lower slopes of the Port Hills (Fig 1.1). Whaka Terrace (Fig 1.2) is a subdivision which displays a variety of mass movement and erosion features, particularly tunnel gully development as well as rill and sheet erosion on unvegetated and disturbed ground. The testing programme described in this thesis has been confined to soils from Whaka Terrace.
Chemical stabilisation techniques, especially the use of hydrated lime, have been used successfully to overcome erosion problems by rendering loess soils non-dispersive and non-erodible. However, the extent of previous research in some areas is limited, and this project has involved further investigation of properties of stabilised soils with respect to shear strength, chemistry and mineralogy. In addition, until now chemical stabilisation of the Port Hills loess has been dominated by the use of hydrated lime, and there is a need to assess the usefulness of alternative stabilising agents, such as Portland cement, quicklime, gypsum, and a mixture of hydrated lime and gypsum. 1.2. Principles of Chemical Stabilisation
Chemical stabilisation techniques have been widely used to alter or enhance specific engineering properties of natural soils. Ingles and Metcalf (1972) have suggested that the main properties of a soil which should be considered in an engineering construction project are:
a) durability
b) volume stability c) strength
d) permeability
o
.~;~~
.,
' ..
t, " ' f .-~----. '
-2
Figure
~oO..O/)'~~
"> ",'"
,",orf;"" T9
:;.-,,<'
... / q ....
:!~lquore _ = ~!r;,~! ~ ~ '" '" #
Vii' If';
=-11 ~
.8" (;]1 ~""'~
0.;;: ':::: ~"
.£11 ... ~ 8"
II
Q '"
/I
",'''' t?-;~
~
~~;;::. ~erry
"' .. '" ""'~"i>a
""" ~ ::::;()(,f
. -:-::
",-" '
// ,,'-'
",>'
1.2 Location diagram for Whaka Terrace
Rivers
Mo'
~~
-
--,:::~
' ....
, ,
: ',:: :
o
-':'.: ..
SCALE
... '
N
i
Ikm
, ,
4
1.2.1. Durability
Generally durability refers to the resistance of soil or rock material to short-term weathering, although in this study durability is considered mainly ~s the resistance of soil material to erosion and dispersion processes as related to the action of running or infiltrating water. Research by Evans (1977) has indicated that some loess soils on the Port Hills have a high potential for dispersion and erosion. These properties of some loess soil provides a number of difficulties for engineering works and urban development on the Port Hills (Fig 1.3 and 1.4).
1.2.2. Volume Instability
Due to seasonal fluctuation of moisture content and temperature, shrinkage and swelling are seen in many soils. This process is commonly referred to as volume instability, and is widely regarded as being responsible for damage to house foundation and road structures on the Port Hills. Miller (1971) illustrated that shrinkage is the primary factor in allowing access of water to potentially dispersive and erosive subsoils, leading to tunnel gully formation. Fig 1.5 illustrates the relationship between shrinkage and tunnel gully formation.
1.2.3. Strength
Soil strength is a measure of the ability of the soil skeleton to resist deformation resulting from normal or shear forces. Inadequate strength or deformation resistance leads to problems such as bearing capacity failure in roads and foundations of structures, as well as slope instability on hill sides. On the Port Hills, areas of lower shear strength are commonly associated with seepage zones where loess soils are saturated and lor softened. Such areas can commonly be identified by the presence of hummocky ground on the slopes (Fig 1.6).
Fi~. 1.~ Crack in concrete kerb duo to luck of support ullderncaLb. Note locuLion of Lunnel gully (,rG).
Fir;. '1.'1 i";ervicc trench L:l.ilure afLer backfilling wil;h
erodible loess (trench ucLs a~; channel-way for
;i\ IOf • 'In ......
""'\I \Jnf.~
6
Fi~- 1.5 General slope failure model. Note shrinkage cracks and tunnellinG
-(after Evans
&
Bell, 1981) .Glope movement at Whaka Terrace. Note the
1.3. StudvObjectives
This project has been undertaken with the following aims: 1) To review the effect of hydrated lime on Port Hills loess in order to verify the results of earlier studies, as well as to broaden the knowledge in areas about which information is incomplete.
2) To assess the potential of those stabiliser agents which have similar Ca+2 cation availability to hydrated lime, such as Portland cement, quicklime, gypsum and a mixture of gypsum and hydrated lime (I:I ratio).
1.4. Previous Work 1.4.1. Geology 1) Bedrock Geology
Banks Peninsula consists of the eroded calderas of the Lyttelton and Akaroa Volcanoes, which are composed of rubbly and massive aa - type basaltic and andesitic lavas, pyroclastics deposits, lahars and dykes (Weaver et al 1985). The Lyttelton Volcano was erupted on the older basement rocks, which consist of Triassic age greywacke and argillite strata of the Torlesse Group which are exposed in the Gebbies Pass area, and younger Miocene age basement rocks consisting of Gebbies Rhyolite belonging to the Governors Bay Volcanics. The simplified geology of Banks Peninsula is shown in Fig 1.7.
The Lyttelton and Akaroa volcanic activity ceased during the Pliocene and was followed by the establishment of a typical radial drainage pattern on the flanks of the volcanoes. The Lyttelton and Akaroa volcanoes were developed initially as an island on the western end of the Chatham Rise. However, the deposition of gravel outwash fans from the southern Alps during the Pleistocene connected the north-western part of the island to the mainland, forming the Canterbury Plains and Banks Peninsula (Liggett and Gregg, 1965).
2) Loess Deposits
D
Gr~I&.lOnd,Cl
Dould.r bonk < t• SlOddOl"I 6 VOleonle& Chnh :10-0-1
Q Ako'oo ",Icona I'i'I MI Horbert
L!J Volc:onlcs
~ I.,yll.llon \AJlcono
o 4
1-...,-1 o om '==j
N
r
Fig. 1.7 Simplified geological map of Banks Peninsula. (from Weaver et al, 1985).
jPfRIG .. LIICIIIL 1~f!C(S
1.;,.:-:/:) morin. ,c(1iment,
'. -,
I
o
~m lowod
I 10
,
20
. .
PlciSloccnll outwash Ions
Isome till hom corlior advances)
Fig. 1.8 Origin of Banks Peninsula loess deposits.
(from Bell
&
Trangmar, 1987).redeposited down the volcanic slopes by freeze - thaw, and rainstorm induced mass movements during the Pleistocene (Griffiths 1974). Natural erosion processes have been further accelerated by human activity and residential develop:ment on the Port Hills.
Bell and Trangmar (19B7) have suggested that five types of regolith can be recognized on the slopes of Banks Peninsula. These are;
I} In-situ loess 2) Loess-colluvium
3) Mixed deposits of loess and volcanic - derived colluvium 4} Volcanic-colluvium
5) Residual regolith.
The relationship between these regolith/ slope / erosion features' is illustrated in Fig 1.9, while problems related to soil erosion and dispersion, as well as the mechanism of tunnel gully development, have been discussed in detail by Trangmar {1976} and Evans (1977).
Research by Griffiths {1973} has indicated the presence of two types of in-situ loess on Banks Peninsula, which he referred to as:
a) Birdlings Flats Loess, which is Coarse calcareous with textures of loamy fine sand and fine sandy loam and which is generally highly dispersive and slakes during saturation, and
b) Barry Bay Loess, which is Fine, non calcareous and with a silt loam texture, and which possesses greater inter granular cohesion and lower dispersiveness relative to the Birdlings Flats Loess.
3} Loess-Colluvium Deposit
Loess-colluvium occurs mainly on the lower slopes of Banks Peninsula and includes all loessial material which has been transported down slope since initial deposition (Griffiths, 1973). It is principally composed of quartzofeldspathic silts and fine sands, but contains up to 10% volcanic clasts {Bell and Trangmar 19B7}. The distribution of loess deposits is illustrated in Fig 1.10.
1.4.2. Chemical stabilisation
,,..
IWttnf.':
QQMIf!~f EROSIO'I . rno<;~SV/l !!~1l!"~~_G!'W1'9
c • 5~1 C, . . p
lIrA '1/ fAO"~Mt • fttIoc"fnn
• tunf'MIl4 Gully VI '1/ Sh •• 1 [rn,lon N ' PUI
( I ht<tr;".~ !"I4;r,nht "tbdorft..,Ofd
'M'~ ~ •••
"':·TIA--
--I--~,,--I-~_I~W_\ ___ L_~-J _____ ~~ ___ I I - - - . H .. , - - - j
!
~l....
loe .. c:ol1u.,lv,".
i~}i.£i.~ MI.,1t ao ... /'W'OIeGftic: ~lIv'llh .. '"
~
~ Y(IIc ... IC ~"'Iiv'"
(n,.ioft .",foe"
" A!iv'fl"",
10
( ....
....
-..., "'
....
...
lPig. 1.9 Helationship between Slope/regolith type and erosion features on the Port Hills.
.Fig.
(after Dell
&
Trangmar, 1987).13 Ditdling. FIoI ""' ••
Iii,;)] 0"1)' ea1 ""'u
(.,::;'1 E.oded ph ... 01 e .... l). ear ... Wnl~ Rock and .oiI (baull)
eJ Aauvium
SCALE
o 2 4 I I I
0" '" I
IO~m
PENINSULA
soil. With 2% hydrated lime addition the swelling potential is minimised, while at approximately 5% unconfined compressive strength is maximised. In addition, Bel.l (1981,1982 a and b) and McNeill (1982) have studied the, field application of hydrated lime on Port Hills loess.
Glassey (1986) studied the effect of hydrated lime on index properties, dispersion and strength characteristics of Port Hills loess. His research indicated that 1) The addition of 1% hydrated lime to the loess soil produced a non-dispersive material; 2) with addition of 5% hydrated lime, the swelling potential is minimised, and 3) at about 7% hydrated lime addition, unconfined compressive strength is maximised.
Yetton (1986) has considered methods for identifying tunnel gully erosion in the field, and he also has applied lime-cement stabilisation techniques to infilling of cavities and/or their excavation and backfilling.
1.5. Site Description
1.5.1. Location
The Port Hills make up the north - western flanks of the eroded Lyttelton Volcano (Fig 1.1), separating the City of Christchurch from the Port of Lyttelton. The Whaka Terrace subdivision is located on the lower slopes of the Port Hills (Fig 1.2), and covers an area of about 2.8 ha. Relief on the subdivision varies between 100 and 150 m above sea level. A panoramic view from Whaka Terrace subdivision is shown in Fig 1.11. The subdivision plan includes 14 house sites and one reserve block, together with the development of road and sewage facilities (Fig 1.12-Map pocket).
1.5.2. Bedrock Geology
13
are generally discontinuous and irregular, and occur principally in the southern and south-eastern part of the subdivision (lots 6,7 and 12, which are also shown in FiB 1.12 - map pocket).
Seismic refraction profiles (Fig 1.13-map pocket) indicate that The depth to bedrock varies at different sites of the subdivision. , Section A-A in the northern part of the subdivision illustrates the depth to bedrock is 1-2 m and indicates that the volcanic bedrock occurs as a series of stepped benches (1-2 m high) which are assumed to indicate different lava flows. Section C-C' in the eastern part of the subdivision indicates a depth to bedrock of between 3-7 m. Auger holes drilled along the seismic profiles (Fig 1.13-map pocket) show the bedrock is overlain by loess-colluvium and mixed volcanic colluvium deposits.
1.5.3. Loess and Loess-Colluvium Deposits
Loess, loess-colluvium, mixed colluvium and volcanic colluvium (Bell and Trangmar 1987) cover the slopes at Whaka Terrace (Auger logs-Fig 1.13). Slopes have a westerly aspect, and slope angles vary
..
between 15 and 35 . Loess deposits vary in thickness between 0.4 to 7
m.
Three soil units can be recognized within the loess deposits, which are classified according to Evans (1971) and are;
1) The S layer (or surface layer), which consists of 200 mm of top soil and 220 mm of friable grayish yellow sandy silt.
2) The C layer (or compact fragipan) comprising about 610-630 mm of stiff, dense and compact, yellowish brown silt which shows extensive shrinkage cracking.
3) The P layer (or parent material) which consists of dry, stiff, non plastic light olive/grey brown sandy silt (ML), and which is less dense than the C layer and tends to erode more readily.
The relationship between these units at Whaka Terrace is shown in Fig
1. 14 ( pit 1 og) .
1.5.4. Tunnel Gullies
DEPTH GRAPHIC
(m) LOG
Bulk '0
sample . o.
' 0 o·
4 /'51 ~".-.. -' .. ~.
: 0.. ' 0 '
- C) .
. - 0
Til _ 0 . 0
' . ~.
o 0
0:
..
SOIL LAYER
S
c
p
MATERIAL DESCRI PTION
Highly weathered, loose and moist, dark grey brown organic sandy silt
Mod. weathered, firm, moist, non - plastic yellow-ish brown sandy silt with some rootlets
Stiff to very stiff, dry, fractured and slightly plastic yellowish brown clayey silt with some
fine sand and some orange mottles
Stiff, dry, non - pia stic olive grey brown sandy silt with some gravel size volcanic clasts
( < 10 %)
Stiff, dry, non - plastic, greyish yellow sandy silt with some gravel size volcanic clasts
( > 10 %)
T - Indicales local ion of lube samples
Figure
1.14
Summary pit log
USCS SYMBOL
OL
ML
CL-ML
ML
a) Shallow cavities, which are restricted to locations above the fragipan which limits their vertical development. As a consequence they are generally less than 1m in depth, and usually less than 0.5m in diameter(Fig 1.15).
b) Deep cavity systems, which are located below the fragipan where their vertical development is not restricted.
1.5.5 Seepage Zones
Infiltration of groundwater from precipitation results in seepage zones at the boundary between bedrock and loess deposits. In addition, seepage can also be seen to occur from the exit of various
tunnel gullies, which act as natural drainage paths Fig 1.16).
Seepage is most visible around Lot 15 above the access track (Fig 1.12 - map pocket) , and in the southern part of the subdivision where seepage and poor drainage produces a hummocky relief and swampy ground
(Fig 1.12).
1.6. Investigation Methodology
1.6.1. Field Methods
Field work included engineering geological mapping of Whaka Terrace Subdivision at a scale of 1:500, and the construction
of cross sections at a scale of 1:250. In addition, three seismic
refraction traverses were carried out to determine the depth to bedrock. Seventeen auger holes were drilled along the seismic traverses and at other strategic points to verify the results from the seismic information, and to describe and log the soil profile. A backhoe (Fig 1.17) was employed to dig a sample pit of 2m depth and 2-2.5 m width at Grid reference 818374, (sheet 36, NZMS 260). Pit location is shown in
Fig 1.12. map pocket. The pit was logged (Fig 1.14), and bulk and
tube samples were taken for laboratory testing.
1.6.2. Laboratory Methods
Detailed laboratory characterisation was undertaken on tube and bu"lk samples from the loess-colluvium P - layer in the sample pit. Hydrated lime, gypsum, quicklime, Portland cement and a mixture of hydrated lime and gypsum (in a 1:1 ratio) were used as stabilising
agents. Stabilisers were applied at ratios of 1, 2 and 4 % (as dry
fie;. 1.15a A typical
sha-llow tunnel gully in
loess soil at ~'vhaka 'lIe
(Grid reference 816575
sheet 36, NZ. MS 260).
~ote fragipan layer at
base of cavity.
Fig. 1.15b Various shallow tunnel gulies exposed during
road construction in the eastern part of Whaka
~i5·1.16 Seepage associated
with exit of tunnel Gu
-llies in south of Whaka
Terrace,(Grid reference
817374- sheet 36, NZ. 260).
Fig. 1.17 Collection of bulk sample using backhoe.
laboratory testing. Stabilisers available in 20 kg bag from commercial outlets were used, and they were stored in airtight plastic containers during testing.
The laboratory programme is detailed in chapter 2, and included:
I - Physical and Index characteristics tests. a) In-situ moisture content and density b) Grainsize Analysis
c) Plasticity
d) Standard Proctor Compaction e) Permeability
f) Dispersion
g) Pinhole Erodibility h) Uniaxial Swelling i) Jar Slaking
II Strength Characterisation Tests
j) Unconfined Compressive Strength k) Undrained Shear Strength
III Chemical and Mineralogical Tests 1) X-Ray Fluorescence (XRF)
m) Cation exchange and exchangeable bases
n) pH
0) Soluble salts p) Organic content
q) X-Ray Diffraction (XRD)
r) Scanning Electron Microscopy (SEM) 1.7. Thesis Format
This thesis consists of five Chapters. The first Chapter is introductory and discusses the background and objectives of the study, as well as site geology and investigation methodology.
Chapter 3 examines the strength characteristics of treated and untreated samples, in particular unconfined compressive strength and undrained shear strength.
19
In Chapter 4 the chemical composition and soluble salt concentration in pore water of natural soils, as well as changes in the cation exchange capacity, and soil pH of chemically stabilised samples were stUdied. In addition, the clay mineralogy of untreated samples and the mineralogy of stabilised samples, as related to crystallisation of the cementing agents have been studied by X-Ray diffraction, scanning electron microscopy and EDAX.
CHAPTER TWO: PHYSICAL AND INDEX PROPERTIES 2.1. Introduction
2.1.1. Sampling Methods
A 500 kg bu'lk sample was collected by backhoe from depths between 1.2 and 1.5 m below the ground surface in a sample pit (Fig 1.11, map pocket). The bulk sample may be described as; stiff, dry, non - plastic, olive grey brown sandy silt (ML), with some gravel size volcanic clasts «10 %). The sample was stored in 3 large air tight plastic containers at room temperature in the' Geology Department loading Bay. Tube samples were also collected from the sample pit from the different soil layers, and these were used for the determination of density and in-situ moisture content, dispersion, erodibility and swelling potential of the in-situ samples (Fig 2.1).
2.1.2. Laboratory Programme
The samples tested (both treated and untreated) were cured under three different conditions, as follows;
a) Moist curing for 14 days in the fog room at 20 o C
temperature and 99% relative humidity.
b) Air Drying for 7 days at room temperature following an
o
initial period of moist curing for 7 days in the fog room (20 C and
99% relative humidity)
c) Wetting and Drying for 7 days (cycles of 4 hours wetting and 20 hours of drying) at room temperature following an initial period of moist curing for 7 days in the fog room.
The MC, AD, and WD abbreviations in the text that indicate moist cured, air dried, and wetting and drying conditions respectively. Figure 2.2. presents a schematic flow diagram of the tests performed on the natural soil and chemically stabilised samples.
The bulk sample was tested as:
1) Untreated and uncured (control) samples, which were tested to provide a basis for comparison with the chemically stabilised samples.
2) Treated and cured samples, which had been cured under the three different conditions discussed above, and treated by the application of different stabiliser agents.
GEOTECHNICAL DATA
IN SITU BULK
DRY MODIFIED PINHOLE UNIAXIAL
DEPTH GRAPHIC SOIL MATERIAL USCS MOISTURE EMERSON
(m) LOG LAYER DESCRIPTION :SYMBOL CONTENT DENSITY DENSITY CRUMB CLASS ERODIBiliTY SWELLING (w%l (P tm-3l (Pd tm-3) (Sherared 1976) CLASS ( %)
i
0·0
~~::.~~~:)
Highly weathered, loose fand mOist, dark grey brown OL 10·5 -
-
1(1) --C~~Z.};:~'$ organic sandy silt
0·2 · .. ~ ' . , , . ',' S
Mod. weathered, firm,
·
'f"'~>~"", .. >~ "". ".> mOist, non-plastic yellow- ML 87 1·67 154 2- 3(2) E5d4) 15'5
:,:, .• +::,::,
ish brown sandy silt withrOA some rootlets
0~42
y>~<:<
::)~K Stiff to very stiff, dry,
B~
fractured and slightly plastic yellowish brownrO~
C clayey silt with some NE(5)
~ .. :.~: .. t.;:.:: fine sand and some orange mottles CL-ML 7-4 1·78 1·66 I 6'7
.... ~~
f~
01.. .. · ....
1·05 ~,..-·I>
....
"~.'. ~: ~. :.0.:. ," ~ Stiff, dry, non-plastic
, . ' olive grey brown sandy
f~
. . ... silt with some gravel3_4(3)
. ' '" size volcanic clasts ML 71 1·64 1'54 E50 18
, ..
.' ".' .. ' « 10 'Yo)
sample • 0 •
. . . '0>" . ... :~ p
151 . . .
-
-
-Stiff, dry, non-plastic,
:0.::: :~
<.~ .. "p greyish yellow sandy r l2, " '. '0
silt with some gravel ML 65 1·65 1'55 3-4 E50 21
... " ... ' size volcanic clasts
:~'J. ;,:-:~,,: (> 10%)
-.: .'
r - Indicates location of tube samples (!) -Non dispersive (21 -Slightly to moderately dispersive SCALE 1:10 (3) - Moderately to highly disperSive (41 -Highly erodible (5) -Non erodible
Figure 2. ( : Summary pit log showing index properties for in - situ soil
7MC 7AD 7WD
pH
7 days moist cured at room temp. and 99% RH.
7 days air dried at room temperature
7 days wetted (4 hours) and dried (20hours) cycles € s (uniaxial) W% and P
d
Bulk Untreated I .... ,
J . --~.~-... ~-. ~ I " I sample I
..-7 I
and uncured
Recompacted samples (characterisation)
Tube samples for:
€s (uniaxial) (SPE)
Tube samples for:
€ s (uniaxial) -(SPE)
Tube samples for:
-€ s (uniaxial)
(SPE)
oWL and Wp
14MC
(to)
- Permeability test ,- Jar stake test
-(EST)
Grainsize analyses
organic (%)
Tube samples for:
-Grain size € s (uniaxial) -(SPE) -(EST)
oWL and Wp
CEC
Figure 2.2: Test programme summary
XRF analyses XRD analyses
SEM analyses Soluble salt
OMC/max Pd
I\)
results are discussed in the following sections. Testing procedure for individual tests are summarized in appropriate Appendices 2-8.
2.2. Density/Moisture Content Relationships 2.2.1. In-Situ Samples
Tube samples were collected from depths of 40, 70, 120 and 170 cm (Fig 2.1.) to allow determination of the in-situ moisture content and dry density of loess-colluvium soil. Test procedure followed N.Z. Standard 4402 (1980), and is described in Appendix 2.
Figure 2.1. shows that moisture content'is around 10%, with an average dry density of 1.55 tm- 3. In general in-situ moisture content is reduced with increasing depth, while dry density slightly increases. The most dense material belongs to the fragipan, with a dry density of 1.66 tm- 3 . Data is summarized in Fig 2.1.
2.2.2. Recompacted samples
Previous research by Ladd and Lamb (1960), Hooper and Mitchell (1961), Herrin and Mitchell (1961), Alexander (1972) and Winterkorn (1975) has indicated that the effect of lime treatment is to increase the optimum moisture content, and to decrease the maximum compacted dry density of natural soil. This may be attributed to the flocculating effect of lime on the soil structure (Hooper and Mitchell, 1961). In general, the moisture content/dry density relationship depends on many factors. These are:
1) Type of lime; [Ladd and Lamb (1960) , and Alexander (1972)] 2) Clay content and clay mineralogy; [Croft (1964) , and Neubauer (1972)]
3) Elapsed time between mixing and compaction; [Mitchell and Hooper (1961) , and Mates and Davidson (1963)].
Research on Port Hills loess, by Evans and Be11(1981) , Yetton (1986) and Glassey (1986) indicated that there is a reduction in soil dry density and an increase in the optimum moisture content due to the application of hydrated lime. Furthermore, Evans and Bell (1981) studied the effect of phosphoric acid on Port Hills loess and their results indicated that there is a reduction in optimum moisture content and a corresponding increase in maximum compacted dry density.
In this study, standard compaction tests (proctor mould) on treated and untreated loess-colluvium soil were carried out, and test
results are illustrated in Fig (2.3 and 2.4). The test procedure is outlined in Appendix 2, and a summary of test data is given in Table 2.1 .
Figure 2.4 shows the untreated field sample has a maximum dry density of 1.86 tm- 3 and an optimum moisture content of 13% The effects of Portland cement, hydrated lime, quicklime, gypsum and a mixture of hydrated lime and gypsum (in a 1:1 ratio) on optimum moisture content and dry density are discussed in detail below.
2.2.3. Treated Samples
2.2.3.1. Lime-treated Samples
Figure 2.4 illustrates the effect of hydrated lime application on the optimum moisture content (OMC) and dry density of the soil tested in this study. The results show that at 1% by weight of hydrated lime addition the compacted dry density of the untreated sample decreases by 0.08 tm- 3, while the optimum moisture content increases by 1.7% from 13% to 14.7 % . At higher percentages of hydrated lime addition (2-4%) this trend continues but at a less pronounced rate: for example, at 4% hydrated lime addition the dry density has reduced by 0.13 tm- 3 and the OMC has increased by 2.2% from 13% to 15.2% .
The results of this study agree with those from previous research, for example by Ladd and Lamb (1960); Mitchell and Hooper (1961); Alexander (1972); Winterkorn (1975); Evans and Bell (1981); and Glassey (1986). Test results for quicklime are similar (Figs 2.3 and 2.4).
2.2.3.2. Cement-treated Samples
Figure 2.4 and Table 2.1 suggest that the application of cement to Port Hills loess produces similar dry density / optimum moisture content relationships to those determined for hydrated lime and quicklime application. However, with application of 4% by weight of cement the optimum moisture content increases by a significant amount to 16.5% .
2.2.3.3. Gypsum-treated Samples
A. 1%1 by weight
~ Ix
~ 1.75, . .
I.LJ
a
>-25 F70
j·65
zero aIr voids line
I
B. 2 % by weight
1·90
1·70
165
QL
1·601 I I I i i I 1·6041... . . . . .
-10 12 14 16 18 20 22 10 12 14 16 18 20
WATER CONTENT (%) WATER CONTENT ("(0)
Stabilised Soi I
~ .. -.. ~ G Gypsum
6 - 6 CE Cement Control Soil
.---.
CL Quick limeI • I
U T UntreO!~dJ0- --0 HL Hydrated lime
®- .. -<D (G >HL) Gypsum> Hydrated lime
190
j·85
1·80
1-75
Fro
165
C. 4 % by wei ght
, x ~."
"
zero air vOids
,/ line
.~ ~,"UT
J) \;
HLC/,~~
Ql/i .:pCe:
<11 (G>HL)
160/ w
9 13 15 17 19
WATER CONTENT (0/0 )
NOTE
Samples compac~ed crf~er
I hour condition ing
Figure 2.3: Effect of chemical stabilisers on optimum moisture content and dry density.
21
N
,y! 0 0 0 ox,
1'85 17
6 CE '.
16
_15
~
o
/
~
014
1t
~f·~
___
x-- .... -'----x G/-. -x'
13 -' _ •• '
UT
12
" I ,
o I 2 3 4
WEIGHT PERCENT STABIL!SER
Sl\lbilised Soil
x._ •• xJG Gypsum
6 - 6 1CE Cement
~IQL Quick lime
0 - -01 HL Hydrated lime
®-"-<%II (G.HU Gypsum • HyCrotedlime
1·62
,...,
'E 1.79
<J!!
x
<l: Fi6 ::!;
1·73
1·70
"
x- • - • - ••• - ••• x G
5
1·67 ":!"l---.--.----,---..,---.
o I 2 3 4
Control Soil
[II
I
UT UntreotedI
5
WEIGHT PERCENT STABILISER
£:!!lli..
Samples compacted efter I hour condihoninq
Figure 2.4: Optimum Moisture Content I Max imum Dry Density Relationship of Trea ted and Untreated Samples
'"
27
Table 2.1 Effect of chemical stabilisers on dry density and OMC.
TYPE OF DRY DENSITY OPTIMUM MOISTURE
STABILISER tm-3 CONTENT (OMC) %
UNTREATED
SAMPLE (O%) 1.86 13.0
GYPSUM
1% 1.86 13.3
2% 1.80 13.5
4% 1.80 13.5
QUICKLIME
1% 1. 79 14.2
2% 1. 78 14.6
4% 1.72 15.5
HYDRATED LIME
1% 1. 78 14.7
2% 1.77 14.9
4% 1. 73 15.2
PORTLAND CEMENT
2% 1.77 15.0
4% 1.72 16.5
GYPSUM+Hydrated LIME
2% 1. 78 14.8
application, the dry density is reduced by 0.06 tm- 3, while the OMC increases by 0.5% from 13.0 to 13.5% . This is related to flocculation of clay minerals, and an increase in void ratio of gypsum-treated samples.
Figure 2.4 illustrates that the application of 2-4% mixed stabiliser (hydrated lime and Gypsum in a 1:1 ratio) produces similar results to that of hydrated lime addition (2-4%).
2.3. Grainsize 2.3.1. Field Sample
Grainsize determination for untreated field samples and stabilised moist cured samples were made using dry sieve and hydrometer analysis. The test procedure for grainsize analysis is summarized in Appendix 3.
The results (Table 2.2) suggests that the untreated and uncured loess-colluvium sample from Whaka Terrace consists of a slightly sandy clayey silt containing 10 % sand, 14% clay, and 76% silt respectively. The untreated moist cured sample consist of l~k sand, 12% clay and 78% silt.
2.3.2 Stabilised Samples
2.3.2.1. Hydrated lime-treated Samples
Brand and Schonenberg (1959) ; lund and Ramsey (1960) ; Herr;n and Mitchell (1961) ; Brandl (1981) and Glassey (1986) all have indicated that the addition of hydrated lime to a moist soil produces a decrease in silt and clay content, and an increase in sand percentage. Analysis of Fig 2.5 indicates that:
1) with addition of 1% by weight of hydrated lime, a marked reduction in clay content by 6% is noticeable, and this is accompanied by a corresponding increase in the proportion of sand whilst the silt percentage remains almost unaffected;
2) at 2% by weight of stabiliser addition, a marked reduction in silt content is observed in addition to the decrease in clay content, with a correspondingly greater increase in the sand percentage;
A Clay 16 14·MC ;:e • -12 2 o i= u <::
0:: 10
lL.. ~ -l U 8 6
4 ! I j ,
o 2 3 4
WEIGHT PERCENT STABILISER
Control Soil
G :E CL HL 80 75
8. Silt
/.Ie - <- - - -x G Me __ -
<-~~~---o .~"::,...,
...
~"-~ 70
" .. '\ 6,
... '\, .
"-... ~.:::-~ - - - - 0 HL
2
Q ~ u ~ 65 lL..
", .. - .. -··®(G.HL)
'"
"'-~
(J1 'neE
60
CL
55
50~!L---~---;---.---.--
o I 2 3 4
WEIGHT PERCENT STABILISER
< •••• --x I G Gypsum
6 - 6 1 CE Cement
;:e
!...
35
30
2 25
o i=
u <::
E 20 Cl
2
<:: (J1
15
C. Sand
CL
6CE
/
/
0 - - r - _-0 HL
I ® - . r .. - · _··®(G,HL)
I I /
I·· 6
/1.// /
r;,1fJ/
,j/
fJ/
10Jj'f?:-· .' MC -< .. - - - ... - --' - - - •• < G
5 I I , 1
o I 2 3 4
WEIGHT PERCENT STABILISER
NOE
Clay <2 )1m, silt 2-60 "1m, send 60-20CO-"m
NC Not cured ""--"1 QL Quicklime I Stobilised Soil
2. With I!<cection of :he control sample (NC), all semples were 14 days mOist cured, (RH 99% and 20·CI 3. The ~est nesults ane based on
hydromerer end sieve anclysi 5
with two tests per sample
MC MOist cured 0 - - 0 I HL Hydnoted lime
®- .. -·~I (G tHLl Gypsum t Hydroted lime
Figure 2.5: Effect of chemical stabiliser on grain size distribution N
Table 2.2 Effect of chemical stabilisers on grainsize distribution.
TYPE OF SAND% SILT% CLAY%
STABILISER 2000-60 ).1m 60-2 ).1m
<
2 pm FIElD SAMPLENOT CURED (0%) 10 76 14
RECOMPACTED
MOIST CURED (0%) 10 78 12
GYPSUM
1% 11 77 12
2% 11 78 11
4% 12 77 11
QUICKLIME
1% 18 74 8.0
2% 29 63 8.0
4% 34 59 7.0
HYDRATED LIME
1% 17 75 8.0
2% 24 69 7.0
4% 25 68 7.0
PORTLAND CEMENT
2% 20 72 8.0
4% 30 62 8.0
GYPSUM+HYDRATED LIME
2% 23 69 8.0
continues, but at decreasing increments.
The results suggest that at 1% addition by weight of hydrated lime the stabiliser is used up in its reaction with the clay fraction, while at 2% addition the stabiliser is sufficient to react with both the clay and silt size particles, as suggested by the reduction in the silt content. Fig 2.5 shows that 2% hydrated lime is the optimum loess/stabiliser mixture for increasing the sand size fraction, while higher percentages of stabiliser have decreasing effectiveness.
The results from this study indicate an increase in sand size particles with the application of hydrated lime at 1, 2, and 4% . These results agree with the overall trend described by Glassey (1986), implying an increase in sand size with hydrated lime addition. However, Glassey suggested a decrease in sand size particles from 14% for natural soil to 10% upon application of 1% hydrated lime. This result is not supported by the finding of the present study, or by research from Lund and Ramsey (1959) which are shown in Fig 2.6 .
In summary, laboratory study suggests that the application of hydrated lime to Loess-colluvium soils from Whaka Terrace has the effect of changing the grainsize distribution, and it may be reclassified from a slightly sandy clayey silt to a sandy silt (24% sand, 69% silt and 7% clay with 2% hydrated lime addition).
2.3.2.2. Quicklime-treated Samples
The effect of quicklime on the grainsize distribution of the loess-colluvium samples is similar to that for hydrated lime, but its effect is much more pronounced (Table 2.2). Figure 2.5 (c) illustrates an increase in the sand size fraction from 10% for field sample to 18 and 29% upon application of 1 and 2% quicklime respectively. The greatest percentage increase in sand size fraction is obtained with the addition of 2% quicklime.
2.3.2.3. Portland Cement-treated Sample
The addition of Portland Cement to loess-colluvium samples after 14 days moist curing has a similar effect to that of both hydrated lime and quicklime. Test results suggest, however, that application of 4% cement is more effective than 2% cement in increasing the sand size fraction of the samples (Figure 2.Se). Also it can be seen that although the application of 2% Portland cement has a significant effect on grainsize distribution, its effect is less
80
70
.--
-
-.(1)
/
/
60
/
-
~•
°
l-I
:c
50 (!)
w
/
3:
-
z
40-
/
0
I-U
/
<t
".®
a::
I.J.. 30
•
.// '
a
I~/
./Z
... ®
/ '~
...
/ '-
_.'"
20- "..,-e..,.. ...
.-
-"
4~ .. '" ./ ....
'"
lOa ~
....
"O+---~~--~--~--~~--~--~~--~
o
i
2 3 4 56 7 8 9
10
WEIGHT PERCENT HYDRATED LIME
Figure 2.6: The effect of the application of hydrated lime on the sand size fraction of
different soi Is
Q)-
Glacial clay (sand 31 %, silt 33 %, clay 36%)south of Nebrasca, Lund
a
Ramsay (1959)® -
Loess colluvium (sand 14<Yo,
silt 65%,
clay21 %) Port Hills, Glassey (1986)
® -
Loess colluvium (sand 10%, silt 76%,
claypronounced than that of 2% hydrated lime and quicklime. 2.3.2.4. Gypsum-treated samples
Figure 2.5 shows that there is no appreciable change in distribution of the loess-colluvium samples resulting application of gypsum. The small reduction in clay content
grainsize from the (2-3%) and the small increment on the percentage of silt (1 -2%) is due to the flocculation of clay particles. Therefore, while gypsum acts as a flocculant, it does not appear to produce a cementing agent which will bond the silt particles into larger aggregates.
2.3.2.5. Mixed hydrated lime and gypsum-treated samples
The test results suggest that the application of a mixture of hydrated lime and gypsum (1:1 ratio) is comparable with the effect of pure hydrated lime addition. For example, with application of 2% mixed stabiliser, and hydrated lime a reduction in silt fraction (from 78% for untreated sample to 69% for stabilised samples) as well as a reduction in clay fraction (from 12% for untreated sample to 7-8% for stabilised samples) is observed. this is accompanied by a corresponding increase in the sand fraction (from 10% for untreated sample to 23-24% for stabilsed samples).
2.3.2.6. Summary
In summary, the following effects of different stabiliser agents on the grainsize distribution of Whaka Terrace loess-colluvium soil have been observed:
1) of the four stabilisers used, three (hydrated lime, quicklime and cement) have the effect of reducing the clay and silt fraction of the soil by flocculation and agglomeration, resulting in an increase in the sand size fraction of the soil. The fourth stabilising agent (gypsum) was found to be ineffective in increasing the sand size fraction.
2) Quicklime was found to be the most effective stabiliser with regard to increasing the sand size fraction.
3) For quicklime and hydrated lime it was found that the application of 2% by weight of stabiliser produces the largest percentage increase in the sand size fraction.
4) For cement it was found that the application of 4% by weight of stabiliser produces a greater percentage increase in sand
size fraction than the 2% application, and this contrasts with the results for lime stabilised samples.
2.4. Plasticity 2.4.1. Test Methods
A review of the literature suggests that the effect of lime on the plasticity of natural soil is variable and dependent on many factors. In summary these are:
I} The type of clay mineral and the amount of clay present in the soil (Lund and Ramsay, 1959; and Fosberg, 1969).
2) Type and amount of lime applied (Stocker, 1975).
3} Composition of the pore water and the exchangeable cations originally present in the soil {Grim, 1962}.
In this study Atterberg limit tests were carried out to determine the effects of chemical stabilisers on the plasticity characteristics of loess-colluvium soil from Whaka Terrace. Test procedures are outlined in Appendix 2 and laboratory results are shown in Fig 2.7 and Table 2.3.
2.4.2. Treated and Untreated samples
Figure 2.7 shows that the untreated field sample has liquid limit
=
24, plastic limit = 17, and plastic index = 7, which indicatesa clayey silt of low to very low plasticity. The activity (plasticity index/percentage of clay fraction) of the soil is 0.70 (Fig 2.8). These activity and plasticity data correspond to the activity of
illitic types of soil (Skempton, 1953; Seed et a1, 1964). 2.4.2.1. lime-treated Samples
A. Liquid Limit Wl 34 Ql Hl 32 Cl (G~HU 30 28 26 24"'UT
22 I I I , I
o I 2 3 4
WEIGHT PERCENT STABIUSER
Stabilised Soil
x- - - -x G Gypsum D,.-D,. CE Cement
0- -0 Ql Quick lime
----.
Hl Hydrated lime ®-,~ (G. HU Gypsum. Hydrtlted limeWp 27 25 23 21 19 17
B. Plastic
Ql Hl ';/ - CE
y 'I,.® {GtHU
' ; / . '? / /
y /
y / /
/ /
'/
/ ®/
o .. /c:f
./,..,,'L • ..,--X. -
--~? ~ _ _ - - . - - - -;( G
...
UT
15 I i I I
o 2 3 4
W EIGHT PERCENT STABIUSER
ContrOl Soil
I_rUT
U~t~~t;jlAil samples moist cured
for 14 days
Figure 2,7: Effect of Chemical Stabilisers on Plasticity Characteristics
C. Plasticity Index PI
12
11-1 ~
/
\
10-1 A.
\
'"
....9-1 ~ /
""'0 --,
~(G
t HLlQl
81 /,' .u - Hl
CE
7-i1-·---x---x--- ---x G UT
6 , I I I I
o 1 2 3" 4 WEIGHT PERCENT STABIUSER
NOTE
I. All samples were moist cured for 14 days (RH 99% and 20Q
C)
2 Results ore overage of 2 samples
5% hydrated lime-treated samples were 13.1, 13.0, and 13.0 respectively.
Analysis of Fig 2.7 indicates that with up to 2% hydrated lime application the activity of loess soils increases from 0.7 to 1.42, corresponding to the reduction in clay content and increase in plastic
index. In excess of 2% stabiliser addition, the activity of the loess-colluvium is reduced, and this trend is in agreement with previous research by Clare and Cruchely (1957), and Brandl (1981). 2.4.2.2. Quicklime-treated Samples
The effect of the application of quicklime on plasticity and activity of loess-colluvium soil is similar to the effect of hydrated lime (Fig 2.7and 2.8). The test results (Table 2.3) suggest that with the application of 1 and 2% quicklime the plasticity index increases from 7 for untreated samples to 10 for stabilised samples. The increase in the plasticity index is result of an increase in the liquid limit (from 24 for untreated samples to 31 for stabilised samples) as well as an increase in the plastic limit (from 17 for untreated sample to 21 for stabilised sample). At 4% quicklime addition the plasticity index of stabilised samples decreases due to a high increase in the plastic limit (from 21 for 2% stabilised samples to 24 for 4% stabilised samples).
2.4.2.3. Cement-treated Samples
Test resu1t(Table 2.3) indicate that cement application produces a similar response to that of hydrated lime and quick lime. At 2% cement application the plastic index increases significantly, mainly as a result of an increase in the liquid limit, while the plastic limit remains almost unchanged. It therefore differs from the application of lime, and reinforces the results of grainsize analysis whereby major changes become apparent at 4% application of cement rather than 2% . 2.4.2.4. Gypsum-treated samples
1'50
1·30
>-
1·10
I-QL HL
>
I-~ 0·90
0·70
_ -x---x G "'x
-O' 50 - t - - - . . - - - r - - - . - - - - r - - - - r
o
I 2 3 4 5WEIGHT PERCENT STABILISER
Control Soi I
• I
MC Moist curedI
All samples moist cured for 14 days
• •
0 - - 0
6 - 6
®- .. -®
x- - - - -x
Stabilised Soi I
QL Quicklime
HL Hydrated lime
CE Cement
(G t HL) Gypsum t Hydrated lime
G Gypsum
Figure 2.8: Activity of treated and untreated
loess-colluvium sample from Whaka Terrace,
Port Hills.
Table 2.3 Effect of chemical stabilisers on plasticity and activity.
TYPE OF LIQUID PLASTIC PLASTIC ACTIVITY
STABILISER LIMIT(WL) LIMIT(WP) INDEX(PI) (Ac)
UNTREATED SAMPLE
0% 24 17 7 0.7
GYPSUM
1% 25 18 7 0.58
2% 25 18 7 0.63
4% 25 18 7 0.63
QUICKLIME
1% 29 20 9 1.12
2% 31 21 10 1.42
4% 32 24 8 1.14
HYDRATED LIME
1% 26 18 8 1.0
2% 31 21 10 1.42
4% 32 24 8 1.14
PORTLAND CEMENT
2% 29 18 11 1.37
4% 32 24 8 1.0
GYPSUM+HYDRATED LIME
2% 29 19 10 1. 25
39
2.5. Permeability 2.5.1. Test Methods
In this study permeability characteristics of treated and untreated loess-colluvium from Whaka Terrace were investigated using falling head permeability tests (Fig 2.9). The field sample and stabilised samples were compacted in a Proctor mould (105 mm diameter) in a single layer, and were then moist cured for 14 days at 99% relative humidity and 20° C). The test method is outlined in appendix 4, and data are summarised in Table 2.4.
2.5.2. Treated and Untreated samples
Figure 2.10 shows that the untreated recompacted field sample has a coefficient of permeability of 2 x 10-S ms- l ), a bulk density of 2.06 tm- 3 and a dry density of I.S4 tm- 3. The laboratory results (Table 2.4) indicate that the permeability of Whaka Terrace loess-colluvium increases as a result of the application of chemical stabilisers, and in summary it can be seen that:
1) The application of 1% by weight of hydrated lime and quicklime produces an increase in the coefficient of permeability of about 100 times (2 x 10-S m/s to 2.6 x 10- 6 m/s). This trend continues with increasing lime content, but at decreasing effect-iveness.
2) The application of Portland cement has a similar effect on the permeability of loess soil to that of hydrated lime and quicklime (Table 2.4. and Fig 2.10).
3) The application of gypsum produces an increase in the coefficient of permeability by almost ten times relative to the untreated samples (Fig 2.10).
4) There is an inverse relationship between compacted density and permeability of hydrated lime, quicklime and cement-treated samples. This is due to flocculation of clay and agglomeration of silt size fraction of the stabilised soil, results in an increase of sand fraction (section 2.3.2.) therefore, the pore volume increases and the bulk density of saturated soil decreases, thereby increasing soil permeability (Fig 2.10b).
H = Height T= Time
a = cross - section area of stand pipe
(O·28cm2 )
meability mould (cp=3'6cm)
= cross - sectional area of sample
(9·75cm2 )
. x . . .
x ....
x'·' ... ' x.: -: .. :.: ....
:·x.· ...x .' ., . . ' . . . ' x
.:
:.~
: JSOil specimenI
:~.'.::.
. . . . ~ .
• ' . .' I ,; • x .. x. ·x·. X.·.x
• • " ' • • • I
Plastic washer
K= ~
A x
loge (H1/H2 )