Abstract—The success or failure of Software Project management consists of two components, namely the technical and non-technical components of software development. Non-technical related components of software development process tend to be under managed. Further research on success and failure of software projects developed in-house are sparse. Therefore a study was conducted in India among the industries that are into in-house software development, to investigate the influence of the non-technical components of the software development process, on success and failure of software development from the practitioners’ perspective. The study reveals that practitioners’ consider the level of customer/user involvement, software process management, and estimation & schedule contribute most to project success and failure.
Index Terms— Failure, In-house, Non-technical components, Software development process, Success.
I. INTRODUCTION
To have a successful software project, it is essential to identify what constitutes success. Projects succeed when enough factors go well to allow a project’s objectives to be satisfied. Project success and failure can rarely be described in absolute terms. If failure is no accident then success is no accident. Failure and success provide different perspectives on improvement: failure tells what not to do in future, where as success shows what should be done again.
A review of extant literature shows that studies on success factors have been predominantly conducted in the Western settings [2], [3], [9], [15], [16], [18]. Literature reveals that decades of individual and collective efforts by project management researchers since the 1960s, have not led to discovery of definite set of factors leading to project success [4], [6], [9], [18]. The reasons could be attributed to methodical differences, the culture, and factors pertaining to the work role. Nevertheless, studies on project success factors in India are at a primitive stage.
In recent years, researchers in project management have become increasingly interested in success and failure factors [2], [3], [7], [9], [19].
S.N.Geethalakshmi is Lecturer and Research Scholar in Department of Computer Science, Avinashilingam University for Women, Coimbatore, Tami Nadu, India (Phone: +91 9789774236; sngeethalakshmi@yahoo.com ) Dr. A.Shanmugam, Principal, is with Bannari Amman Institute of Technology, Sathyamangalam, Tamil Nadu, India (dras_bit@yahoo.com)
Knowledge and understanding of success and failure factors, as well as how to measure them and the interactions between these factors have great importance for project management effectiveness.
The success or failure of Software Project management consists of two components, namely the technical and non-technical components of software development. The technical issues of software development include those directly related to hardware and software. Non-technical issues relate to people and process-related components of the development process. Non-technical related components of software development process tend to be under managed. The cause of most project failure has little to do with technological issues, despite the tendency among project managers to focus on technical issues involved in software development [13].
There is a lack of quantitative research into the non-technical components of software development projects, specifically from the perspective of software practitioners [13]. Further research on success and failure of software projects developed in-house are sparse [9], [19]. Therefore a study was conducted in India among the industries that are into in-house software development to investigate the software development success and failure. This study investigated the influence of the non-technical factors of software development process, on success and failure of software development from the perspective of software practitioners.
Previous software engineering studies have suggested a number of non-technical components that contribute to the eventual success and failure of software development, however, the joint occurrence are captured only with three factors [14], [19].
The non-technical components/factors can be broadly categorized as
1) Sponsor/management support and participation (people and process-related)
2) Customer/user support and participation (people and process-related)
3) Requirement management (people and process-related) 4) Estimation an schedule (people and process-related) 5) Project manager and relationship with development staff (people and process-related)
6) Software process management (process-related) and
Success and Failure of Software Development:
Practitioners’ Perspective
7) Software development personnel (people -related). Research on the joint occurrence of all the non-technical components of project management is sparse. This research investigated the above stated list of non-technical components of software development process and the joint effect of the chosen non-technical components that determines the success and failure of software development.
II. PURPOSE AND SIGNIFICANCE OF THE STUDY Over-management of technical issues and under-management of non-technical people related issues is the problem that software development is facing. Managing technical issues tends to be more straightforward than managing non-technical, people, who come with their unique personalities, strengths, weakness and opinions. Therefore managing non-technical, people-related components tend to be difficult. As a result non-technical issues more often plague software development than technical problems. Moreover in-house developed software tend to get deviated from estimates and schedule due to various reasons like; more attention for maintenance and support for already implemented projects, lack of resources, lack of required participation of stakeholders due to their day to day activities and other priorities.
This study will help to fill the current quantitative, survey-based research gap on the non-technical components of the software development process specifically from the perspective of software practitioners of India. This study is also intended to enlighten project managers with regard to the importance of practitioners’ overall perception of project success. Therefore an understanding of the importance of software development success and failure will have significant implication for the organization and the software practitioners.
III. RESEARCH METHODOLOGY A. Research Focus
The research focus is to study software development success and failure of in-house developed software projects in India. The research focus is also to study the level of non-technical components and to predict the success and failure of software development by the selected non-technical components from the software practitioners’ perspective.
B. Research Questions
Q1. What is the level of non-technical components? Q2. What non-technical factors predict software development success and failure from the software practitioners’ perspective?
C. Objectives of this study
1) To study the level of non-technical components/factors. 2) To predict the software development success and failure by the selected non-technical components from the software practitioners’ perspective.
D. Research Model
In this context the researcher has developed a model to be tested (Fig 1). The model treats the chosen non-technical components as predictors or independent variables and success and failure of the software development as the dependent variable or the grouping variable. This is a predictive model where the chosen non-technical components are tested for prediction of success and failure of software development.
E. METHODOLOGY
The major purpose of this investigation is to capture the factors that predict the success and failure of software development.
It was decided that a descriptive study using primary data would be appropriate to investigate the objectives. The instrument used to collect the data was a questionnaire. Instrumentation
For the purpose of studying the objectives, a questionnaire has been used as an instrument to collect the data. The questionnaire has two parts; the first part measures the short profile of the respondents and the second part measures the study variables.
The variables chosen for this study are Management support, customer/user, requirement, estimation and schedule, project manager/staff, software process management and personnel. The items capturing each factor have been adopted from earlier research [19]. The items that constituted adequate coverage of the factors under study were decided and agreed upon by the researcher.
The second part of the instrument captured the study variables and the items of the study variables, which were adopted from [19], management support scale consisted of 7 items, customer/user consisted of 8 items, requirement consisted of 8 items, estimation and schedule consisted of 11 items, project manager/staff consisted of 16 items, software process management consisted of 22 items, and personnel consisted of 18 items.
Validity test
The questionnaire was subjected to face and content validity whose determination was judgmental.
The face and content validity of the items were conducted with 8 experts. The content validity ratio (CVR) was applied to each item, using the formula developed by [11].
Ne - N/2 Content Validity Ratio = --- N/2
where Ne = number of panellists indicating “essential” and
N = total number of panellists.
All items scored less than 0.50 on the content validity ratio have been removed from the study. Based on the face validity and content validity ratio, the final number of items in each of the factors taking part in this study was decided.
factors is as follows:
Management Support : 7 items Customer / User : 8 items Requirements : 8 items Estimation and schedule : 11 items Project manager / staff : 13 items Software process management : 20 items Personnel : 16 items
These items were made on a 5-point scale anchored by 1 = strongly disagree; 2 = disagree; 3 = neither agree nor disagree; 4 = agree and 5 = strongly agree and the mean of the items under each factor was used as a composite measure of the respective factors.
Sampling frame
The geographical area of Coimbatore city (India) was chosen as the Universe. The main reason for choosing Coimbatore city is that the investigator is located here and is familiar with the place. Familiarity is found to be essential for gaining accessibility to the respondents as well to solicit genuine participation by the respondents.
Administration and justification of the sample A list of companies having an in-house software development department was prepared. 58 companies were chosen. From this list, only those companies which had at least a project leader to lead a project had been selected; the project managers/project leaders should have undertaken led and completed at least one software project. A total of 41 companies were identified. After identifying the companies, snowball sampling technique was used to select the respondents. Accordingly, 141 software practitioners were identified.
A thorough follow-up was done in person and over telephone to expedite the process of filling up the questionnaire. Yet few questionnaires were not returned and few were unusable and incomplete, yielding a response rate of 71.42% (100 usable questionnaires). Filled-in questionnaires from 34 companies alone were returned. The final sample size is of considerable size when compared to some relevant prior studies [5], [9], [14]. The industry sectors of respondents’ organizations are manufacturing sector, Textile & Sugar mills and hospitals.
Techniques used for analysis
The techniques used for analysis were mean, standard deviation, correlation, and discriminant analysis. Mean and standard deviation were used to study the level of non-technical components. Discriminant analysis was used to predict the success and failure of software development by the study variables from the practitioners’ perception.
IV. ANALYSIS AND INTERPRETATION The data collected from the respondents was tabulated and analyzed using appropriate statistical techniques mentioned in the research methodology.
Testing the objectives
This section contains tabulation of techniques used to study the objectives mentioned above.
Objective 1: To study the level of non-technical components/factors.
To study this objective mean, standard deviation and intercorrelations among the study variables were found which are shown in the Table I. The results indicate moderate correlations and there is no evidence of multi-collinearity [8]. The Table I shows that the mean score for management support is 3.33, customer/user 3.48, requirement 3.38, estimation and schedule 3.40, project manager/staff 4.41, software process management 3.77, and personnel 3.46.
Objective 2: To predict the software development success and failure by the selected non-technical components from the software practitioners’ perspective.
Stepwise Discriminant Analysis (DA) is performed to predict the success and failure of software development by the study variables from the perspective software practitioners. The stepwise DA resulted in a 3 – step discriminant model.
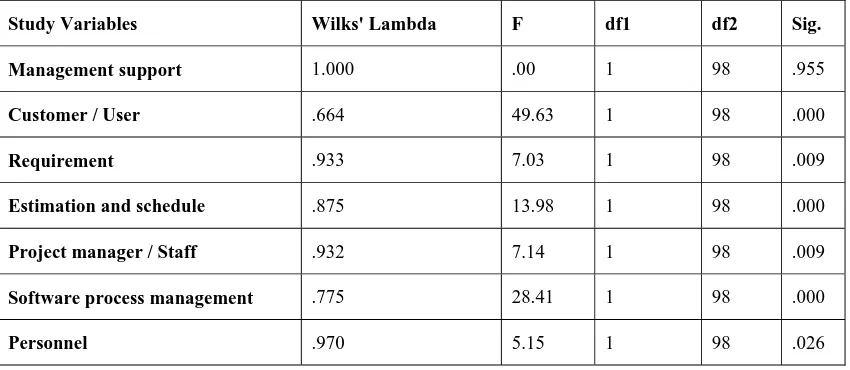
From the Table II the significance levels of the individual variables reveal that on a univariate basis, Customer/User, Requirement, Estimation and schedule, Project manager/staff, and Software process management and Personnel, display significant differences between the group means. Management support is not significant across success and failure of software development. Visual examination of the group means provide information about the differences between the groups, however, the statistical significance of any specific comparison is not known. This is important in discriminant analysis, though only two groups are involved in this model.
The Table III presents the three steps of the stepwise discriminant model. In the first step, the variable Customer/user entered the model. In the second step Customer/user entered discriminating between the success and failure along with Software process management. In the third step Customer/User entered discriminating between success and failure along with Software process management and estimation and schedule.
At each step, the variable that maximizes the Mahalanobis distance between the two closest groups is entered.
The Table IV gives a summary of the 3 steps involved in the discriminant analysis. The variables customer/user, software process management, and estimation and schedule enter the discriminant function. Discrimination increased with the addition of each variable, achieving by the third step a substantial ability to discriminate between the groups. This is indicated by the Mahalanobis D² value which is significant. As the variables enter in each step from 1 to 3, the respective stepwise models are significant indicated by the significance of the F – value, shown in Table IV. The overall results are also found to be statistically significant and continue to improve in discrimination as evidenced by the decrease in Wilks’ Lambda value (from 0.664 to 0.462). The Table IV describes the 3 variables that were significant discriminators based on their Wilks’ lambda and minimum Mahalanobis D².
The multivariate aspects of the discriminant model are explained by the Canonical Discriminant Functions reported in the Table V. As two groups are involved, the model produced one discriminant function. The discriminant function is significant displaying a canonical correlation of 0.759. The functions are statistically significant as measured by the Chi-Square statistic = 74.62, and that the function accounts for 100% of the variance explained. The total amount of variance explained by the function in the dependent variable is 57.61%.
To assess the contributions of the seven predictors, the researcher has examined the structure matrix, which is indicative of each variable’s discriminating power (shown in Table VI).
It is found that Customer / User have the largest discriminating power with coefficient 0.66 followed by Software process management 0.49, and Estimation and schedule 0.35.
The predictive accuracy of the discriminant function is assessed using the classification matrix. The Table VII shows that the discriminants function in combination achieve a higher degree of classification accuracy. The hit ratio for the analysis is 92.0%. The final measure of classification accuracy is Press’ Q calculated to test the statistical significance that the classification accuracy is better than chance.
[N – (nK)]² Press’ Q = --- N (K-1) Press’ Q = [(100 – 92(2)]² --- 100 (1)
= 70.56
The Press’ Q statistic calculated is compared to the critical value based on Chi-square distribution. The calculated value
is more than the critical value at a significance level of 0.05. Therefore, the classification results are significantly better than that which would be expected by chance.
V. FINDINGS AND DISCUSSION
It is found that practitioners’ consider the level of customer and user involvement contributes most to project success and failure. Practitioners perceive the next important factors to be software process management, and estimation and schedule. The findings of this study suggest that involvement of customers/users should occur in all phases of software development. The level of customer involvement may enhance the confidence of the practitioners.. Researches in the West report that customer/user is the most important factor predicting success and failure [1], [2], [10], [12], [17], [19].
Software Process management influencing success and failure suggests that the plan for the software development, and monitoring and control is an important management activity. While planning is cautiously done at the start of the project, risk management, and monitoring and control are exercised at every phase of the project.
Effective estimation is one of the most challenging and important activities in software development to attain success. A good schedule is reasonable and achievable and all efforts to compress the schedule might not lead to success. Estimation and scheduling parameters such as size, effort, time, cost, and quality are reliably estimated and scheduled such that success and failure is predicted by estimation and schedule. The researcher views that estimation and schedule is also an important factor in prediction of success and failure.
VI. CONCLUSION
The success and failure of software project is not only a unique pattern in Western countries but also it pertains to countries like India too. Given the cultural differences in attitudes, values, and behaviors towards work, this study enables to see the pattern that is emerging in industrializing and economically progressing countries like India. The study is one among the pioneer research gleaned from several success and failure literatures providing insight into the importance of the non-technical factors in understanding the software development success and failure.
APPENDIX
[image:5.612.66.491.532.717.2]Figure 1.1: Success and failure model (Research Model)
Table 1.1: Mean, standard deviation and inter-correlation among the study variables
Study Variables
Mean
(S.D)
1 2 3 4 5 6
1. Management support 3.33 (.70) 2. Customer / User 3.48 (.43) -.01
3. Requirement 3.38 (.52) .12 .12
4. Estimation and schedule 3.40 (.37) -.06 .14 .33* 5. Project manager/staff 4.41 (.87) .12 .12 .26* .27* 6. Software process
management
3.77 (.37) .12 .10 .42* .30* .30
7. Personnel 3.46 (.31) .14 -.13 -.22** .21** .42** .34**
** Correlation is significant at the 0.01 level (2-tailed). * Correlation is significant at the 0.05 level (2-tailed).
Table 1.2: Tests of Equality of Group Means
Study Variables Wilks' Lambda F df1 df2 Sig.
Management support 1.000 .00 1 98 .955
Customer / User .664 49.63 1 98 .000
Requirement .933 7.03 1 98 .009
Estimation and schedule .875 13.98 1 98 .000
Project manager / Staff .932 7.14 1 98 .009
Software process management .775 28.41 1 98 .000
Personnel .970 5.15 1 98 .026
Project manager / staff
Success and failure Requirement
Management Support Customer / User
Estimation and Schedule
Personnel Software process
Table 1.3: Study variables in the Analysis
Step Study Variables Tolerance F to Remove Min. D
Squared Between Groups
1 Customer / User 1.000 49.632
Customer / User .938 57.239 1.557 Success and Failure
2
Software process management .938 35.066 2.721 Success and Failure
Customer / User .936 54.941 2.031 Success and Failure
Software process management .920 26.337 3.763 Success and Failure 3
Estimation and schedule .973 5.418 5.647 Success and Failure
Table 1.4: Summary of Study variables Entered/Removed
Min. D Squared
Exact F
Step Study Variables
Entered
Wilk’s
Lamda Statistic Between Groups
df1 df2 Statistic
1 Customer / User .664 2.72* Failure and Success 1 98 49.63*
2 Software process
management .488 5.65* Failure and Success 2 97 50.98*
3 Estimation and
schedule .462 6.30* Failure and Success 3 96 37.34*
* significant at 0.05 level
Table 1.5: Eigenvalues
Function
Eigen
Value
% of Variance
Canonical
Correlation Wilks’ Lambda Chi-square Df Sig
1 1.167 100.0 .759 .462 74.62 3 .00
First 1 canonical discriminant functions were used in the analysis.
Table 1.6: Structure Matrix
Study Variables Canonical discriminant function
Customer User
0.659* Software process management
0.498* Estimation and schedule
0.350* Requirement**
0.286 Project manager/staff**
0.166 Personnel**
0.059 Management support**
0.070
* Pooled within-groups correlations between discriminating variables and
Table 1.7: Classification Results
Predicted Group Membership Success and
Failure from practitioners’ perspective
Success or failure Failure Success Total
Failure 23 1 24
Count
Success 7 69 76
Failure 95.8 4.2 100 %
Success 9.2 90.8 100
REFERENCES
[1] Amoaka-Gyampah, Kwasi and White, Kathy B., (1997). “When Is User Involvement Not User Involvement,” Information Strategy: The Executive’s Journal, 13(4), pp. 40-45
[2] Andrew, J.N, and Bytheway (1999). “Successful Software Projects and How to Achieve Them”, IEEE Software, 16(3), pp. 15-17. [3] Belassi, W., and Tukel, O. I. (1996). “A New Framework for
Determining Critical Success/Failure Factors In Projects.” International Journal of Project Management, 14 (3), pp. 141-151. [4] Cooke-Davies, T. J. (2002). “The Real Success Factors In Projects.” International Journal of Project Management, 20(3), pp. 185-190. [5] Delisle, C.L., & Thomas, J.L. (2002). Success: Getting traction in a
turbulent business climate. In Proceedings of PMI Research Conference, “Frontiers of Project management research and applications,” pp. 14-17, Seattle, WA.
[6] Geethalakshmi, S.N., Shanmugam, A. (2007a). “Success Factors of Software Projects”, First International Conference on Knowledge Management for Productivity and Competitiveness, National Productivity Council, India
[7] Geethalakshmi, S.N. & Shanmugam, A. & Subbarayan, V. (2007b). “Critical Success and Failure Factors of Software Projects”, The International Journal of Technology, Knowledge & Society, 3(1) pp. 103-106
[8] Green, P.E., Tull, D.S. Albaum G. (1999). Research for Marketing Decision, Prentice-Hall of India Pvt. Ltd.
[9] [9] Irja Hyvari, (2006). “Success of Projects in Difference Organizational Conditions”. Project Management Journal, 37(4), pp. 31-40.
[10] Jurison, J. (1999). “Software Project Management: The Manager's View”, Communications of the Association for Information Systems, Volume 2(17), pp. 1-57.
[11] Lawsche, C. H. (1975), “A Quantitative approach to content
validity”, Personnel Psychology, 28(4), pp. 563-575.
[12] Nolan, A.J. (1999). “Learning from Success”, IEEE Software, 16(1), pp. 97-105.
[13] Procaccino, J D. (2002b) “Quantitative Models for Early Prediction of Software Development Success: A Practitioner’s Perspective”. (http://hdl.handle.net/1860/76).
[14] Procaccino, J Drew and June Verner, (2002a). ”Software Practitioner’s Perception of Project Success: A Pilot study, International Journal of Computers, The Internet & Management, 10(1), pp. 20-30
[15] [15] Ray, T. & Eden, C. (2002). On Project Success and Failure in Major Engineering Projects. EURAM 2002.
[16] [16] Reel, J.S., (1999). “Critical Success Factors In Software projects”, IEEE Software, 16(3), pp. 18-23.
[17] Sheila Wilson, (1998). “Failed IT Projects (The Human Factor)”, University of Maryland Bowie State University. http://faculty.ed.umuc.edu/~meinkej/inss690/wilson.htm
[18] Shenhar, A.J (2001). “One Size does not fit all projects: Exploring Classical Contingency Domains,” Management Science, 47(3), pp. 394-414.