Abstract—We report initial results from a large ring PET scanner “macroPET” (234 cm detector ring diameter with a field of view 125 cm diameter transaxially x 5.4 cm axially). The scanner was constructed from commercially available BGO blocks and electronics to investigate the practicality of developing a PET scanner suitable for large animal imaging. It comprises 128 BGO blocks mounted in a single ring, corresponding to 8192 individual detector elements in 8 rings. The scanner is currently operated in 2D mode but without septa. The transaxial resolution was measured as 11.2 mm at the centre and 11.6 mm at 25 cm off axis, while the axial resolution was measured as 9.3 mm. The peak noise equivalent count rate for a 20 cm diameter phantom was found to be 30 kcps. Other results on sensitivity and image quality are presented.
Index Terms—BGO block, Filtered backprojection, macroPET, Performance characteristics.
I. INTRODUCTION
Positron emission tomography (PET) is a powerful radiotracer imaging technique, in which the distribution of radiotracer is measured by detecting pairs of back-to-back gamma rays produced in positron-electron annihilation. Over the last two decades, PET has been widely applied as a non-invasive tool for in-vivo diagnosis of human diseases [1], [2]. Considerable work has also been done over the last few years on developing small diameter PET scanners for small animal imaging [3]-[5]. At Birmingham, the technique is also used for studying engineering processes [6].
We believe that PET also has considerable potential in the area of large animal veterinary medicine. However, a PET scanner designed to accommodate human subjects will not be suitable for large animals such as horses. The macroPET system described here was constructed as a prototype to demonstrate the feasibility of performing PET scans on a large scale. It was created by reconfiguring components from an original ECAT 951 system [7], acquired from Guys’ Hospital, UK. The original system had 32 detector modules (“buckets”) mounted in two rings with an inner diameter of 100 cm and a 10.8 cm axial field of view. In the macroPET system the 32 buckets are mounted in a single ring with an
Manuscript received March 06, 2008. This work was supported in part by the IDB Merit Scholarship Program for High Technology and by the University of Birmingham, UK.
M Monjur Ahasan is in the School of Physics and Astronomy, University of Birmingham, Birmingham B15 2TT, UK and is on secondment from the Center for Nuclear Medicine and Ultrasound, BAEC, POB 35, Rajshahi 6000, Bangladesh (email: [email protected]).
David J Parker is in the School of Physics and Astronomy, University of Birmingham, Birmingham B15 2TT, UK (email: [email protected]).
inner diameter of 2.34 m. This paper presents the macroPET design and initial measurements of its characteristics. To the best of our knowledge, this is the first attempt to construct and test a PET scanner with such a large diameter.
II. THE SCANNER DESIGN
The ECAT 951 PET scanner, manufactured by CTI Inc, is based on bismuth germanate (BGO) block detectors. Each block consists of a BGO crystal 50 x 60 x 30 mm3, backed by four photomultiplier tubes (PMTs). The front of the crystal is cut into an 8x8 array of crystal elements, each 6.25x6.75 mm2. By comparing the light intensity detected in the four PMTs, a γ-ray interaction can be unambiguously assigned to an individual crystal element. The blocks are grouped into buckets each comprising four detector blocks together with their associated electronics (preamplifiers and discriminators) under the control of a microprocessor. Data from all the buckets are fed to a set of coincidence processors which identify events in which a pair of 511 keV γ-rays have been detected in two buckets within the resolving time of the system (6 ns).
In the original ECAT 951 the 32 buckets were mounted in two adjacent rings, each with an inner diameter of 100 cm. The 8192 individual detector elements were thus arranged in 16 rings, each of 512 elements. For each bucket, coincidences could be detected with any of the seven opposing buckets in the same ring or in the other ring. The resulting field of view was a cylinder approximately 60 cm in diameter.
For macroPET [Fig. 1], the detector blocks have been remounted in a single horizontal ring of 128 blocks. Because the blocks are tapered to fit tightly together in the original 64 block rings, in the new arrangement there are gaps of approximately 7.5 mm between the front faces of adjacent blocks. The inner diameter of the single ring is 234 cm. For convenience, the blocks are mounted on eight separate aluminium base plates, each corresponding to a 45o segment of the ring. The blocks are connected in fours to the original sets of bucket electronics, with bucket controllers from the two original rings alternating around the new single ring. Overlapping of controllers is made possible by displacing alternate controllers vertically. By alternating the buckets from the original rings, the original coincidence combinations of buckets are appropriate in the new geometry, and enable imaging to be performed over a field of view approximately 125 cm in diameter. The eight rings of detector elements span an axial (vertical) field of view of 5.4 cm, which is divided into 15 image planes (8 direct planes and 7 cross planes) with a plane separation of 3.375 mm.
Initial Results from a Prototype Large (2m)
Ring PET Scanner
Fig. 1. Photograph of the macroPET scanner.
The initial results reported here were obtained by accepting data with a maximum ring difference of 3, as is generally the case in acquisition of “2D” PET data, but at present macroPET has no interplane septa and also no shielding against out of field activity. Events within the energy window from 250 keV to 850 keV were accepted. A delayed timing window was used to record the distribution of random coincidences. Data were initially recorded in histograms (prompt minus delayed events) appropriate to the image planes of the original geometry and were then rebinned into the correct sinograms for the new geometry. In this rebinning the gaps between blocks were allowed for by treating each large ring as if it consisted of 1152 (128x9) detector elements with every ninth detector absent, and interpolation was used to complete the missing sinogram elements. Arc correction of the projection data was achieved by performing a further rebinning with linear weighting. To compensate for the difference in efficiency of different detector elements, a normalisation was applied based on the response to a central uniform phantom.
Simple 2D filtered backprojection has been used to reconstruct all the images presented here, using a Hamming filter of cutoff frequency 0.4 and a 256 by 256 matrix with zoom factors from 1 to 4.
III. EXPERIMENTAL METHODS A. Spatial resolution
The transaxial spatial resolution of the system was measured using data from one or more 68-Ge line sources mounted parallel to the scanner axis. In each case, a Gaussian fit was performed on the profile across the central plane (plane 8) of the reconstructed images [Fig. 2 & 3], and the full-width at half-maximum (FWHM) was calculated as FWHM = 2
2
ln
2
σ, where σ is the standard deviation of the fitted Gaussian function. The pixel size in the reconstructed images was determined experimentally from the image obtained using two 68-Ge line sources separated by a known distance (40 cm apart). [image:2.612.368.495.48.153.2]The axial resolution of the system was measured using data from an 18-F point source positioned at the scanner centre, and fitting a Gaussian function to the profile across the 15 image planes.
Fig. 2. Reconstructed image (zoom x3) for two 68-Ge line sources (40 cm apart) used to determine the pixel size as well as the transaxial resolution.
Fig. 3. Reconstructed image profile from two 68-Ge line sources mounted 40 cm apart either side of the centre of the scanner field of view.
B. Sensitivity
The sensitivity of the scanner was determined from the count rate measured using bare sources of known activity. To avoid problems of dead-time etc, these measurements were performed using sources of relatively low activity. A 14 cm long 68-Ge line source of total activity 200 kBq was mounted along the scanner axis, so that the activity in each 3.375 mm slice was approximately 4.8 kBq, and the count rate in each image plane was determined. In another measurement, a 3 mm diameter 18-F point source with an activity of 15 MBq was mounted at the centre of the field of view, and the total count rate (all planes) was found. The sensitivity calculations were corrected for the positron branching ratios of 18-F (0.967) and 68-Ge (0.89).
The sensitivity of a PET scanner is often quoted in terms of the count rate achieved using a cylindrical phantom uniformly filled with activity. Results have been reported using cylinders of various sizes [8], [9]. For macroPET an initial value of sensitivity was obtained using a 20 cm diameter cylinder which was filled with 18-F solution.
C. Scatter Fraction (SF)
[image:2.612.327.527.233.359.2]Fig. 4 shows the profile across the resulting sinogram. The scatter fraction was then determined from this profile by estimating the number of counts within the peak.
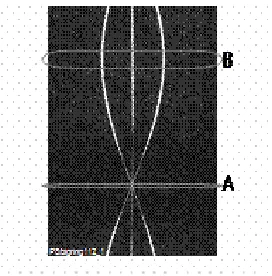
[image:3.612.81.290.222.399.2]To investigate the effect of scatter within a large animal, measurements were also performed using three 68-Ge line sources mounted inside a large rectangular water tank (64x24 cm2). The three sources were mounted vertically at intervals of 25 cm along the long axis of the tank, with the middle source at the centre of the tank. Fig. 5 shows the resulting sinogram. Values for scatter fraction were obtained by analysing the profiles at angles A (looking directly along the long axis of the water tank, with the three source in line) and B (looking along the short axis).
[image:3.612.118.254.471.609.2]Fig. 4. Profile across the sinogram measured for a 68-Ge line source at the centre of a 20 cm diameter cylinder of water.
Fig. 5. Central plane (plane 8) sinogram measured from three 68-Ge line sources inside a large (64x24 cm2) water tank.
D. Count rate performance
Count rate performance is evaluated by calculating the noise equivalent count rate (NEC). NEC is a global measure of PET scanner count rate performance and enables comparisons of count rate taking into account the statistical noise due to scatter and random events. The general formula [10], [11] to calculate the NEC rate is
kR S T
T NEC
2
+ +
=
where T, S and R are the true, scatter and random rates respectively. The parameter k is the randoms correction factor with a value of 1 or 2 depending on the randoms correction method. A value of 2 is used when randoms are measured using a delayed coincidence window as in the present work.
NEC rates are usually quoted using a 20 cm diameter cylindrical phantom with an axial length of 20 cm. For macroPET, a similar phantom was used but it was only filled to a depth of around 5 cm to avoid the effect of out-of-field activity due to the lack of any shielding on the current scanner. The phantom was filled with 1300 ml water containing an initial activity of 550 MBq of 18-F, and was then placed in the centre of the scanner. A set of 10 min scans was acquired every half hour for almost 12 hrs. Randoms were measured by applying delay in one coincidence channel. The contribution of scattered events was estimated assuming a scatter fraction of 26% (see below). The noise equivalent count rates were calculated from the NEC formula.
E. Imaging studies
The Derenzo phantom is often used for assessing the image quality in nuclear medicine images. It consists of a cylinder with perspex inserts which create cold lesions when the phantom is filled with radioactive solution. In the present work a Derenzo phantom 21.5 cm long and 22.75 cm in diameter was used, containing five perspex spheres of different sizes located in the upper section and six different sets of cylindrical rods in the lower section. The images reported here were obtained by filling only the lower half of the phantom with approximately 2.5 litres of water, and adding approximately 200 MBq of 18-F. Data were acquired for 600s per image, with the phantom mounted at the centre of the field of view and at different radial offsets. Each image was reconstructed using filtered backprojection and incorporating the calculated attenuation correction for a water-filled cylinder. Images from the uniform 20 cm diameter water-filled phantom (described above) have also been analyzed to determine uniformity.
Due to the curved nature of the PET geometry, lines of response (LORs) near the periphery of the field of view are more closely spaced than those near the centre. To avoid distortion due to this effect, the sinogram data were rebinned before reconstruction (a process referred to as “arc correction”).
IV. RESULTS AND DISCUSSION A. Spatial resolution
the effect of acollinearity of the two photons emitted in electron/positron annihilation. The mean angular deviation from collinearity is around 0.4o [12] and the resultant effect on resolution is 0.0022D, where D is the ring diameter [13]. This is expected to contribute around 5.1 mm to the FWHM of images measured using a detector ring of diameter 2.34 m. It is also possible that errors in positioning individual blocks in the large ring contribute to the poor spatial resolution.
B. Sensitivity
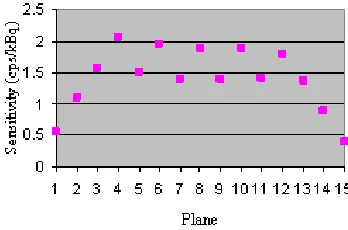
Figure 6 shows the axial sensitivity profile determined using a 68-Ge line source on the scanner axis. The profile is approximately as expected based on the number of detector rings which can contribute to each image plane, using a maximum ring difference of 3 (4 combinations in each cross plane from 4 to 12, 3 combinations in each direct plane from 3 to 13, and fewer combinations in the end planes). The overall sensitivity measured using a central 18-F point source was 2.16 cps/kBq, which is consistent with the values in Fig 6. These values are also consistent with the theoretical sensitivity expected in this geometry, assuming that the efficiency of each detector element is approximately 50%, and taking account of the gaps between detector blocks.
[image:4.612.313.519.112.249.2]The sensitivity obtained using a uniform cylindrical phantom of diameter 20 cm was approximately 900 cps kB-1 ml-1. Naturally, this is significantly lower than the equivalent sensitivity values quoted for smaller scanners.
Fig. 6. Axial sensitivity profile of the system for a 0.2 MBq 68-Ge line source positioned along the scanner axis.
C. Scatter Fraction (SF)
For the 20 cm diameter cylinder, the scatter fraction was measured as 26%. For the large water tank, values of approximately 63% and 38% were obtained along A (64 cm long) and B (24 cm wide) respectively. To reduce these values, it would be valuable to introduce septa between the detector rings.
D. Count rate performance
Fig. 7. shows the various components of the count rate, obtained using a 20 cm diameter cylindrical phantom in which the activity was approximately confined to the field of view, as a function of source activity, and also the resulting NEC rate. Although the scanner delivers coincidence rates of up to 100k cps, the NEC rate peaks at around 30 kcps due to the significant contributions of random and scattered events.
The NEC performance would be even poorer if out of field activity were present.
For comparison the peak NEC of an animal imaging PET system [14] for a monkey size phantom is 44.0 kcps with different settings.
Fig. 7. NEC rates for a 20 cm diameter phantom filled with 1300 ml water containing an initial activity 420 kBq/ml of 18-F.
F. Imaging studies
1) Images at the scanner centre
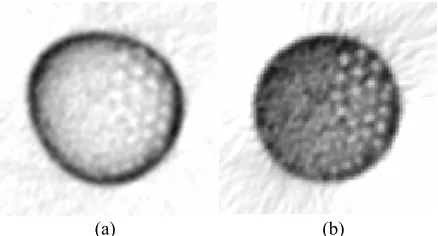
Fig. 8. shows the central plane reconstructed image from the Derenzo phantom mounted at the centre of the field of view, with and without attenuation correction. The phantom contains 6 sets of cold rods, of which the largest (14 mm diameter) rods are clearly visible, as are the second set (12 mm). The third set of rods (10 mm) is also just visible in the attenuation corrected image. This image corresponds to a total of 47M events (all 15 planes).
[image:4.612.84.258.387.502.2](a) (b)
Fig. 8. Image of the central Derenzo phantom a) without attenuation correction and b) with attenuation correction.
2) Off-axis images
[image:4.612.313.536.442.566.2]somewhat smaller number of events in this image (35M events in total, over all 15 planes), which was acquired after the activity had decayed for approximately one hour.
[image:5.612.70.289.92.210.2](a) (b)
Fig. 9. 45 cm off-axis images a) before attenuation and arc correction and b) after arc and attenuation correction.
[image:5.612.76.291.451.648.2]3) Uniform phantom images
Fig. 10. shows the plane 3 images from the 20 cm diameter uniform phantom, positioned at the centre of the field of view, imaged at two different values of specific activity: (a) 150M counts acquired in 600s, and (b) 100M counts in 600s. Also shown in each case is the horizontal profile across the image. The coefficient of variation (CV) of each image was calculated from the ratio of standard deviation (σ) to the mean pixel counts (μ) within a circular region of interest (ROI) covering the central part of the phantom in the reconstructed image. CV values of 5.9% and 5.7% were found for the two images, respectively.
Some of the other image planes show weak ring artefacts in the reconstructed images. The source of these artefacts is currently being investigated.
(a)
(b)
Fig. 10. Uniform phantom images (plane 3) and the corresponding horizontal profile across the centre of each image: a) 150M counts (CV=5.9%) and b) 100M counts (CV=5.7%).
V. CONCLUSIONS
Preliminary results have been obtained using the large ring PET scanner. The spatial resolution is around 11mm transaxially and 9 mm axially, values which can be explained at least in part by the effect of photon acollinearity. The sensitivity values obtained using bare sources are as expected. The scatter fraction for a 20cm diameter phantom is around 26%, which is somewhat higher than for a standard scanner operating in 2D mode with septa, but lower than for a standard 3D PET scan. In the same geometry the NEC rate peaks at around 30 kcps. Useful images can be obtained from the Derenzo phantom in which cold spot lesions as small as 10 mm can be detected. Image quality is reasonably consistent across a field of view of over 1.1 m diameter. Use of more sophisticated image reconstruction approaches might improve the image quality.
Most of the measurements reported here were obtained with the activity confined axially to the field of view. Out of field activity will contribute significantly to the randoms rate. Also, the scatter fraction grows dramatically as larger objects are imaged. Accordingly, development of macroPET as a practical system for large animal imaging will probably require the addition of shielding and inter-ring septa.
ACKNOWLEDGMENT
The authors would like to thank Prof John Clark for initiating this project, Dr Paul Marsden for provision of the ECAT 951 scanner, and Mr Larry Byars for extensive assistance with software. Financial support from EPSRC is also gratefully acknowledged.
REFERENCES
[1] R. Myers, S. Hume, P. Bloomfield and T. Jones. Radio-imaging in small animals. Psychopharmacol. vol. 13(4), 1999, pp. 352-357. [2] M. E. Phelps. Molecular imaging with positron emission tomography.
Annu. Rev. Nucl. Part. Sci. vol. 52, 2002, pp. 303-338.
[3] A. P. Jeavons, R. A. Chandler, C. A. R. Dettmar. A 3D HIDAC-PET camera with sub-millimetre resolutionnfor imaging small animals. IEEE Trans. Nucl. Sci. vol. 46, 1999, pp. 468-473.
[4] J. Missimer, Z. Madi, M. Honer, C. Keller, A. Schubiger and S. M. Ametamey. Performance evaluation of the 16-module quad-HIDAC small animal PET camera. Phy. Med. Biol. Vol. 49(10), 2004, pp. 2069-2081.
[5] W. W. Moses, P. R. G. Virador, S. E. Derenzo, R. H. Huesman and T. F. Budinger. IEEE Trans. Nucl. Sci. vol. 44(4), 1997, pp. 1487-1491. [6] A. Sadarmomtaz, D. J. Parker and L. G. Byars. Modification of a
medical PET scanner for PEPT studies. Nucl. Instr. and Meth. vol. A 573, 2007, pp. 91-94.
[7] R. D. Badawi, M. P. Miller, D. L. Bailey and P. K Marsden. Randoms variance reduction in 3D PET. Phys. Med. Biol. vol. 44, 1999, pp. 941–954.
[8] V. Bettinardi, M. Danna, A. Savi, M. Lecchi, I. Castiglioni, M. C. Gilardi, H. Bammer, G. Lucignani, F. Fazio. Performance evaluation of the new whole-body PET/CT scanner: Discovery ST. Eur. J. Nucl. Med. Mol. Imaging. vol. 31(6), June 2004, pp. 867-881 .
[9] T. DeGrado, T. Turkington, J. Williams, C. Stearns and J. Hoffman. Performance characteristics of a whole-body PET scanner. J. Nucl. Med. vol. 35, 1994, pp. :1398-1406.
[10] S. C. Strother, M. E. Casey and E. J. Hoffmann. Measuring PET scanner sensitivity: relating count rates to image signal-to-noise ratios using noise equivalent counts. IEEE Trans Nucl. Sci. vol. 37, 1990, pp. 783-788.
[11] G. K. V. Schulthess. Molecular Anatomiv Imaging: PET-CT and SPECT-CT integrating modality imaging, 2nd Ed, pp. 41, Lippincott
[12] S. DeBenedetti, C. E. Cowan, W. R. Konneker and H. Primakoff. On the angular distribution of two-photon annihilation radiation. Phys. Rev. vol. 77(2), January 1950, pp. 205-212.