Making the Case for Resource Efficiency in Ireland
and Options for Taking it Forward
1Policy Paper2
December 2011
1
Corresponding Author: [email protected]
2
Acknowledgements
Comhar SDC would like to gratefully acknowledge and pay recognition to those people that have contributed to this report. First of all to the Comhar Council members for their valuable feedback and input. Particular thanks also goes to Mark Keenan (Sustainability Consultant) and Cathy Maguire (European Environment Agency) both of whom provided useful information and insights at earlier stages of the project.
Eoin McLoughlin,
Research Director,
1. Introduction to Resource Efficiency
1.1 What is Resource Efficiency?
Resource efficiency is essentially about creating more value while using less resources and also selectively harnessing our renewable natural resources so that they can be provided for our economy at least cost. Or to put it another way, ‘being clever about the way we use our renewable resources and consuming less materials and goods to provide the same given output’. The United Nations Environment Programme (UNEP) defines it as “reducing the total environmental impact of the production and consumption of goods and services, from raw material extraction to final use and disposal.”
1.2 Why is it Important?
Natural resources underpin the functioning of the global economy and our quality of life. These resources include raw materials (e.g. minerals, metals, fossil fuels and biomass), environmental media (e.g. air, soil), flow resources (wind, water, geothermal, tidal and solar energy), and space (land use for human settlements, infrastructure, industry, mineral extraction, agriculture and forestry). Globally, we are extracting more resources than our planet can replenish and resource extraction often involves environmental degradation and depletion of non-renewable resources. A conflict of purposes exists because to maintain global economic growth resource extraction rates must be increased. For example, it has been estimated that a total global resource extraction of around 80 billion tonnes in 2020 (200% of the 1980 value) will be required to maintain global economic growth and the pressures on these resources are increasing with the global population expected to reach around 9 billion by 20503.
Resource efficiency represents an opportunity to address this unsustainable path and policy approaches to date have focused on decoupling GDP growth from resource use. A strong economic argument for resource efficiency is the significant potential for improved competitiveness and job creation. Eurostat figures reveal a wide resource efficiency gap between EU Member States. The EU could realise considerable environmental and competitive advantages if it systematically addressed the internal resource productivity gap4. This will help stimulate technological innovation, boost employment in the fast developing 'green technology' sector and benefit consumers through more sustainable products.
Resource efficiency can also make a significant contribution towards achieving climate change targets for reducing greenhouse gas emissions without necessarily having adverse effects on the economy5. In addition, an effective resource efficiency strategy will lead to more productive use of resources and therefore higher welfare than would otherwise be available. The synergies and alignment of sustainable consumption and production, resource efficiency, green public procurement and eco-innovation could make a significant contribution to achieving a more environmentally and economically sustainable Ireland.
3
Wuppertal Institute (2009), Eco-Innovation – putting the EU on the path to a resource and energy efficient economy.
4
European Foundation (2009), A Green New Deal for Europe - Towards green modernisation in the face of crisis Green.
5
In summary, the benefits of increasing resource efficiency include: strengthening security of resource supplies;
reducing exposure and vulnerability to rising resource prices; improving competitive position through cost reduction; realising considerable job-creation potential;
reducing overall pressure on the environment.
1.3 What are the Main Drivers?
According to a report6 by the European Environment Agency (EEA) the main drivers of resource efficiency include the following:
Economic – scarcity of resources and securing future access is an important risk to the economy. Increasing resource prices is a key policy driver, particularly in areas such as energy, water7, waste and non-renewable raw materials. An underlying driver of resource efficiency lies in producers’ tendencies to strive for improved profits and/or increased sales;
Environment – concerns over environmental degradation and the need to reduce greenhouse gas emissions;
Political – EU policy initiatives such as the Europe 2020 Strategy and Resource Efficient Flagship Initiative are becoming strong driving forces for national resource efficiency policies.
6
European Environment Agency (2005), Sustainable Use and Management of Natural Resources. 7
2. Global and European Perspectives
2.1 Resource Challenges
The European Commission8 recently presented an overview of developments in relation to global commodity markets and raw materials and the response which the EU is taking to address these challenges. In the EU, sectors including construction, chemicals, automotive, aerospace, machinery and equipment all depend on access to raw materials. Europe is increasingly reliant on imported metallic minerals and that scarcity may affect European industries, particularly the electronics industry9. The development of new eco–technologies could also be hindered by resource scarcity with global competition for these resources increasing, particularly among emerging economies.
The Commission has already identified fourteen critical raw materials at EU level (see Appendix 1). Critical raw materials are those which display a particularly high risk of supply shortage in the next ten years and which are important for the value chain. The supply risk is linked to the concentration of production in a handful of countries, and the low political-economic stability of some of the suppliers (see Appendix 2). This risk is in many cases compounded by low substitutability and low recycling rates. In many cases, a stable supply is important for climate policy objectives and for technological innovation. For example, rare earths are essential for high performance permanent magnets in wind turbines or electric vehicles but the EU is completely dependent on imports, with China accounting for 97% of world production in 2009. At the same time, no recycling or substitution processes for rare earths are currently commercially viable.
2.2 Current status of resource efficiency in the EU and globally
2.2.1. Resource productivity
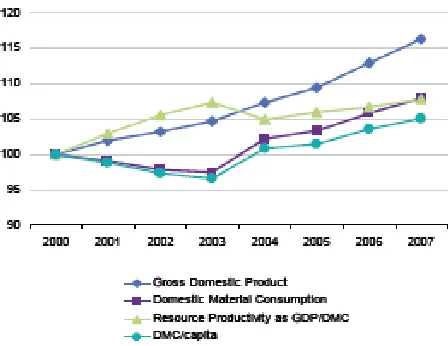
Resource productivity10 in the EU-27 rose 7% from 2000 to 2003, then decreased in 2004 but increased to slightly above the 2003 level by 2007 (Figure 1). Over the entire period 2000 to 2007 an increase of resource productivity of almost 8% was observed. While the EU-27 GDP has continuously increased during the same period, domestic material consumption (DMC) declined until 2003. When the economy grows, at the same time as DMC is decreasing, this is called ‘absolute decoupling’ of resource use from economic growth. This type of trend is observable during the period 2000 to 2003. However, from 2003 to 2007, DMC increased together with GDP at nearly the same rate (11%).
8
European Commission (2011), Tackling the Challenges in Commodity Markets and on Raw Materials.
9
Wuppertal Institute (2009), Eco-innovation – putting the EU on the path to a resource efficient and energy efficient economy.
10
Figure 1: Resource productivity for EU-27, 2000-07 (Index 2000=100)
Source: Eurostat (2011)
2.2.2. Resource use
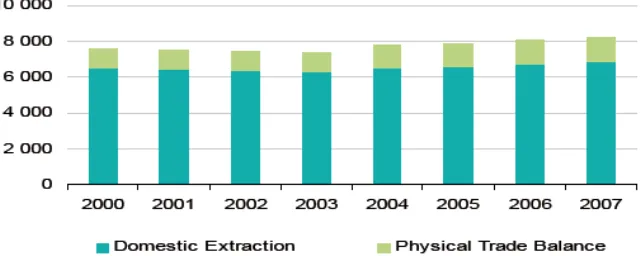
Resource use is measured as domestic material consumption (DMC). DMC is a measure of the total amount of materials directly used by an economy11. From 2000 to 2003 the DMC of the EU-27 declined slightly from 7.6 to 7.4 billion tonnes, but rose again to 8.2 billion tonnes by 2007, a 7.8 % increase from 2000 (Figure 2). Extraction of materials from nature within a country's territory, called domestic extraction, makes up the largest part of DMC, 85%, with the physical trade balance (imports less exports) accounting for roughly 15%.
From 2000 to 2003, domestic extraction decreased from 6.6 to 6.3 billion tonnes but then increased to 6.9 billion tonnes by 2007 (4.9 % higher than in 2000). In contrast, the Physical Trade Balance (PTB) rose constantly over the period 2000 to 2007 from 1.0 to 1.3 billion tonnes, an increase of 26.5%. This means that the EU-27 is a net importer from the rest of the world (net imports increased by over 25% from 2000 to 2007). Since domestic extraction accounts for such a large proportion of overall resource use, it is interesting to examine its main components.
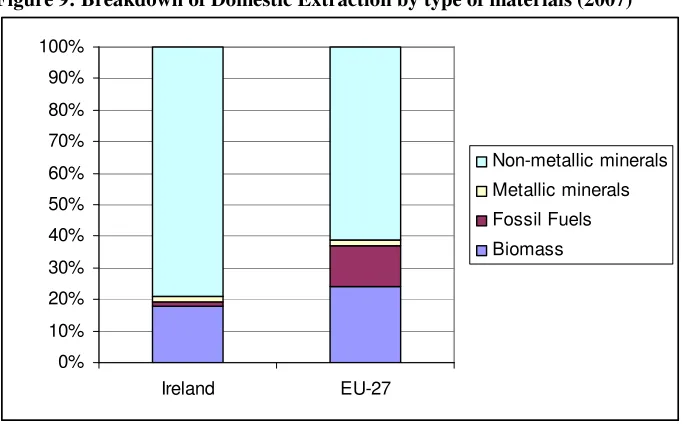
In 2007, the main materials extracted from the national territories of the EU-27 were biomass (24%) including grazed biomass and crop residues (11%), non-metallic minerals (61%), metal ores (2%), and fossil energy materials/carriers (13%). The high percentage level of non-metallic minerals reflects the importance of the construction industry and its use of extracted non-metallic minerals such as sand and gravel.
11
Figure 2: Domestic material consumption (DMC) by components, EU-27 (million tonnes)
Source: Eurostat (2011)
Figure 3: DMC and DMI (shown as the addition of its two components: domestic extraction plus imports). European countries, 2007 (tonnes per capita).
Domestic Material Consumption and Domestic Material Inputs (2007)
0 10 20 30 40 50 60 70 80 90
Switzerland Norway Turkey United Kingdom Sweden Spain Slovakia Romania Netherlands Malta Luxembourg Italy Hungary France Finland Denmark Belgium Ireland EU-27
C
o
u
n
tr
y
Tonnes per Capita Imports
Domestic Extraction Direct Material Inputs
Domestic Material Consumption
Source: Eurostat (2011)
Ten of the countries (9 EU Member States and Switzerland) had DMI’s between 6 and 20 tonnes per capita in 2007. Their share of DMI that was used for own domestic consumption (DMC) ranged from two thirds for Slovakia to 90 % for Greece. A second group of eleven EU Member States had a DMI between 20 and 30 tonnes per capita. Their share of direct material inputs used for own domestic consumption ranged from 38% for the Netherlands to 95% for Romania. Another group of seven EU Member States and Norway had a DMI higher than 30 tonnes per capita.
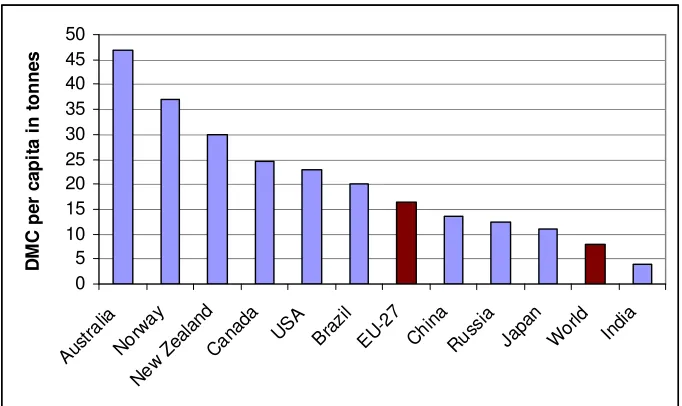
Figure 4 shows how resource use in the EU compares with other selected countries. Australia, Norway and New Zealand have the highest DMC per capita while the emerging economies of India, Russia and China are at a significantly lower level. This indicates the challenge ahead as these countries seek to reach the same level of consumption as the developed world. The EU-27 had a DMC of 16.5 tonnes per capita in 2007 while the World level was 8 tonnes per capita in 2008.
However, it is important to bear in mind when viewing these figures that DMC only accounts for material directly used in an economy. It does not include the indirect hidden flows (often termed “ecological rucksacks”) related to imports and exports of raw materials and products. As a result, declining material consumption cannot be completely attributed to efficiency gains; some improvements are likely to be a reflection of increased substitution of domestic production by imports. Once the indirect flows associated with trade are taken into account, the material requirements of a country can expand significantly. For example, Japan is one of the leading countries in terms of resource productivity and is one of only a handful of countries where the consumption of material resources has decoupled from economic growth in absolute terms. Between 1980 and 2008, Japanese material consumption decreased by over 20% while the economy expanded by 96%. However, when including unused domestic extraction and estimated indirect flows from trade, the decrease in material consumption appears more modest at -1% between 1980 and 2008 (OECD, 2011).
[image:9.612.113.454.461.664.2]Conversely, both Australia and Norway are economies based on high resource extraction with a significant amount of these materials exported abroad (i.e. oil/gas and metal ores). Two types of material flows are embodied in goods – direct flows and indirect flows. Direct flows are the materials that make up the components of a product (e.g. plastic in cell phones). Indirect flows are the flows of materials associated with the extraction and processing of the raw materials required to make a product. They include both material inputs to production (used materials) and materials that remain unused in the environment, such as mining overburden or harvest residues. These materials are not physically imported and usually remain in the producing country (OECD, 2011).
Figure 4: Use of resources per capita for select countries (2008)
0 5 10 15 20 25 30 35 40 45 50 Aus tralia Nor way New Zea land Can
ada USA Bra
zil EU-2
7 Chi na Rus sia Japa n Wor ld Indi a D M C p e r c a p it a i n t o n n e s
2.3 EU Resource Efficiency Flagship Initiative and Roadmap
The EC launched its Flagship Initiative and Roadmap on Resource Efficiency during 2011. These strategies are planned to help the EU meet a variety of key objectives, including, reducing European greenhouse gas emissions, reforming the agricultural and fisheries sectors, reducing food insecurity in developing countries, to making the Union more resilient to future rises in global energy and commodity prices.
The ‘Flagship Initiative for a Resource-Efficient Europe’ provides the long-term framework for the shift towards a resource-efficient, low-carbon economy. The strategy is the seventh and last of the Europe 2020 flagship initiatives which aim at building smart, sustainable and inclusive growth for Europe. It establishes resource efficiency as the guiding principle for a number of EU policies on areas such as energy, transport, climate change, industry, agriculture, fisheries and biodiversity.
The ‘Roadmap for a Resource Efficient Europe’ identifies the economic sectors that consume the most resources and suggests tools and indicators to help guide action in Europe and internationally. The roadmap recommends an integrated approach across many policy areas at European and Member States levels and focusing on the resources under most pressure. The instruments employed are to include legislation, market-based instruments, refocusing of funding instruments and promotion of sustainable production and consumption.
Both strategies build on and complement other initiatives such as the Roadmap for a Low-Carbon Economy, the White Paper on Transport and the Energy Roadmap (due to be published in 2011). The Resource Efficiency Roadmap also builds upon the 2005 Thematic Strategy on the Sustainable Use of Natural Resources and the EU's Sustainable Development Strategy. Furthermore, global strategies such as the OECD’s Green Growth strategy and UNEP’s work on the green economy both envisage a key role for resource efficiency as an essential component of sustainable development.
2.4 Resource-efficiency Indicators and Targets
The EC proposes in its Resource Efficiency Roadmap to engage with stakeholders with a view to developing and agreeing on indicators and potential targets for resource efficiency by the end of 2013. Two levels of indicators are proposed:
1. A provisional lead indicator - "Resource Productivity" - measured by the ratio of GDP to Domestic Material Consumption (expressed in Euro/tonne).
2. A series of complementary indicators on key natural resources such as water, land, materials and carbon, that will take account of the EU’s global consumption of these resources.
When measuring the progress of resource efficiency, some commentators have noted the importance of using an indicator which also includes all indirect hidden flows of resource consumption, such as the Total Material Consumption (TMC) indicator. This would address the issue of countries of the EU increasingly placing environmental burdens onto the countries of the south12, by importing raw materials thereby reducing the pressure on their own domestic environment and material resource reserves.
12
3. Resource Efficiency in Ireland
3.1 Current status
3.1.1. Resource productivity
[image:11.612.113.499.237.457.2]In 2007, Ireland ranked third lowest within the EU in relation to resource productivity, significantly below the EU-27 average. This indicates that Ireland is lagging behind its EU counterparts when it comes to decoupling resource use from economic growth with the Netherlands and Malta being over three times more productive in this respect.
Figure 5: Material productivity 2000 and 2007 [USD ppp/tonne DMC]
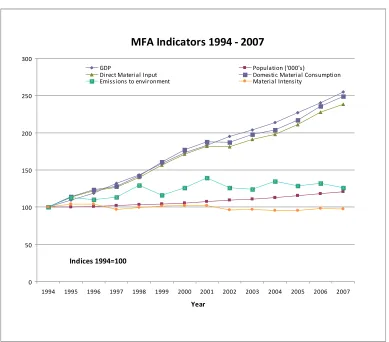
Figure 6: Material Flow Analysis Indicators for Ireland, 1994-2007 (Index 1994=100)
MFA Indicators 1994 - 2007
0 50 100 150 200 250 300
1994 1995 1996 1997 1998 1999 2000 2001 2002 2003 2004 2005 2006 2007
Year Indices 1994=100
GDP Population ('000's)
Di rect Materi al Input Domesti c Material Consumpti on
Emi ssions to environment Materi al Intensity
Source: CSO (2009)
3.1.2. Resource use
Figure 7: Use of resources per capita 2000 and 2007 [tonnes DMC/capita]
Source: Eurostat and OECD
Figure 8 shows resource use in Ireland for the period 1999-2008. DMC has fallen from 151 million tonnes in 1999 to 147 million tonnes in 2008 (2.6% decrease). However, from 1999 to 2007 DMC had increased by 54% showing the effect that the recent economic downturn has had on resource use. Domestic extraction accounts for 85% of DMC in Ireland with the physical trade balance (imports less exports) accounting for the remainder
Figure 8: Domestic Material Consumption (DMC) by category over time, Ireland (million tonnes)
0 50 100 150 200 250
1999 2000 2001 2002 2003 2004 2005 2006 2007 2008
Domestic Extraction Physical Trade Balance
Source: Adapted from Environmental Accounts Material Flow 2008 (CSO, 2010)
[image:14.612.113.454.483.695.2]Figure 9 shows the breakdown of domestic extraction for Ireland and the comparable figure for the EU-27. In 2007, the main materials extracted from the national territories of Ireland were biomass (18%), non-metallic minerals including sand and gravel (79%), metal ores (2%), and fossil energy materials/carriers (1%). From this breakdown, the importance of the construction sector in Ireland – which uses much of the sand, gravel and other non-metallic minerals to construct houses, other buildings, roads and bridges – can be seen. However, it is worth noting that the recent sharp decline in activity in this sector is evident in the most recent figures with domestic extraction of non-metallic minerals falling from 162.1 million tonnes in 2007 to 80 million tonnes in 2008 (51% decrease). The extent and sharpness of this decline is such that the 2008 level is lower than that for 1999 whereas the 2007 figure was the highest recorded over the 10 year period (1999-2008).
Figure 9: Breakdown of Domestic Extraction by type of materials (2007)
0% 10% 20% 30% 40% 50% 60% 70% 80% 90% 100%
Ireland EU-27
Non-metallic minerals
Metallic minerals
Fossil Fuels
Biomass
3.2 National policy initiatives and programmes13
3.2.1 National Strategies
3.2.1.1 National Waste Prevention Programme
The Government’s National Waste Prevention Programme (NWPP) was launched in April 2004 and is led by the Environmental Protection Agency (EPA). The aim of the NWPP is to explore practical ways to minimise and prevent waste, so as to break the link between economic growth and the environmental impacts associated with resource inefficiency. The programme sets out to deliver substantive results on waste prevention and resource efficiency and integrate a range of initiatives addressing awareness-raising, technical and financial assistance, training and incentive mechanisms.
3.2.1.2 National Hazardous Waste Management Plan
In 2008, the EPA published a National Hazardous Waste Management Plan 2008-2012. The Plan describes the national system for hazardous waste management and identifies gaps and recommends actions to ensure all hazardous waste is collected and managed appropriately and in a manner that does not cause environmental pollution. A range of specific projects are underway in relation to implementation of the Plan. Each project contributes to resource efficiency and waste prevention by managing and avoiding the use and dispersion of hazardous materials.
3.2.1.3 National Sustainable Development Strategy
The first National Sustainable Development Strategy was published in 1997 and led to progress in the development and implementation of policies and action across most sectors. However, key challenges remain across policy areas, governance, implementation mechanisms and measuring and communicating progress. A new Framework for Sustainable Development in Ireland (FSDI) is under preparation and will seek to identify areas where further effort is required and will put forward practical measures aimed at achieving added value in key sectors. It also intends to set out proposals for the effective implementation of the Framework and proposes the development of a sustainable development indicator set which will measure progress in this area. The FSDI will serve as a key national policy driver to ensure that sustainable development concerns are taken into account and acts as an important input to policy formulation.
3.2.1.4 National Action Plan on Green Public Procurement
The annual procurement budget of the Irish public sector is of the order of €15 billion. If buyers in the public sector consistently took environmental factors into account in their procurement decisions, it would provide huge leverage to “move the market” towards providing environmentally superior goods, services and works in a cost-effective way. This would enable Government and the wider public sector to continuously improve the environmental performance of their procurement activities, leading over time to significant
13
benefits to the environment and to public health. It would also boost Ireland’s competitiveness and job-creation by fostering eco-innovation among SMEs and the wider business community. The forthcoming Action Plan on Green Public Procurement, Green Tenders, will act as a key driver in developing the green economy in Ireland.
3.2.1.5 National Climate Change Strategy
The National Climate Change Strategy 2007 - 2012 sets out the Irish Government’s plans to tackle climate change and details the measures that are in place to enable Ireland to meet its commitments under the Kyoto Protocol in the period 2008-2012. It also brings together a non-exhaustive range of actions being examined to reduce Ireland's greenhouse gas emissions further across the energy, transport, industrial, agriculture, forestry and built environment sectors, in the period beyond that covered by the Kyoto Protocol, with a focus on 2020.
3.2.1.6 National Energy Efficiency Action Plan
The National Energy Efficiency Action Plan 2009 - 2020 sets out Government plans and actions to achieve its target of 20% energy efficiency savings across the economy in 2020. The Government has committed to achieving, in 2020, a 20% reduction in energy demand across the whole of the economy through energy efficiency measures. Recognising that Government must lead by example, the plan commits to achieving a 33% reduction in public sector energy use.
3.2.1.7 The Green economy
The development of the green economy in Ireland can make an important contribution to creating employment and export opportunities in green enterprises and assist existing companies in all sectors to improve their competitive position through adopting innovative environmental goods and services. The report14 by the High-Level Action Group on Green Enterprise put forward a number of recommendations for development of the sector, including the following strategic actions which may assist Ireland in achieving resource efficiency objectives:
Promote renewable energy, efficient energy use and management (including eco-construction), waste management, recovery and recycling: water and wastewater treatment;
Deliver green zones and a green IFSC for green investment vehicles and the administration of funds managed under green principles, carbon trading and associated professional services;
Create world-class research centres in niche green areas;
Remove basic hurdles to the development of the green economy including technical, regulatory and planning barriers that are delaying the development of renewable energy projects;
Implement green public procurement;
Provide reduced interest rate loans to companies investing in producing environmentally friendly products;
Develop Ireland’s ‘Green Island’ brand;
The development agencies should work to offer an integrated suite of efficiency programmes encompassing energy, water and waste.
14
3.2.2 National Initiatives
3.2.2.1 EPA schemes
Cleaner Greener Production Programme
The EPA launched the Cleaner Greener Production Programme (CGPP) in 2001 as a grant scheme to encourage Irish organisations to implement cleaner greener practices. The programme targets resource efficiency among Irish businesses and organisations and is now supported by the NWPP. Since 2001 the EPA has committed over €7 million to 89 organisations that have received part funding for demonstration projects under this programme. Companies commit to developing demonstration projects that reduce their environmental impact and are applicable across the business sector. Environmental performance is fast becoming a marketing tool and there is an increasing demand for environmentally sound products and services both in the EU and across international markets.
STRIVE
The EPA research programme for the period 2007-2013 is entitled Science, Technology, Research and Innovation for the Environment (STRIVE). The aim of STRIVE is to protect and improve the natural environment by addressing key environmental management issues through the provision of scientific knowledge generated through a programme of research. The Strive report ‘Innovation for a Green Economy’ describes practical outcomes in the areas of environmental technologies and innovation from the investment made to date through the STRIVE programme.
StopFoodWaste
The EPA initiated the StopFoodWaste programme in June 2009 to promote food waste prevention and home composting in support of existing policy measures. The initial focus of the programme has been on the householder and is designed to empower consumers to reduce food waste by rethinking how they should shop, store, cook and re-use food and on how to compost any food waste that cannot be prevented.
3.2.2.2 Additional initiatives
SMILE Resource Exchange
SMILE Resource Exchange supports the development of mutually beneficial partnerships between businesses. The SMILE network aims to save businesses money by developing a network of businesses that reuse each other’s surplus products, by-products and reusable items and share services, space and logistics. The concept is not limited to reusable items, by-products or surplus but can also be applied to logistics, services or skill share. Examples of items and products which may be on offer are plastics, timber, cardboard, paper, pallets, warehouse or office space, etc. The ambition is that these partnerships result in cost savings for businesses and more environmentally friendly practices, in particular the diversion of waste from landfill.
Market Development Programme for Waste Resources (rX3)
Green Business Initiative
The Green Business Initiative is aimed primarily at the business community in Ireland, with an emphasis on small and medium sized enterprises (SMEs). It provides tools and methodologies to help organisations to make financial savings by looking at their resource use, particularly in relation to waste and water, and also to help the environment.
Green Hospitality Award
The Green Hospitality Award is a programme that has already generated in excess of €3 million in saving for 190 participating hotels, by providing an Environmental Management System based award scheme, support and training, benchmarking tools and audits. Over 80 hotels have gained awards.
Packaging Waste Prevention Programme
The Packaging Waste Prevention Programme aims to assist Irish businesses with positive and practical ways to reduce packaging and to promote those achievements to a wider audience. The NWPP is working closely with industrial and employer representative bodies to progress the resource efficiency agenda and programmes.
Green Retail programme
The Green Retail programme aims to assist Irish retail outlets (particularly grocery) to operate in a resource efficient way.
Green schools/green home
The Green Schools programme, co-ordinated by An Taisce in partnership with Local Authorities, involves 66% of all Irish schools of which 1,150 have been awarded the coveted Green Flag. The programme encourages students to become more aware of the environment and aims to reduce waste in schools as much as possible. A pilot initiative called Green Home is now being funded by the NWPP to build on this success and spread prevention to houses and communities. In 2010, there were approximately 10,000 householders linked to the programme and, with an average household size of 2.81 persons, this represents an estimated outreach to over 28,000 people.
Local authority Prevention network
The Local Authority Prevention Network (LAPN) is a key component in continuing to build capacity in local authorities for the promotion of resource efficiency and waste prevention at a local and grassroots level for the benefit of their localities. Over the last 4 years, the programme has demonstrated that implementing waste prevention and resource efficiencies in an organisation can lead to significant savings, in addition to the obvious environmental benefits. Developed under the NWPP, through LAPN the EPA provides assistance and support to local authorities in Ireland. Research identified that the two principal barriers to implementing waste prevention in the local authority sector have been a lack of resources and a lack of expertise and expert support. By removing these barriers the programme enables local authorities to actively pursue resource efficiency programmes in partnership with businesses, public organisations and communities in their functional areas.
Table 1: Resource Efficiency Support Tools for Business
Support Nature of Service
Large Industry Energy Network Energy Efficiency Fund
Energy Management (Tools and Resources) Accelerated Capital Allowances & Triple E
S
E
A
I
Advice, Mentoring and Assessment
Energy Management, Energy Efficiency, Energy Alternatives
Cleaner Greener Production Programme Clean Technology
Green Business Eco-Efficiency*
Green Hospitality Award Scheme Eco-Efficiency* Local Authority Prevention Network Eco-Efficiency*
E
P
A
Green Retail Eco-Efficiency*
Research Development & Innovation Support Clean Technology
Green Offer
Clean Technology, Environmental Management Systems,
Eco-labelling, Carbon Management
E
I
EnviroCentre.ie Information/Advice
Research Development & Innovation Support Capital & Training Grant
ID
A
Clean Tech Support
Clean Technology & Eco-Efficiency*
Source: Adapted from EPA and other agencies (2011).
3.3 Analytical support tools in Ireland
3.3.1 Material Flow Analysis
Economy-wide Material Flow Analysis (MFA) provides an aggregate overview of annual material inputs and outputs of an economy15. In contrast to Gross Domestic Product (GDP), which measures production and consumption market activities in monetary terms, the MFA measures these activities in physical terms (tonnes). MFA has been developed in Ireland through a number of projects including the following:
A demonstration MFA for Ireland by the Clean Technology Centre for the data year 2000 published in 2006;
An economy-wide MFA and indicator set for Ireland by EnviroCentre, Best Foot Forward and the University of Limerick for 2003 published in 2008;
The Central Statistics Office have produced a series of MFA for Ireland from 1994-2008;
15
The Economic and Social Research Institute has created environmental accounts for waste, water and emissions to air from 1990-2005;
Comhar Sustainable Development Council has published recommendations on a Sustainable Development Indicator set for Ireland which includes the set of MFA derived indicators16 to inform national policy and actions on resource use and sustainable development.
3.3.2 Environmental accounts for Ireland
Environmental accounts provide information on emissions and resource use. Environmental accounts are so-called satellite accounts to the national accounts, which provide a comprehensive framework to present economic data in a coherent, consistent and internationally comparable manner. Environmental accounts are specifically designed to reveal the pressure the economy puts on the environment.
Both the CSO and ESRI have produced a set of Environmental Accounts for Ireland covering the period 1990-2006. The aim of the present accounts is to outline the potential impact on the environment of economic and social activity in Ireland. The idea is to list in quantifiable terms the amount of potential air pollutants produced by industry and households, which may in turn be compared to the employment and the value of output produced by these sectors. There is potential for the accounts to be extended to include more emissions and more resources. According to an EPA report17 candidates for extensions include material flows, land use, water use and emissions to water, and emissions covered by IPPC licensing and the annual environmental reports.
3.3.3 Ireland’s Sustainable Development Model (ISUS)
ISUS is a model that creates environmental account projections based on policy options. The model projects the environmental accounts into the future based on assumptions about developments in the economy, technology and in policy. Thus the model can also be used to test the implications of alternative policy proposals as well as the effects of past policy interventions. The model can be utilised to move between production accounts and consumption accounts. Proposed resource efficiency policy measures for Ireland could therefore be modelled using ISUS.
16
See also MAGUIRE, C. & CURRY, R. (2007), Measuring Ireland‘s Sustainability. The integration of environmental data in macroeconomic models. Comhar Sustainable Development Council Working Paper, Dublin.
17
4. Developing Resource Efficiency
4.1 Aligning resource efficiency with sustainable production and consumption
Increasing resource efficiency involves both supply-side and demand-side systems. It requires looking at the economy via three different perspectives18. These include:
1. Production - what sectors have the highest impacts? This helps specify where clean and efficient technologies are most needed.
2. Consumption - what products and consumption clusters have the highest life cycle impacts? This helps identify where low impact products and sustainable life styles can most reduce impacts.
3. Resources - what materials have the highest impacts? This is relevant for material choices and sustainability policies on resources.
Following the identification of key sectors and products, barriers relating to the development of resource efficiency in these areas need to be addressed. Typical barriers that have been highlighted include19:
Inadequate/unstable market signals – needed to shift behaviour and price externalities; Lack of information/awareness (on alternative options and economic benefits); Lack of targets and indicators at EU/national level;
Existence of skills gaps in the workforce; Lack of funds and long pay-back periods;
Lack of a coherent policy framework and supportive regulation.
4.2 Policy instruments for addressing resource efficiency
Once the key target areas for resource efficiency have been identified, there exist a range of policy instruments that have demonstrated success in increasing resource efficiency and promoting sustainable consumption and production patterns20. These instruments can be categorised as follows:
Regulatory Instruments - includes laws and directives;
Economic Instruments - includes environmental taxes, fees and user-charges, certificate trading, environmental financing, green public procurement, and subsidies;
Research & Educational Instruments - includes research and development, and education and training;
18
UNEP (2010), Assessing the Environmental Impacts of Consumption and Production: Priority Products and materials.
19
Many of these barriers were identified in the EC’s Staff Working paper on the Roadmap to a Resource Efficient Europe (2011).
20
Co-operation Instruments - including technology transfer and voluntary agreements; Informational Instruments - including eco-labelling, sustainability reporting (such as
the Global Reporting Initiative), information centres, consumer advice services, environmental quality targets and environmental monitoring.
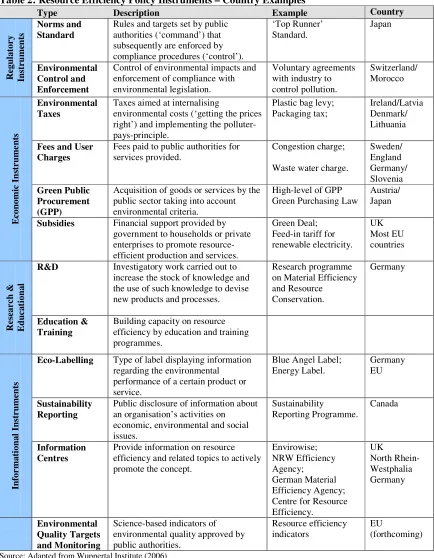
Table 2: Resource Efficiency Policy Instruments – Country Examples
Type Description Example Country
Norms and Standard
Rules and targets set by public authorities (‘command’) that subsequently are enforced by compliance procedures (‘control’).
‘Top Runner’ Standard. Japan R eg u la to ry In st ru m en ts Environmental Control and Enforcement
Control of environmental impacts and enforcement of compliance with environmental legislation.
Voluntary agreements with industry to control pollution.
Switzerland/ Morocco
Environmental Taxes
Taxes aimed at internalising
environmental costs (‘getting the prices right’) and implementing the polluter-pays-principle.
Plastic bag levy; Packaging tax;
Ireland/Latvia Denmark/ Lithuania
Fees and User Charges
Fees paid to public authorities for services provided.
Congestion charge;
Waste water charge.
Sweden/ England Germany/ Slovenia Green Public Procurement (GPP)
Acquisition of goods or services by the public sector taking into account environmental criteria.
High-level of GPP Green Purchasing Law
Austria/ Japan E co n o m ic I n st ru m e n ts
Subsidies Financial support provided by government to households or private enterprises to promote resource-efficient production and services.
Green Deal; Feed-in tariff for renewable electricity.
UK Most EU countries
R&D Investigatory work carried out to increase the stock of knowledge and the use of such knowledge to devise new products and processes.
Research programme on Material Efficiency and Resource Conservation. Germany R es ea rc h & E d u c a ti o n a l Education & Training
Building capacity on resource efficiency by education and training programmes.
Eco-Labelling Type of label displaying information regarding the environmental performance of a certain product or service.
Blue Angel Label; Energy Label.
Germany EU
Sustainability Reporting
Public disclosure of information about an organisation’s activities on economic, environmental and social issues. Sustainability Reporting Programme. Canada In fo r m a ti o n a l In st ru m en ts Information Centres
Provide information on resource efficiency and related topics to actively promote the concept.
Envirowise; NRW Efficiency Agency; German Material Efficiency Agency; Centre for Resource Efficiency. UK North Rhein-Westphalia Germany Environmental Quality Targets and Monitoring
Science-based indicators of environmental quality approved by public authorities.
Resource efficiency indicators
EU
(forthcoming)
Japan Top Runner Programme
Japan created the Top Runner programme in 1998 as part of the New Energy Conservation Law for improving energy efficiency in energy-using products. An overall policy framework for targeting 21 product groups in the residential, commercial and transport sectors is set. Each product category is then further divided into several sub-groups, and an energy efficiency target for each sub-group is set. Targeted industries are the car industry (automobiles are classified according to weight), the household and office appliance industry (for example, photocopy machines are classified according to the number of sheets copied per minute) and the ICT industry.
Instead of setting a minimum energy performance standard, the current highest energy efficiency rate of the products in each sub-group is taken as a standard (the “Top Runner”). This standard represents the target value of energy efficiency within the sub-group that has to be reached within a certain time frame. By means of the Energy Conservation Law all manufacturers and importers are obliged to achieve the respective target by a specified year. There is a broad agreement among Japanese stakeholders that the Top Runner programme has been effective. The energy efficiency of videotape recorders improved by 73.6 per cent between 1997 and 2003 (expected 58.7 per cent). Personal computers achieved their Top Runner standard well before the target year 2002.
Biofuels Production
The combination of energy (increasing oil prices and security of supply concerns) and environmental (rising greenhouse emissions from the transport sector) policies provided significant impetus to the biofuels industry. In the period 2000–2008, total world production of the two main liquid biofuels – ethanol and biodiesel – expanded at an average growth rate of 20 per cent per annum. These production increases were driven by, in some cases, generous subsidies and the requirement in many countries to meet set national targets.
However, the environmental benefits of biofuels depend greatly on where they are produced and what feedstock is used. The EU has attempted to address this issue by introducing strict sustainability criteria for biofuels that must be met. These criteria are related to greenhouse gas savings, land with high biodiversity value, land with high carbon stock and agro-environmental practices.
4.3 The role of eco-innovation
Eco-innovation is defined as “the creation of novel and competitively priced goods, processes, systems, services and procedures designed to satisfy human needs and provide a better quality of life for everyone with a whole-life-cycle minimal use of natural resources, per unit output and a minimal release of toxic substances”21. Eco-innovation means not only focusing on technological innovations but also on the human element of eco-innovation, such as those involving behavioural and lifestyle change.
Global pressure to increase resource efficiency, and the efforts to improve sustainability could become a significant source of innovation and an important asset for industry’s competitiveness22. For example, it has been calculated that the world market for eco-innovation is likely to double by 2020 (market volume estimated at €3,100 billion) and the market for material and resource efficiency is likely to triple by 202023.
Eco-innovation has the potential to achieve savings on material costs and provide alternative options for scarce resources. Housing, food and drink and mobility (transportation) have been highlighted by the European Commission as sectors that have the highest environmental impact through their full life-cycle and developing eco-innovation in each of these areas is of particular relevance. Environmental innovations address a double externality since improved environmental quality serves as a public good and an enhanced environmental quality does not accrue only to the benefit of the innovator.
[image:25.612.108.506.394.655.2]Eco-innovation can be sub-divided into three categories: pollution management, resource management, and cleaner technologies and products24. Each of these three groups consist of a number of sub-sectors which are outlined in Table 3 below.
Table 3: Eco-innovation Sub-sectors
Pollution Management Resource Management Cleaner Technologies and
Products
Air Pollution Control Waste Water Treatment Waste Management Remediation and Clean up
of Soil & Groundwater Noise and Vibration
Control
Environmental Monitoring & Instrumentation
Environmental Research & Development Public Environmental Administration Private Environmental Management Water Supply Recycled Materials Nature Protection
Indoor air pollution control Renewable energy plant Heat/energy saving and
management
Sustainable agriculture and fisheries
Sustainable forestry Natural risk management Eco-tourism Cleaner/resource-efficient technologies and processes Cleaner/resource-efficient products 21
Reid and Miedzinski (2008). 22
EC COMMUNICATION (2008). 23
Wuppertal Institute (2009), Eco-innovation – putting the EU on the path to a resource efficient and energy efficient economy.
24
5. Key Conclusions and Options
5.1 Introduction
The de-coupling of GDP growth and economic activity from unsustainable resource-use is an important step in ensuring a resource-efficient future. Absolute decoupling of economic growth and resource use has not been achieved in Ireland nor across the EU and significant measures beyond ‘business as usual’ are required if the stated policy goals in this area are to be achieved. It is generally accepted that there are physical limits to continuing economic growth based on resource use due to the pressures this places on the environment25.
The main findings from this research paper show that:
Resource use (domestic material consumption) increased dramatically in Ireland over the period 1999-2007 with no evidence of absolute decoupling taking place. However, the figures for 2008 show a sharp decline in resource use as a direct result of the economic contraction (37% decrease in DMC compared to 2007 level);
Domestic extraction accounted for over 85% of resource use during this same period with a high-level of non-metallic minerals compared to the EU average. This reflected the dominance of the construction sector in the Irish economy;
In 2007 Ireland used the most resources per inhabitant in the EU at 53 tonnes DMC per capita, more than three times the EU average;
Although resource productivity increased slightly in Ireland over the period 1999-2007, it still remains significantly below the EU average;
Ireland is a net importer of resources from the rest of the world. Fossil fuels are the main component of imports accounting for 45% of the total.
5.2 Future Options
As discussed in the previous section, there are a number of different approaches which can be taken to improve resource efficiency in Ireland. These may include a combination of targeted regulation, economic instruments, research and educational initiatives and information tools. The development of an efficient, harmonised and target-oriented policy mix is critical to addressing the current barriers affecting the progress of resource efficiency in Ireland.
Regulation
Resource efficiency should be embedded into the policies and processes throughout the public sector with the Government working to ensure the effective implementation of the EU’s resource efficiency initiative in Ireland;
The compartmentalisation of policies, although understandable, can prove to be an obstacle to the implementation of resource efficiency which needs to address many different actors, sectors and materials. A coherent framework of action and policy coordination would help to achieve further progress in this area;
25
The development of sustainable energy systems - improving energy performance of buildings, industrial processes and market penetration of energy-efficient appliances – should continue to be progressed. Implementation of smart metering systems and a more flexible energy grid to facilitate distributed renewable energy systems can also make positive contributions to improving resource efficiency;
It is important that imported products comply with EU directives and eco-labelling criteria. More and more of the resources that we use are attached to imported products. Consequently, a growing share of the impacts we cause by consuming these resources occur in other countries;
Setting national targets on resource efficiency can be an important driver for policy development26. Ireland should support and engage constructively with the European Commission in the development of such targets.
Economic instruments
It is fundamental to ‘get the prices right’ through internalising environmental costs and implementing the polluter-pays principle. This can be addressed through the extension of environmental taxes to other activities and through the introduction of user charges in areas such as water. Such price incentives will need to take into account issues of equity and competitiveness concerns in their final design;
The implementation of Green Public Procurement on a significant scale and the application of a reduced rate of VAT on all low impact products and services would help support and drive resource efficiency and eco-innovation activity in Ireland.
Research and educational initiatives
Research and development support should be oriented towards producing resource-efficient solutions and the development of resource-resource-efficient products and services; Behavioural change can be promoted by education. Through education, societies can
become much more aware than at present of the fundamental role of the environment and its resources in underpinning economic activity and human welfare;
Industry training networks should be supported where appropriate in order to deliver the required courses and skill sets needed for a resource efficient and low-carbon economy.
Information tools
Consideration should be given to establishing a forum and network for resource efficiency and eco-innovation in Ireland in order to share best practice;
Co-operation between policymakers, statistical offices and research institutes responsible for producing resource efficiency indicators should be prioritised. In particular, the
26
development of pricing indicators showing the extent to which the use of resources is correctly priced to reflect external costs would make a valuable contribution to the area; The relevant agencies (e.g. IDA, EI, SEAI, and EPA) should continue to work to offer an
References
Central Statistics Office (2010). Environmental Accounts Material Flow 2008. Available at:
http://www.cso.ie/en/media/csoie/releasespublications/documents/environment/2008/material _flow_accounts08.pdf
Central Statistics Office (2009).Economy-wide Material Flow Accounts for Ireland, 1994-2007. Available at:
http://www.cso.ie/en/media/csoie/releasespublications/documents/environment/2007/material _flow_accounts9407.pdf
Central Statistics Office (2007). Environmental Accounts for Ireland 1997-2005. Available at:
http://www.cso.ie/en/media/csoie/releasespublications/documents/economy/enviracc1997-2005.pdf
Environmental Protection Agency and other Agencies (2011). Developing a Green Enterprise - A guide, for businesses and institutions on supports available in Ireland for developing resource efficient practices. Available at:
http://www.epa.ie/downloads/pubs/other/corporate/Developing%20a%20Green%20Enterprise %20Navigator.pdf
EPA STRIVE Programme 2007–2013 Ireland’s Sustainable Development Model
(2006-SDM-LS-11-M2) Report available for download on http://erc.epa.ie/safer/reports Seán Lyons and Richard S.J. Tol.
European Commission (2011). EC Communication on Resource Efficiency Flagship Initiative. Available at:
http://ec.europa.eu/resource-efficient-europe/pdf/resource_efficient_europe_en.pdf
European Commission (2011). EC Communication on Roadmap to a Resource Efficient Europe. Available at:
http://ec.europa.eu/environment/resource_efficiency/pdf/com2011_571.pdf
European Commision (2011). Tackling the Challenges in Commodity Markets and on Raw Materials. Available at:
http://ec.europa.eu/enterprise/policies/raw-materials/files/docs/communication_en.pdf
European Commission (2011). Staff Working paper (part 2) on the Roadmap to a Resource Efficient Europe. Available at:
http://ec.europa.eu/environment/resource_efficiency/pdf/working_paper_part2.pdf
European Commission (2008). EC COMMUNICATION on the Sustainable Consumption and Production and Sustainable Industrial Policy Action Plan. Available at:
http://ec.europa.eu/environment/eussd/pdf/com_2008_397.pdf
European Environment Agency (2011). 2011 Survey of resource efficiency policies in EEA member and cooperating countries – Country profile: Ireland. Available at:
http://www.eea.europa.eu/themes/economy/resource-efficiency/ireland-2014-resource-efficiency-policies
European Environment Agency (2005). Sustainable Use and Management of Natural Resources. Available at:
European Foundation (2009). A Green New Deal for Europe’ Towards green modernization in the face of crisis Green. Available at:
http://www.gef.eu/fileadmin/user_upload/GEF_GND_for_Europe_publication_web.pdf
Eurostat (2011). Statistics in Focus. Available at:
http://epp.eurostat.ec.europa.eu/cache/ITY_OFFPUB/KS-SF-11-009/EN/KS-SF-11-009-EN.PDF
Eurostat (2009). Economy Wide Material Flow Accounts: Compilation Guidelines for reporting to the 2009 Eurostat questionnaire. Available at:
http://epp.eurostat.ec.europa.eu/portal/page/portal/environmental_accounts/documents/Euro stat%20MFA%20compilation%20guide%20for%202009%20reporting.pdf
Forfás (2009). Developing the Green Economy in Ireland. Available at:
http://www.forfas.ie/media/dete091202_green_economy.pdf
MAGUIRE, C. & CURRY, R. (2007). Measuring Ireland‘s Sustainability. The integration of environmental data in macroeconomic models. Comhar Sustainable Development Council Working Paper, Dublin.
OECD (2011). Resource Productivity in the G8 and the OECD. Available at:
http://www.oecd.org/dataoecd/18/20/47944428.pdf
Reid and Miedzinski (2008). Eco-innovation – Final Report for Sectoral Innovation Watch.
Available at: http://www.technopolis-group.com/resources/downloads/661_report_final.pdf
UK Sustainable Development Commission (2009). Prosperity Without Growth? Available at:
http://www.sd-commission.org.uk/data/files/publications/prosperity_without_growth_report.pdf
UNEP (2010). Assessing the Environmental Impacts of Consumption and Production: Priority Products and materials. Available at:
http://www.unep.org/civil-society/Portals/59/Documents/SCP-Assessment-of-Env-Impact-of-SCP.pdf
WRAP (2009). Meeting the UK climate change challenge: The contribution of resource efficiency. Available at
http://www.wrap.org.uk/wrap_corporate/annual_conference/resource_efficiency.html
Wuppertal Institute (2009). Eco-Innovation – putting the EU on the path to a resource and energy efficient economy. Available at:
http://www.europarl.europa.eu/document/activities/cont/201109/20110906ATT25985/201109 06ATT25985EN.pdf
Wuppertal Institute (2006). Policy Instruments for Resource Efficiency Towards Sustainable Consumption and Production. Available at:
http://www.uns.ethz.ch/edu/teach/bachelor/energmob/GTZ_et_al_2006_policy-instruments_resource_efficiency.pdf
Wuppertal Institute (2004). Globalisation and the shifting environmental burden – Material trade flows of the European Union. Available at:
Glossary of Terms
Decoupling refers to breaking the link between ‘environmental bads’ and ‘economic goods’. The measurement of decoupling refers to the relative growth rates of a direct pressure on the environment and of an economically relevant variable to which it is causally linked. Decoupling occurs when the growth rate of the environmental pressure (EP) is less than that of its economic driving force (DF) over a given period. One distinguishes between ‘absolute’ and ‘relative’ decoupling. Decoupling is said to be absolute when the environmental variable is stable or decreasing while the economic variable is growing. Decoupling is said to be relative when environmental variable is increasing, but at a lower rate than the economic variable.
Domestic extraction (used) is the input from the natural environment to be used in the economy. This is the annual amount of raw material (except for water and air) extracted from the natural environment.
Domestic Material Consumption (DMC) is defined as the total amount of material directly used in an economy. DMC does not include indirect hidden flows related to imports and exports of raw materials and products.
DMC = Domestic extraction + Imports – Exports
Domestic Material Inputs (DMI) is not additive across countries. For example, to calculate EU totals for DMI the intra-EU foreign trade flows must be subtracted from the DMIs of Member States. Theoretically, the exports from country A to country B should equal the imports to country B from country A and can be netted out. The quality of the intra-EU trade data does not easily allow for the netting out of these flows so aggregated EU DMI calculations have not been made at this time.
DMI = Domestic extraction + Imports
Material flow analysis (MFA) refers to the monitoring and analysis of physical flows of materials into, through and out of a given system (usually the economy) through the process chains, through extraction, production, use, recycling and final disposal. MFA is generally based on methodically organised accounts in physical units (Material flow accounts). It helps identify waste of natural resources and materials in the economy which would otherwise go unnoticed in conventional economic monitoring systems.
Physical Trade Balance (PTB) is calculated by taking the amount of imports in physical units minus exports in physical units. Relationships between the different concepts:
PTB = Imports – Exports
Resource productivity is calculated by the ratio between gross domestic product (GDP) and domestic material consumption (DMC).
Total Material Consumption (TMC) measures the total mass (weight) of materials that are associated to the (apparent) material consumption of the domestic economic system, whatever their origin is (domestic, rest of the world).
Appendix 1: Concentration of Production of Critical Raw Materials
Raw Materials Main producers (2008, 2009)Main sources of imports into EU (2007 or 2006)
Import dependency rate
Substitutability Recycling rate
Antimony China 91% Bolivia 77% China 15%
100% 0,64 11%
Beryllium USA 85% China 14%
USA, Canada, China, Brazil (*)
100%
Cobalt DRC 41% Canada 11%
DRC 71% Russia 19%
100% 0,9 16%
Fluorspar China 59% Mexico 18%
China 27% Mexico 24%
69% 0,9 0%
Gallium N/A USA, Russia (*) (*) 0,74 0%
Germanium China 72% China 72% USA 19%
100% 0,8 0%
Graphite China 72% India 13%
China 75% 95% 0,5 0%
Indium China 58% Japan 11%
China 81% 100% 0,9 0.30%
Magnesium China 56% Turkey 12%
China 82% 100% 0,82 14%
Niobium Brazil 92% Brazil 84% Canada 16%
100% 0,7 11%
Platinum group metals South Africa 79% Russia 11%
South Africa 60% Russia 32%
100% 0,75 35%
Rare earths China 97% China 90% 100% 0,87 1%
Tantalum Australia 48% Brazil 16%
China 46% Japan 40%
100% 0,4 4%
Tungsten China 78% Russia 76% 73% 0,77 37%
Source: EC (2011)

![Figure 5: Material productivity 2000 and 2007 [USD ppp/tonne DMC]](https://thumb-us.123doks.com/thumbv2/123dok_us/1385542.672771/11.612.113.499.237.457/figure-material-productivity-usd-ppp-tonne-dmc.webp)
![Figure 7: Use of resources per capita 2000 and 2007 [tonnes DMC/capita]](https://thumb-us.123doks.com/thumbv2/123dok_us/1385542.672771/13.612.112.497.102.317/figure-use-resources-capita-tonnes-dmc-capita.webp)