Numerical Study of Sand Ingestion
Through a Ventilating System
Adel. Ghenaiet
Abstract—Turbomachinery components often operate in dusty environments, such as in desert regions. Operating under such particulate airflow condition usually leads to erosion damage of blades resulting in degradations of their aerodynamic performance. The present paper presents a numerical study of sand particle trajectories and erosion through an axial cooling turbomachinery. The Lagrangian approach for particle tracking as implemented in the present trajectory code is considering the effects of turbulence and complex flow features near walls on solid particles, random particle rebound and random size distribution. The governing equations of particle motion entrained by the airflow are solved in a stepwise manner separately from the flow field, whereas, particle tracking and impacts are predicted in different cells of the computational domain based on the finite element method. A semi empirical erosion correlation is used to predict erosion areas based on impacts information. The results of the numerical simulations obtained for different positions of rotor blade have revealed that the main impacted areas are found over the blade leading edge corner and an area of the pressure side extending towards and over the tip, in addition to a strip along the leading edge of the suction side.
Index Terms— Turbomachinery, axial fan stage, flow field, particle trajectory, particle impact, erosion
I. INTRODUCTION
In the Sub-Mediterranean and Middle-East countries the ingestion of dust particles is inevitable in case of gas turbines and many turbomachinery components, such as turbochargers and cooling systems used in internal combustion engines. Continued operation under particulate airflows results in drastic degradations of their performance, as well as their structural integrity, which constitutes a serious problem for the manufacturers and users of these machines. In such regions most of ingested dust particles have size range between 0 to 1000 microns, with quartz as the most abundant erosive constituent known to cause considerable erosion wear to the blades surfaces. The loss in the turbomachinery aerodynamic performance is usually a gradual process through an increase of tip clearance and deterioration of an optimised blade profile. Erosion in turbomachinery has been investigated by several authors as reported in reference [1]. Balan and Tabakoff [2] studied experimentally the effects of sand ingestion in the case of an axial flow compressor and found severe erosion of the blade leading edge and pressure side with increased surface
roughness. Also, they noticed an overall shift of the pressure rise coefficient and efficiency versus the flow coefficient. Ghenaiet, Elder and Tan [3] characterized the increase in tip clearance and blade chord reduction of a high speed axial fan (11000 rpm) after 9 hours of sand ingestion and noticed 7.1 % and 9.5 % drop in efficiency and pressure rise coefficient, respectively, due to blade leading edge blunting and erosion wear over the upper corner of the blade pressure side. Experimental procedures for assessing erosion and performance degradation remain very expensive and revealed limited information because of different operating conditions of a turbomachine. It is therefore necessarily to use numerical simulations to predict particle trajectories and areas prone to erosion, which may be useful for blade wear monitoring and in coating protection. Hussein and Tabakoff [4] pioneered in particle trajectory simulations through rotating and stationary axial turbomachinery and the use of experimentally based particle rebound factors. Elfeki and Tabakoff [5] showed that in centrifugal compressors particle trajectories are consistently different, because of the complex flow and direction of centrifugal forces. Also Ghenaiet carried out similar computations in a small radial compressor [6] and an inflow turbine [7]. The prediction of particle trajectories and turbomachinery blades erosion is still a very difficult task due to the complexity of involved factors including; the initial relative location of a rotor blade with respect to a stator, flow conditions, geometry, random particle size distribution and uncertainties in initial locations, sizes and rebound of particles.
Manuscript received February 20, 2009.
Adel. Ghenaiet is with the Thermal Power Laboratory, Applied Mechanics, EMP, 16111, Algiers Algeria (phone: 00213-2186-3469; fax: 00213-2186-3204; e-mail: ag1964@ yahoo.com).
This paper presents a numerical study aimed at the determination of sand particle trajectories and the eroded areas in an axial fan stage with an inlet guide vane ‘IGV’ used for cooling a type of V6 diesel engine. This fan is controlled by a hydraulic system operates with a variable speed up to a ratio of 1.86, giving a maximum rotational speed of 4650 rpm. The IGV and rotor have 19 and 11 blades, respectively, all made from aluminium alloy except the shroud made from steel. The geometry of the IGV and rotor blades (Fig. 1) was obtained by means of a tri-optic measuring machine.
in different computational cells used the finite element interpolation method. At the interface planes between successive computational sub-domains (IGV and rotor for example), the particle trajectories information is transferred locally and the new locations of particles are identified by means of a searching procedure. The knowledge of the points of collisions, as well as the magnitude and direction of impacting velocities were critical in the determination of the local erosion rates and mass erosion based on semi-empirical erosion correlations applicable for aluminium and steel materials.
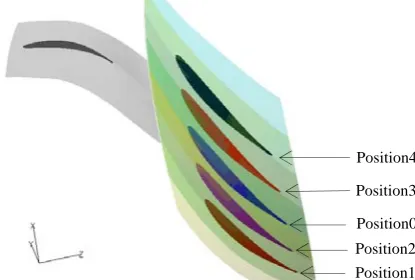
Five relative rotor blade positions with respect to IGV blade trailing edge were considered to show the effect of initial positions. Because of different numbers of IGV and rotor blades, the upstream domains to the rotor blade were rotated both upward and downward for a known number of rotations according to the considered initial relative position.
These numerical simulations were carried at the maximum operating speed of 4650 rpm and design mass flow of rate of 3.9 kg/s, considering sand particle size distribution MIL-E5007E at a high concentration of 750 mg/m3.
Fig.1.Axial fan stage, front view and side view
II. FLOW FIELD COMPUTATION
The flow-field in this turbomachine was computed by means of the code TASCflow, which is a time averaging Navier-Stokes solver based on the finite volume technique. The computational domain contains an inlet guide vane and a rotor blade in addition to an extended inlet nose and a downstream diffusing pipe with a step transition, as depicted in Fig. 2. Six three-dimensional H sub-grids involving 180,000 mesh points were used. Figure 3 shows the mid height blade to blade grids. Periodic boundaries are considered at one pitch away from the IGV and rotor blade and upstream and downstream of the extension domains, whereas symmetry boundaries are considered on the axis of rotation. A frozen stage interface is considered at the interface plan between the IGV and rotor domains. A constant total pressure is applied at inlet of the intake and a mass flow rate at the outlet of downstream pipe. The flow computations were carried out at five different rotor blade initial positions with respect to IGV blade (see Fig. 4), where the neutral position at mid span corresponds to rotor blade leading edge in the wake of IGV trailing edge. The fan operating conditions are a speed of rotation of 4650 rpm and a mass flow rate of 3.9 kg/s, corresponding to the maximum
cooling requirement when the diesel engine operates at its maximum regime at 2500 rpm.
[image:2.595.307.559.85.202.2]Inlet
[image:2.595.310.557.230.370.2]Fig. 2 Full computational domain and boundary conditions
Fig. 3 IGV and rotor grids at mid-span
Fig. 4 Five rotor blade initial positions in mid-span
III. PARTICLE TRAJECTORIES COMPUTATION Usually there are two common approaches; the Eulerian or Lagrangain, which differ in handling the dispersed phase. The Eulerian approach treats both the flow and dispersed phase as two interpenetrating continua, whereas the Lagrangian approach considers the tracking of individual particles as they are driven by the airflow. A simple comparison between these two approaches indicates that the Lagrangian method is somewhat more economical and is able to handle in more details the physical description of particles, such as their interaction with walls.
The left hand side in the equation of motion (1) represents the inertia forces derived from the second derivative of the vector position in the rotating frame, including centrifugal and Coriolis forces, whereas the right hand side contains the main
Periodic plane
Symmetry
Outlet Rotor
IGV
Position4
Position3
Position0
Position2 Position1 Rotor
[image:2.595.47.270.325.453.2] [image:2.595.351.559.407.547.2]forces exerted on a particle, namely; the drag force, gravity force, Saffman force and other neglected forces.
S g D p
p F F F
dt V d
m G G G
G
+ +
= (1) (1)
There are many correlations available in the literature relating the drag coefficient to Reynolds number, which are of varying complexity, such as Clift et al [8], and Haider and Levenspiel who have derived the following correlation [9], where constants A, B, C and D depend on a particle shape.
(
)
⎟ ⎟ ⎟ ⎟ ⎠ ⎞ ⎜ ⎜ ⎜ ⎜ ⎝ ⎛ + + + = Re D 1 C Re A 1 Re 24 C B D(
f p)
f pD f 2 p
D d C V V V V
8
F =π ρ − − (2)
Particle moving in shear layers of non-uniform velocity gradients and pressure distribution experiences a lift force known as Saffman force for which a formulation extended in a three dimensional form [10] is given as below, where ReS
represents the shear flow Reynolds number.
(
f p)
fLS 3 p f
S d C V V V
8
FG = ρ π G − G ×∇ G
(
p S SLS f Re ,Re
Re 1126 . 4
C =
)
(3)The motion of a particle in the vicinity of a rigid wall induces an increase in drag coefficient. The effect of normal motion is accounted for by a relation due to Brenner [11], and that to parallel motion is due to Goldman, Cox and Brenner [12]. By considering the drag, gravity and Saffman force as the main external forces, the following set of second order non-linear differential equations is derived.
(
)
(
)
(
)
⎪ ⎪ ⎪ ⎪ ⎩ ⎪⎪ ⎪ ⎪ ⎨ ⎧ + − = ∂ ∂ + − ⎟ ⎟ ⎠ ⎞ ⎜ ⎜ ⎝ ⎛ + − − = ∂ ∂ + − ⎟ ⎟ ⎠ ⎞ ⎜ ⎜ ⎝ ⎛ + + − = ∂ ∂ p Z S zP zf p f p 2 P2 p p
S p p p p p P r p P f p f p 2 P 2 p r S p 2 p p P rP rf p f p 2 P 2 m F V V G d 4 3 t z m r F r cos g r V r V 2 r V V G d 4 3 t m F sin g r V r V V G d 4 3 t r ρ ρ θ ω ρ ρ θ θ ω ρ ρ θ θ θ θ θ
(4) (
2 2 2 pz fz pr f pr fr
D V V V V V V
C
G= − + θ− + −
At an interface plane between a stationary and rotating frame the particle velocity is decomposed into peripheral and relative velocities.
P P P W U
VG = G + G (5)
3.1 Turbulence Effects
In turbulent flows small size particle requires the determination of the instantaneous flow velocity components corresponding to a particular eddy, which are calculated by considering the local flow properties and a Gaussian random number. Turbulence effect is assumed to prevail as long as
the particle-eddy interaction time (Brown and Hutchinson [13]) is less than the eddy lifetime and its displacement relative to an eddy is less than the eddy length as estimated according to Gosman and Ioannides [14].
3.2 Solving Procedure
The system of differential equations (4) is solved using Runge-Kutta-Fehlberg seventh order [15]. For a good convergence, the integration time step is taken between 10 - 25 micro-seconds. Near a boundary condition the particle is moved backward and the time step is reduced in order to bring it within a prescribed tolerance based on particle half diameter. Particle tracking in different computational cells requires transforming the physical co-ordinates to the cell local co-ordinates by solving a set of non-linear equations. If the absolute value of a local co-ordinate is greater than unity it means that the particle is outside this cell, and we have to increment for a next one.
3.3 Boundary Conditions
-Interface planes between a stationary and a rotating domain serves to transfer particle trajectory data.
-Periodic boundary conditions are used for lateral sides of all domains.
-Symmetry is assigned on the axis of machine.
-At a point of impact the impinging angle is calculated from the particle velocity and the surface unit vectors. The rebound velocity and angle are computed based on the rebound factors (as below) derived experimentally by Tabakoff, Hamed and Murugan [16]. From the standard deviation and a Gaussian generated random number, it is possible to estimate the actual restitution factors.
4 1 4 3 1 3 2 1 2 1 1 0 1 P 2
P a a a a a
V
V = + β + β + β + β
3 1 3 2 1 2 1 1 0 1 P 2
P b bβ b β bβ
β
β = + + + (6)
The number of seeded particles and their initial positions both radially and tangentially are determined according to the specified concentration profile of a mean value of 750 mg/m3 based on sand particle size distribution: MIL-E5007E (0-1000μm). For particle trajectories computations five different rotor initial positions were considered (Fig. 4), when the fan operated at its maximum speed of rotation of 4650 rpm and a design mass flow rate of 3.9 kg/s.
4 EROSION ASSESSMENTS
( )
(
V V)
f(
VNf
K 1
2 2 2 1 1
1 − +
= β θ θ
ε
)
(7)The values of mass erosion (mg) on the discrete points
calculated from local erosion rates are cumulated on a mesh surface and used to plot the local equivalent erosion level given in mg/g/cm2 as follows:
∑
∑
= N
i p N
i i p A
m A
m
1 1
δ ε εδ
(8)
The values of mass erosion (mg) corresponding to all impacted points on the IGV and rotor blades surfaces are summed and divided by the total mass of impinging particles, in order to get the overall erosion rates for the IGV and rotor blades.
5 RESULTS AND DISCUSSIONS
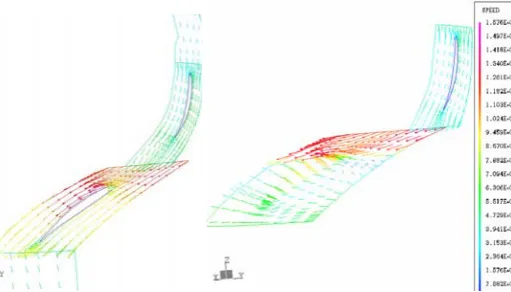
[image:4.595.298.551.50.233.2]The flow field was determined first and produced the necessary data for particles dynamics simulations, as well as allowed describing the main complex flow features and interpreting of the behaviors of particles dynamics through the whole machine components. Figure 5 shows the vectors of flow velocity at mid span and in tip clearance. Across the interface plan between IGV and rotor the relative flow velocities are changing in direction, and a part of IGV wake is ingested by the rotor row, thus inducing a disturbance to the relative velocities around the rotor blade leading edge, which are found to affect particles trajectories. Upstream and around the blade leading edge the relative flow velocities are relatively high and are increasing with the blade height. Lower flow velocities are encountered toward the trailing edge of blade with an evidence of wake formation. The most complex flow features occur in the tip clearance region, where the leakage around the blade tip develops into a vortex and mixes out with the annulus wall boundary layer. The flow at rotor exit is strongly influenced by the back-pressure at the rotor step (Fig. 6) where a strong diffusion occurs. Upstream IGV the flow is accelerated around the inlet nose as shown by Fig. 6.
Fig. 5 Flow velocity vectors at mid span and in tip clearance
[image:4.595.35.291.573.719.2]
Fig. 6 Flow velocities vectors and contours from hub to shroud
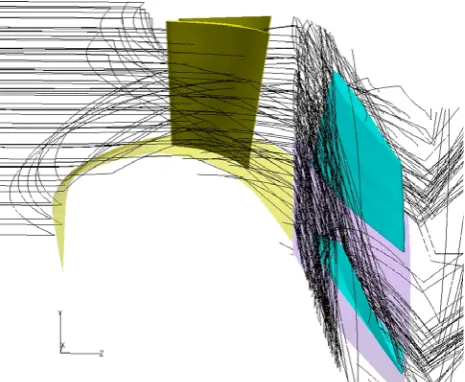
Fig. 7 Trajectories of 10 micron sand particles
[image:5.595.54.283.51.212.2]Fig. 8a Impacts velocities on IGV suction side and rotor blade pressure side by 10 micron sand particles
[image:5.595.312.537.55.175.2]Fig. 8b Impacts velocities on IGV pressure side and rotor blade suction side by 10 micron sand particles
[image:5.595.306.534.230.354.2]Fig. 9 Trajectories of 250 micron sand particles
Fig. 10a Impacts velocities on IGV suction side and rotor blade pressure side by 250 micron sand particles
Fig. 10b Impacts velocities on IGV pressure side and rotor blade suction side by 250 micron sand particles
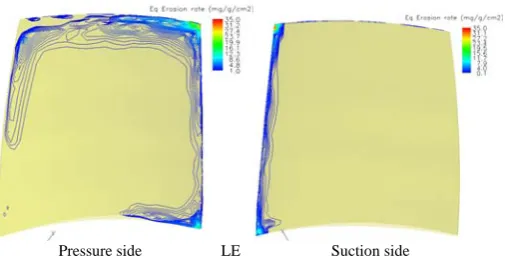
[image:5.595.53.286.574.765.2]leading edge. Also, an area towards the trailing edge of blade pressure side starts to spread due to this effect, as revealed by Fig. 11d. It is clear that the material removal is related to size of particles impacting the blade, concentration and duration of exposure and initial rotor blade positions. From the results of particle trajectory and erosion based on the simulations carried out for different initial rotor blade positions, the mass erosion and overall rate of erosion corresponding to the rotor blade, hub and shroud, in addition to IGV blade are found to depend on the relative initial positions as presented in Table 1 and Table 2 .
[image:6.595.295.548.50.180.2]Pressure side LE Suction side
[image:6.595.39.294.200.335.2]Fig. 11a Equivalent erosion rate on rotor blade due to sand MIL-E5007E (750 mg/m3), blade position 0
Fig. 11b Equivalent erosion rate on rotor shroud and hub due to sand MIL-E5007E (750 mg/m3)
[image:6.595.305.554.248.399.2]Pressure side TE Suction side
Fig. 11c Equivalent erosion rate on IGV blade due to sand MIL-E5007E (750 mg/m3)
Pressure side LE Suction side
Fig. 11d Equivalent erosion rate on rotor blade due to sand MIL-E5007E (750 mg/m3), blade position 3
Table 1.Erosion wear in IGV after 1 hour of sand ingestion
Erosion parameters
IGV
position
0
position
1
position
2
position
3
positio n
4
Sand particles rate (g /s) 0.1254 0.1252 0.1260 0.1254 0.1258
Mass of particles (g) in 1 hour
451.71 450.68 453.88 451.72 452.92
Mass erosion of blade (mg) in 1 hour
0.6296 0.6202 0.6113 0.6315 0.6495
Mass erosion of shroud in 1 hour (mg)
4.95E-3 1.96E-3 1.51E-2 3.86E-4 3.06E-4
Mass erosion of hub in 1 hour (mg)
1.08E-3 3.02E-3 0.00 2.56E-3 0.00
Reduction in blade mass (%) in1 hour
1.80E-4 1.77E-4 1.75E-4 1.39E-3 1.86E-4
[image:6.595.52.267.392.518.2]Overall erosion rate (mg/g) 1.39E-3 1.37E-3 1.34E-3 1.81E-4 1.43E-3
Table 2. Erosion wear in rotor after 1 hour of sand ingestion
hub shroud
Erosion parameters
Rotor
position
0
position
1
position
2
position
3
position
4
Sand particles rate (g /s) 0.2190 0.2336 0.2454 0.2502 0.2225
Mass erosion of blade (mg) in 1 hour
788.56 841.11 883.38 900.73 801.24
Mass erosion of blade (mg) in 1 hour
109.32 116.10 140.98 141.32 113.60
Mass erosion of shroud in 1 hour (mg)
0.1672 0.2390 0.3914 0.2140 0.1500
Mass erosion of hub in 1 hour (mg)
0.1320 9.26E-2 0.1549 0.2761 0.4307
Reduction in blade mass (%) in1 hour
2.69E-2 2.86E-2 3.48E-2 3.47E-2 2.80E-2
Overall erosion rate (mg/g)
0.1386 0.1380 0.1596 0.1569 0.14177
6 CONCLUSION
[image:6.595.308.555.442.591.2] [image:6.595.36.297.582.721.2]tip clearance and cause blade tip erosion. On the shroud, multiple impacts and erosion wear are connected to particles acquiring centrifugal forces. Contrary, there are few impacts on the hub. In IGV blade impacts spread over the pressure side, but erosion levels are significantly lower. The inclusion of turbulence and near wall effects, as well as particle size and rebound was essential in this study. Finally, these results may be useful in evaluating the associated loss in aerodynamic performance and providing the necessary blades coatings.
REFERENCES
[1] A. Hamed, W. Tabakoff, and R.Wenglarz, “Erosion and Deposition in Turbomachinery”, Journal of Propulsion and Power, Vol. 22, No. 2, March–April 2006
[2] W. Tabakoff , and C. Balan, “Effects of Solid Particles Suspended in Fluid Flow Through an Axial Flow Compressor Stage”, Paper N° 75, International Symposium on Air Breathing Engines, February 16-18 1981, Bangalore , India
[3] A. Ghenaiet, R. L. Elder, and S. C. Tan, “Particle Trajectories through an Axial Fan and Performance Degradation due to Sand Ingestion”, ASME / IGTI, Paper 2001-GT-0497
[4] M. F. Hussein, and W. Tabakoff, “Computation and Plotting of Solid Particle Flow in Rotating Cascades”, Computers and Fluids, Vol. 2, No. 1, 1974, pp. 1–15.
[5] S. Elfeki and W. Tabakoff, “Erosion Study of Radial Flow Compressor with Splitters“, Journal of Turbomachinery, Vol 109 January 1987. [6] A. Ghenaiet, “Numerical Simulations of Flow and Particle Dynamics
Within a Centrifugal Turbomachine”, Compressors and Their Systems 2005, IMechE paper C639_52, ISBN: 0-470-02576-X Wiley publisher [7] A. Ghenaiet, “Study of Flow and Particle Trajectories through a Radial
Inflow Turbine”, Compressors and Their Systems 2007, IMechE paper C658-008, 978-1-84334-418-6, Chandos Publishing Oxford, UK [8] R. Clift, J. R. Grace, and M. E. Weber, Bubbles, Drops and Particles,
Academic Press, New York, 1978.
[9] A. Haider, and O. Levenspiel, “Drag Coefficient and Terminal Velocity of Spherical and Non Spherical Particles”, Powder Technology, 58 (1989) 63.
[10] M. Sommerfeld, “Theoretical and Experimental Modelling of Particulate Flow - Overview and Fundamentals”, VKI Lecture series 2000–06, April 3-7 2000, Von Karman Institute, Belgium
[11] H. Brenner, “The Slow Motion of a Sphere through a Viscous Fluid towards a Plane Surface”, Chem. Eng Science, vol. 16, 242-251 (1961) [12] A. J. Goldman, R. G. Cox, and H. Brenner, “Slow Viscous Motion of a
Sphere Parallel To a Plane Wall-II Couette Flow”, Chem. Eng. Science, Vol. 22, 653-660 (1996)
[13] D. J. Brown, and P. Hutchinson, , “The Interaction of Solid or Liquid and Turbulent Fluid Flow Fields – A Numerical Simulation”, Journal of Fluids Engineering, Vol. 101, pp 265-269, 1979
[14] A. D. Gosman, and E. Ionnides, “Aspects of Computer Simulation of Liquid Fuelled Combustors”, 19th Aerospace Science Meeting, St Louis
Missouri, AIAA 81-0323
[15] Erwin Fehlberg, “Classical Fifth, Sixth, Seventh and Eighth Order RK Formulas with Step Size Control”, NASA TR-287 October 1968 [16] W. Tabakoff, A. Hamed, and D. M. Murugan, “Effect of Target
Materials on the Particle Restitution Characteristics for Turbomachinery Application”, Journal of propulsion and power Vol. 12 No 2, March-April 1996
[17] G. Grant, and W. Tabakoff, “An experimental Study of Certain Aerodynamic Effects on Erosion”, Dept. of Aerospace Engineering Technical Report 72-28, Univ. of Cincinnati, July, 1972.
[18] R. Ball, and W. Tabakoff, “An experimental Investigation of the Erosive Characteristics of 410 Stainless Steel ad 6A1-4V Titanium”, Dept. of Aerospace Engineering Technical Report 73-40, University of Cincinnati, July, 1973.
LIST OF SYMBOLS A area
C concentration CD drag coefficient CL lift coefficient
d diameter F force
K1 material constant LE leading edge m mass P pressure Re Reynolds number r radius, radial co-ordinate t time
TE trailing edge U peripheral velocity V absolute velocity W relative velocity z axial co-ordinate Greek letters
β impact angle (degree) ε erosion rate (mg/g) ρ density
ω speed of rotation rd/s θ tangential component
Subscripts