Information Fusion for Hazard Analysis in
Multi-Sensor Systems based on Bayesian
Networks
J¨
org Barrho, Johannes Hauger and Uwe Kiencke
∗Abstract—Modern sliding table saws are equipped with several passive safety devices. However, alone in Germany several hundred severe injuries or limb amputations occur each year due disregarding safety regulations and demounting of passive safety devices. Thus an active safety system is developed in order to protect the machine user. For this purpose, a multi sensor system for hazard analysis based on infrared and capacitive sensors is applied. When a danger-ous situation is recognized by the developed sensors, the system triggers a rapid saw blade braking device. The hazard analysis is carried out by means of an information fusion of the sensor signals based on a Bayesian network. For the fusion process the mea-surement values of the sensors have to preprocessed appropriately. The system is implemented in C and LabView. Therefore the system runs in real-time. Validation tests have shown the very reliable function of the developed hazard analysis.
Bayesian network, measurement fusion, infrared sen-sor, capacitive sensen-sor, hazard analysis
1
Introduction
Serious accidents such as amputations of fingers can be caused by sliding table saws (see Figure 1) and other ma-chine tools. The reasons for these accidents are mostly inattention and disregarding of safety regulations. Al-though it is the law, passive accident protection systems like the push stick are often not used. To avoid these accidents an active safety system is developed. The goals of such a system are recognizing a dangerous situation and if necessary reacting appropriate on the situation by means of warning lights or a rapid braking system. A description of the braking system is beyond the scope of this paper. These goals are met by a multi-sensor system mainly consisting of infrared-sensors, capacitive sensors, a camera with an appropriate image processing and an information fusion of the sensor signals.
The paper is organized as follows. First of all the em-ployed sensor systems are described. In Section 2 a brief
∗Institute of Industrial Information Technology, Universit¨at
[image:1.595.365.492.224.320.2]Karlsruhe (TH), Hertzstr. 16, Bldg. 6.35, 76187 Karlsruhe, Ger-many Email: [email protected]
Figure 1: Picture of a sliding table saw.
introduction to the applied sensor system is given. Af-terwards the preprocessing of the sensor signals is pre-sented. In Section 4 the applied Bayesian network for the information fusion is discussed. Following, the results are shown and the conclusions are briefly drawn.
2
Sensor Systems
The first step of an active safety system for sliding table saws are a non-contact sensor systems. The sensor sys-tems have to work contactless, because the machine user should not recognize that he is kept under surveillance by the safety system. Furthermore, he is also not inter-fered with any kind of safety devices, which can impede working. Under these conditions, possible sensor princi-ples are investigated and applied. The different applied sensors for finger detection are shown in this section.
2.1
Thermopile Infrared(IR)- Sensor
Sys-tem
measure infrared radiation by means of the change of tem-perature of an absorbing material are classified as ther-mal detectors. One type of infrared detectors is presented here. Thermopile sensors are based on the thermoelectric effect [2] and consists of multiple thermal elements, which are arranged in a row in order to boost the measurement effect. The output voltage of the applied sensor is in the µ-voltage range. Thus, the output has to be amplified carefully, because noise or disturbing voltages are also amplified. Hence, the amplifier circuit has to be shielded and analog low-pass filters are utilized.
2.2
Capacitive Sensor Systems
Another principle for non-contact sensing is to utilize the dielectric properties of human tissue. Human tissue con-sists mostly of water and one feature of it is the high value of the dielectric constantǫr [3]. Therefore,
electri-cal fields can be influenced significantly by human tissue. On the other side, wood or even drenched wood have shown approximately a four time lower value of the di-electric constant in empirical tests compared to human tissue. Furthermore, metal also influences significantly the electrical field. However, this issue can be handled by additional types of sensors. Two types of capacitive sensors are applied and presented in the following.
Capacitive measurement: A ready-to-use integrated cir-cuit for capacitive measurement is available from Analog Devices [8]. An appropriate sensor construction was de-veloped in order to measure the capacity between the table and a specific small part of the saw guard. When the elevation changes of the saw guard are known, human tissue can be detected.
Stray field measurement: Capacitors possess one main field and corresponding stray fields. These two types of field can be influenced. However, influences on the main field causes a greater effect and can be measured easily. The range of the stray field is low (less than 0.5cmin the applied version) and the measurement effect is marginal. So an amplitude attenuation measurement is employed, because changes of the stray field caused by e. g. hu-man tissue cause also a small change of the applied volt-age across the capacitor. These changes are measured and amplified for near range hand detection. The sen-sor is implemented into some safety segments of the saw guard, see Figure 2. One drawback of this setup is the dependency of motion of the sensor’s sensitive wires due to changes of the electrical field configuration in conse-quence of the variation of the sensor geometry. However, this effect is corrected by means of a potentiomete.
2.3
Camera and Image Processing
The camera observes the left side of the saw guard (see Figure 3) and the entire image processing system shall find reliably the human hand. A detailed description of each image processing step would go beyond the scope of this paper. Thus, the steps are only itemized. More
[image:2.595.369.485.259.348.2]details can be found in [6, 7]. The first step of the image processing is a motion detection, because only moving hands could cause a dangerous situation. The next step is a feature extraction based on edges and color. After-wards a probabilistic hand model is applied to classify the hand and to initialize an active contour algorithm. The final steps are the hand tracking and the calculation of dynamic parameters (hand velocity, direction, posi-tion). By means of these parameters the hand can be detected reliably and the potential danger can be esti-mated. Unfortunately, the computational effort of the image processing is enormous and it runs not in real time on the available hardware. Therefore, its influence on the hand detection and the information fusion is simulated here.
Figure 2: Modified saw guard
2.4
Modified Saw Guard
In Figure 2 the modified saw guard is shown. Each safety segment includes a capacitive sensor and a potentiometer. This segments are necessary to inhibit lateral movements into the saw blade. Also the extension of the saw guard can be seen. The extension is equipped with a capacitive and a thermopile sensor and is used for a primary hand detection and warning the machine user.
Potentiometer
Capacitive sensor
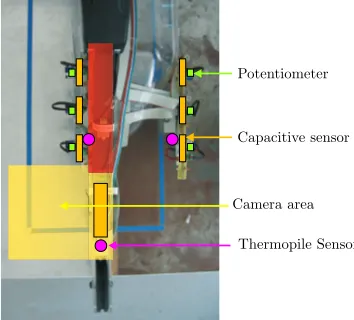
[image:2.595.320.497.501.661.2]Thermopile Sensor Camera area
Figure 3: Sensor mounting and dangerous areas (red: high danger, yellow: mediumdanger)
in the yellow area, the user will be warned. This area is a medium danger zone. The red area is the high danger zone. When a hand enters this area, the saw blade is stopped immediately.
3
Preprocessing of Sensor Signals
Before the output signals from the sensors can be used for an information fusion with a Bayesian network, they have to become preprocessed. In doing so the signals are first scaled so that the range of values is limited to [0,1]. The 0 shall be output, if no object is found in the area of the sensor and the 1 shall be used, if the sensor signal achieves or exceeds a specific value for a detection of a hand. To make the information of the sensors more reliable known disturbances are compensated by means of characteristic curves of the corresponding sensor system.
3.1
Discretization of Corrected Sensor
In-formation
Having all sensor signals transformed into the range of [0,1], they get discretized. It is also possible to work with continuous variables in Bayesian networks, but it saves computing time by using only discrete variables. Therefore the signals shall be discretized into three states. They are called ”no object” (nothing), ”cold object” (cold) and ”warm object” (warm) for the thermopile sen-sors and ”no object” (nothing), ”object with small ǫr”
(small ǫr) and ”object with bigǫr” (big ǫr).
The discretization shall not be done in the classical way so that every value is part of one state by expelling all other states. Instead of this a ”probability function”ψ(x) similar to the membership functionµ(x) of the fuzzy logic is introduced. The ”probability function”ψak(x) gives a probability for the stateak to be true for a specific
sen-sor valuex. The big difference to the fuzzy membership functions µ(x) is, that all probabilities for every sensor value sum up to 1.
ψa1(x) +ψa2(x) +...ψan= 1 (1) As a basis for the ”probability function” a bell-shaped curveg(x) is used.
g∗(x) =e−(x−m)2
2σ2 (2)
The position of the maximum can be defined withmand the position of the inflection points is also arbitrary with m±σ. For the discretisation first of all two limitsl1and l2are selected to define the three states out of the range [0,1]. Afterwards the transitions between the three states become fuzzy with the help of the bell-shaped curve. The function value of the fuzzy membership functionµ(x) at the limits l1 andl2 is set to 0.5. Therefore the position of the maxima have to be defined.
m1,2=x±
p
−2σ2·ln(g∗(x)) (3)
Out of the two limits l1 and l2 we get the four maxima ml1,1, ml1,2,ml2,1 andml2,2. The membership functions
for the discretisation of the sensor signals u(t) with the basis of the bell-shaped curveg(x) and the limitsl1 and l2are defined as follows:
µa1(u)=
( 1
f or u≤ml1,1
e−
(x−ml1,1)2
2σ2 f or u > m
l1,1
(4)
µa2(u)=
e−
(x−ml1,2)2
2σ2 f or u < ml
1,2
1 f or ml1,2 ≤u≤ml2,1
e−
(x−ml2,1)2
2σ2 f or u > m
l2,1
(5)
µa3(u)=
e−
(x−ml2,2)2
2σ2 f or u < ml2 ,2
1 f or u≥ml2,2
(6)
To convert the membership functions µak into ”proba-bility functions” ψak(u) the sum Σ(u) over all functions shall be exact 1. Therefore the difference ∆Σ(u) of Σ(u) and 1 is calculated.
∆Σ(u) = Σ(u)−1
= µa1(u) +µa2(u) +µa3(u)−1 (7)
This difference is then subtracted from the membership function with the highest probability.
ψa1(u) =
µa1(u)−∆Σ(u) f or u < l1
µa1(u) f or u≥l1
(8)
ψa2(u) =
µa2(u) f or u≤l1 µa2(u)−∆Σ(u) f or l1< u < l2 µa2(u) f or u≥l2
(9)
ψa3(u) =
µa1(u) f or u≤l2
µa1(u)−∆Σ(u) f or u > l2
(10)
4
Applying Bayesian Networks for
Haz-ard Analysis
In this section the design of the information fusion by means of a Bayesian network is explained. The goal of the fusion is to detect a hazard. The Bayesian network shall decide by means of the preprocessed sensor signals if there is a hazard for a hand and if necessary cause an emergency break of the saw. Furthermore there shall be a warning if a hand is in danger, so that the user is alert at an early stage. Afterwards the implementation in C and the integration into NI LabView is explained. Also some results and the validation are shown.
4.1
Design of Bayesian Networks
has a finite set of mutually exclusive states. The variables are represented as nodes A,B,... in a directed acyclic graph (DAG). The links between the nodes are describing the dependencies between the variables. For each link a conditional probability tableP(A|B1, ..., Bn) is added. A
detailed explanation of Bayesian networks can be found in [4, 5].
As basic structure of the design for the net the defined danger zones and the position of the different sensors (shown in Figure 3) is used. A big advantage of the Bayesian network is the modularity. So the design of the net for different parts can be done separately and merged together afterwards. First of all the part for the yellow zone in Figure 3 is drafted. The graph for this part is displayed in Figure 4.
ir yellow
cap yellow
material identify
yellow zone front
[image:4.595.353.503.70.127.2]yellow zone back
Figure 4: Nodes and directed links for the yellow dan-ger zone (cap denotes capacitve sensor andir is infrared sensor)
For each sensor aninformation node(blue) has been cre-ated which is linked to one of the two hypothesis nodes
(green). The variables represented by the hypothesis nodes consist of four states. They are called: nothing, wood,metalandhand. The information variables of the nodes ”cap yellow” and ”ir yellow” have the three states explained earlier (Section 3.1), while the variable of the node ”material identify” consist of the two statesmetal andno metal. After defining the DAG and the different states for all variables, the conditional probability tables have to be specified. For the definition of the conditional probability table of a node every possible combination of states from all parent nodes has been examined. For every possible combination a value for the probability has to be defined. The conditional probability table for the node ”yellow zone back” consists of four columns for the four possible states and 4·2·3 = 24 rows for the dif-ferent combinations of the states from the three parent nodes ”yellow zone front”, ”material identify” and ”cap yellow”.
The design for the red danger zone is divided into two parts. One for the left side and one for the right side. This has been done, because the sensor fusion for each side shall be done separately. Because both sides of the red danger zone are identical, a net for one side was created and the design was then also used for the other side. The graph for the left side is illustrated in Figure 5.
cap 2 left
cap 3 left ir
left
safety segment 1
left cap 1
left
safety segment 2
left
safety segment 3
[image:4.595.124.216.282.361.2]left
Figure 5: Nodes and directed links of the left side from the red danger zone
The net consists of four information nodes to represent the four sensors in this area. To estimate the position of the hand the left side of the red danger zone is di-vided into three subareas, one for each area defined by the extend of the safety segment. For every subarea a hypothesis node is defined. Again for every link a condi-tional probability table has to be added.
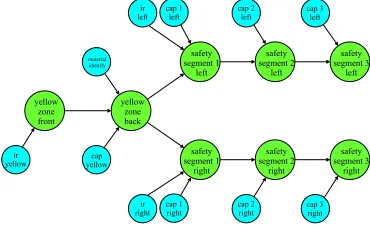
As explained above, the net for the left side with its con-ditional probability tables can also be used for the right side. Now the three nets are merged with two links, one from the node ”yellow zone back” to the node ”safety segment 1 left” and one to the ”safety segment 1 right”. The connected nets are shown in Figure 6.
cap 2 left
cap 3 left ir
left cap 1
left
cap 2 right
cap 3 right ir
right cap 1 right ir
yellow
cap yellow
material identify
safety segment 2
left
safety segment 3
left safety
segment 1 left
safety segment 2
right
safety segment 3
right safety
segment 1 right yellow
zone back yellow
zone front
Figure 6: Graph for the information fusion of the yellow and red danger zones
With the connection of the subnets the conditional prob-ability tables of the nodes ”safety segment 1 left” and ”safety segment 1 right” have to be updated, because they got one more parent node. The tables now consist of 4 columns for the different states of the node and 36 rows for all possible combinations of the states from the parent nodes.
So far the design for the Bayesian networks is made with-out considering that the sensors are distributed over a length of 40 cm. Because of this a hand is never detected from all sensors at the same time, but with a delay of sev-eral milliseconds. Therefore a calculated maximum for the state hand in one of the hypothesis nodes is stored for a specified time. By saving the maximum the detec-tion of a hand is used for the fusion even if the hand has already left the monitored area of a sensor. The storage time is chosen so long, that a very slow motion of a hand can still be detected reliably.
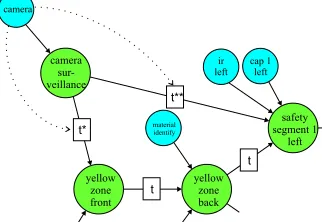
[image:4.595.335.520.355.472.2]process-ing is integrated into the network. The camera keeps the area on the left side of the yellow danger zone under sur-veillance. So it is possible to move ones hand through the video controlled area into the yellow danger zone or immediately into the red danger zone. To consider this, the new hypothesis node for the camera is connected to the nodes ”yellow zone front” and ”safety segment 1 left”. The fraction of the graph with the integration of the in-formation of the video surveillance is shown in Figure 7.
ir left
cap 1 left
material identify
safety segment 1
left
yellow zone back yellow
zone front
t camera
sur-veillance camera
t*
t**
t
[image:5.595.311.548.76.231.2]t
Figure 7: Fraction of the graph with the integration of the video surveillance
The added time delay between the hypothesis nodes can be seen as well. The time delays between the node ”cam-era surveillance” and its children nodes are computed with the help of the information from the image process-ing. The information of a hand detection in the area of the video surveillance is not forwarded to the nodes ”yel-low zone front” and ”safety segment 1 left” immediately after the detection, but only after the computed time de-lay.
The Bayesian network for information fusion is defined completely now. With the help of the preprocessed sensor signals the probability for a hand at different positions on the work bench of the sliding table saw can be calculated. Now only an interpretation of the results to operate the warning light and the emergency break have to be added.
Therefore two additional nodes (”warning” and ”stop”) are added to the graph. These nodes are not part of the Bayesian network. The node ”warning”’ represents the decision if the hand is in danger and the user shall be warned by lightening warning lights. The node ”stop” stands for activation of the emergency stop. The node ”warning” or ”stop” gets active, if the probability for the state handof one of the adjacent nodes exceeds the value of 0.5 for a warning and 0.4 for the emergency stop. The adjacent nodes for the ”warning” are as you can see in Figure 8 ”yellow zone back”, ”safety segment 1 left”, ”safety segment 1 right”, ”safety segment 2 left” and ”safety segment 2 right”. The adjacent nodes for the node ”stop” are ”safety segment 3 left” and ”safety segment 3 right”.
cap 2 left
cap 3 left ir
left cap 1
left
cap 2 right
cap 3 right ir
right cap 1 right ir
yellow
cap yellow
material identify
safety segment 2
left
safety segment 3
left safety
segment 1 left
safety segment 2
right
safety segment 3
right safety
segment 1 right yellow
zone back yellow
zone front
t
camera sur-veillance camera
t*
t**
t t
t t
t t
t warning stop
Figure 8: Bayesian network for the information fusion with the nodes for the warning lights
4.2
Software Implementation
The Bayesian network designed in the previous section is implemented in a C function, so that this function can be called from a LabView VI. The whole information about the nodes, their directed links and the conditional prob-ability tables are stored in this function. As parameter with the calling from the LabView VI the current sensor signals are passed into the function. The results of the function are the probabilities for all nodes and the deci-sion if the warning lights shall be turned on or the saw has to be stopped. The information can then be displayed with the help of the LabView VI. Also the actuators at the sliding table saw are driven from the VI.
5
Results and Validation
To validate the capability of the designed Bayesian net-work for the information fusion of the sensor signals, more than 2000 tests have been carried out on a test bench at the Institute of Industrial Information Technology, Uni-versit¨at Karlsruhe (TH). Passing these tests, four differ-ent cases have been distinguished. If a hand is moving through the yellow and red dangerous zones toward the saw blade and the system is detecting the hand properly and stopping the saw blade it’s called ”true positive”. If the system is not able to detect the hand it’s called ”false negative”. The other scenario for tests is that no hand is in danger, but the sliding table saw is in regular use. In this case the system can realize that no danger is present (”true negative”) or it can detect a hand by mistake and activate the emergency break (”false positive”).
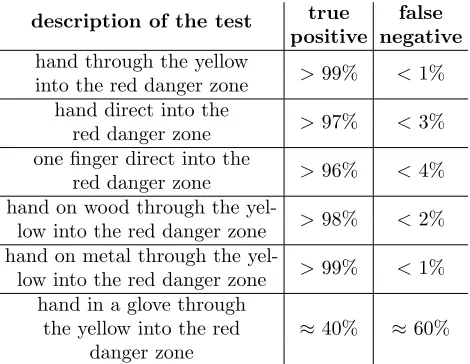
To verify the cases ”true positive” and ”false negative” a hand was moved on the working bench on different ways towards the saw blade. The conducted tests are explained in Table 1 with their frequency of occurrence for the two cases.
[image:5.595.89.250.210.321.2]true false description of the test
positive negative
hand through the yellow
into the red danger zone >99% <1% hand direct into the
red danger zone >97% <3% one finger direct into the
red danger zone >96% <4% hand on wood through the
yel-low into the red danger zone >98% <2% hand on metal through the
yel-low into the red danger zone >99% <1% hand in a glove through
the yellow into the red ≈40% ≈60% danger zone
Table 1: Scenarios for the cases ”true positive” and ”false negative” and their frequency of occurrence
reliable. The only case a hand is not detected is, if the user wears a protection glove. But there is no chance for the fusion, because non of the used sensors is providing an output signal different to the one stirred up by a peace of wood.
The results for the test scenarios with which the regular working process at a sliding table saw is simulated are given in Table 2.
true false
description of the test
negative positive
wood through the yellow
into the red danger zone >99.5% <0.5% metal through the yellow
into the red danger zone >99.5% <0.5% composite material through the
yellow into the red danger zone >99.5% <0.5% warm wood through the yellow
into the red danger zone >92% <8% warm metal through the yellow
into the red danger zone ≈40% ≈60% hand moving next to the
[image:6.595.53.288.71.253.2]safety segments parallel >99,5% <0,5% to the red danger zone
Table 2: Scenarios for the cases ”true negative” and ”false positive” and their frequency of occurrence
With the test from Table 2 it is proved that the saw is working normally if there is no accute danger for a hand. Even if a hand is moving next to the safety segments parallel to the red danger zone, there is no wrong hand detection and the sliding table saw is working regularly. The only problem is warm metal, but in this situation it is the same problem as above, that no utilized sensor can distinguish between a warm metal and a hand.
6
Conclusions
The goal of this paper was the conception of a Bayesian network for an information fusion for hazard analysis in machine tool environments. If the hand of a user is in danger warning lights shall be turned on and if the hand is still moving towards the saw blade an emergency stop shall be initiated.
The signals of the used sensors are first preprocessed to compensate interferences and to transform their signals into the range of [0,1]. The compensation is done with the help of a spline interpolation and an extended two-dimensional characteristic map.
Afterwards the preprocessed signals are fused with the help of a Bayesian network. Thereby the hypotheses nodes represent different positions on the work bench of the sliding table saw. The sensor signals are repre-sented by information nodes which are connected to the hypotheses nodes of the area they monitor. In regard of the spread positions of the sensors a delay between the hypotheses nodes was added. In the end the information fusion was validated for all possible scenarios. A reliable function of the hazard analysis is therefore proved.
References
[1] U. Kiencke, and R. Eger.Messtechnik. Springer Ver-lag, Heidelberg, 2005
[2] H.-R. Tr¨ankler.Sensortechnik. Springer Verlag, Hei-delberg, 1998
[3] C. Gerthsen and H. Vogel.Physik. 19. ed., Springer Verlag Heidelberg, 1997
[4] R. E. Neapolitan.Learning Bayesian networks. Pear-son Prentice Hall, 2004
[5] F. V. Jensen. An introduction to Bayesian net-works.UCL Press, 2000
[6] J. Barrho, J. Kallenberg, and U. Kiencke, “Visual tracking of human hands for a hazard analysis based on particle filtering,” in Proceedings of 11th IPMU International Conference, Paris, 2006.
[7] J. Barrho, M. Adam, and U. Kiencke, “Finger Local-ization and Classification in Images based on Gener-alized Hough Transform and Probabilistic Models,” in Proceedings of 9th International Conference on Control, Automation, Robotics and Vision, Singa-pore, 2006.
[8] Analog Devices, Inc. Company’s homepage: