Abstract—Vibropolishing has become increasingly significant in the value chain of many industries such as aviation. Despite the advantages of this technology, the fact remains that the process is an empirical one owing to its arcane nature. There is a need to comprehend this process and understand the science behind it. This paper looks into addressing the black box surrounding the Vibropolishing process through the use of monitoring systems implemented on a vibratory trough. The two most important parameters for a Vibropolishing system- frequency and amplitude of vibrations have been studied through the use of a uniaxial accelerometer and high speed camera. The relationship between these parameters with those directly obtained from the machine and with respect to each other has been reported
Index Terms—Vibropolishing, Vibratory finishing trough, monitoring, accelerometer, high speed camera
I. INTRODUCTION
Ibropolishing or vibratory finishing is a versatile process that is used for radiusing, brightening, deburring, fine finishing, cleaning, burnishing and descaling of various components. It is a process which can result in attaining the desired surface finish requirements in the most cost effective way with relatively low effort in process planning. It remains one of the most flexible mass finishing processes where complex parts can be finished simultaneously. Despite it having so many advantages, it has certain drawbacks as well. The main drawback remains that the relationship behind the input and output parameters is not well understood due to the complexity and uncontrollable nature of the vibratory finishing process. Design of the process for new components is thus still undertaken on a trial and error basis [1-6] and largely depends on the expertise of the suppliers and operators [7]. The main components of a vibratory finishing system include the container (bowl or trough) with the vibratory
Manuscript received March 3, 2017.This work was conducted within the Rolls-Royce@NTU Corporate Lab with support from the National Research Foundation (NRF) Singapore under the Corp Lab@University Scheme.
K. Ahluwalia is a Research Assistant with Rolls-Royce@NTU Corporate Lab c/o School of Mechanical and Aerospace Engineering, Nanyang Technological University, 50 Nanyang Avenue, Singapore 639798 (email: [email protected])
R. Mediratta is a Research Assistant with Rolls-Royce@NTU Corporate Lab c/o School of Mechanical and Aerospace Engineering, Nanyang Technological University, 50 Nanyang Avenue, Singapore 639798 (contact number: +65 83023361, email: [email protected])
S.H. Yeo is an Associate Professor with School of Mechanical and Aerospace Engineering, Nanyang Technological University, 50 Nanyang Avenue, Singapore 639798 (email: [email protected])
motor attached to it, media along with compound which imparts the finishing action and the workpieces (fixtured or freely floating) to be finished. A schematic of a vibratory finishing trough used in this study is shown in Figure 1. The mechanism behind vibratory finishing still remains unclear in spite of various studies that have been conducted. As a part of their experiments, researchers have implemented various sensors to observe and analyze the process. Table 1 shows some monitoring systems and their applications. Most of the studies conducted by the researchers were on the bowl configuration and if on the trough system- for the study of vibrostrengthening parameters and not vibropolishing. This paper will look into monitoring of the two most important parameters which define a vibratory finishing system, namely frequency and amplitude settings, which are in most cases read off directly from the machine. The study of different media loading conditions and its effect on the frequency and amplitude of a trough has not been reported before. Also, high speed camera has been used previously to study the media motion and not as a displacement sensor to quantify the amplitude of vibrations of a vibratory system.
Fig.1. Schematic of vibratory finishing trough
A Dytran 3056B3 series uniaxial accelerometer was used for frequency monitoring, quantifying the vibrations in the 3 dimensions as well as at various points along the trough with different media loading conditions. A Photron Fastcam SA4 high speed camera was used for measuring the amplitude of vibrations of the trough. These monitoring systems were implemented on a vibratory finishing trough with operating frequency and amplitude setting of 25 Hz and 5 mm respectively. The dimensions of the trough were 1750 mm x 850 mm x 800 mm dumping height. The implementation scenario of the monitoring systems on the Vibropolishing trough, experimental methodology, analysis and discussion of results will be presented. This paper seeks to achieve the objective of reducing the considerably long cycle times of the vibratory finishing process through a systematic understanding of the two important parameters, which will consequently result in cost savings for an industry using such a system; and at the same time provide neophytes and researchers in this field a basis to implement similar sensors
Process Monitoring of Vibropolishing in Trough
System
K. Ahluwalia, R. Mediratta, and S.H. Yeo
to obtain the frequency and amplitude setting for a given finishing operation on their system.
TABLEI
MONITORING SYSTEMS USED BY RESEARCHERS [3,8-15]
II. FREQUENCY MONITORING WITH ACCELEROMETERS
Accelerometers have been used in studies by Naeini et al. [11, 12] to obtain acceleration values of the vibratory finishing equipment and Fourier transforming the values to know the driving frequency of the vibrations. This is done by locating the peak of the Fourier transform graph which is in the frequency domain.
Accelerometers are piezoelectric sensors. These sensors are based on the piezoelectric effect. They measure changes in pressure, acceleration, temperature, strain, or force by converting them to an electrical charge. DAQ systems help in obtaining data values from the accelerometer to suitable software. Presentation of vibration signals in the time domain or in the frequency domain (or both) is mandatory for a correct interpretation of the machine operating conditions. The frequency spectrum is one data display where the time domain signal from a transducer obtained at a given machine operating speed is decomposed into its frequency domain spectral components. In this type of display, the vertical axis is calibrated to read amplitude in some convenient units while the horizontal axis is graduated in terms of frequency[16].
II.1 SPECIFICATIONS
Dytran uniaxial accelerometer series 3056B3 was used for the frequency monitoring experiments at the vibratory trough. It weighed 10 grams and was hexagonal in shape with dimensions 12.7 mm by 23.114 mm. The sensitivity of the accelerometer was 500 mV/g. The frequency range for the accelerometer was given to be 1 to 10,000 Hz. A supply current of 2 mA was required to enable the accelerometer to acquire signals, which was provided by the DAQ system. Adlink USB-2405 DAQ system was used for data acquisition and signal processing. It was a 24-bit high-performance dynamic signal acquisition module equipped with 4 analogue input channels providing simultaneous sampling at 128 kS/s. The USB-2405 has software selectable AC or DC coupling input configuration and built-in high precision 2 mA excitation current to measure integrated electronic piezoelectric (IEPE) sensors such as accelerometers and microphones. The software used was Visual Signal DAQ Express. It shows real time signals from the sensors and also has analysis blocks that can perform Time-Frequency Analysis.
II.2 EXPERIMENTAL PROCEDURE
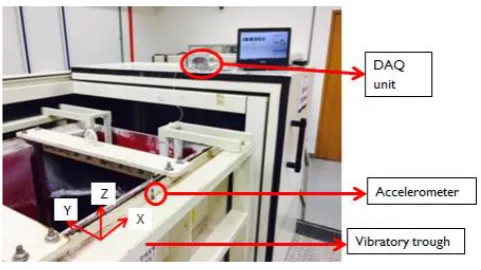
[image:2.595.308.549.544.679.2]The accelerometer setup on the vibratory trough is shown in Figure 2. Given that the operation of a vibratory finishing system is three dimensional, the uniaxial accelerometer was mounted in the X, Y and Z directions using blu-tac. Trials were conducted 3 times each at various locations along the length of the trough to study any variation, both with and without super polishing media loaded into it. The speed dial position of the vibratory trough was varied and the RPM reading was noted at every stage with the digital meter on the control panel of the trough. Readings were recorded from the DAQ software which performed the Fast Fourier Transform (FFT) analysis. The frequency spectrum graphs were plotted using MS Excel.
Fig.2. Accelerometer set up at vibratory trough with reference frame
The setup with the accelerometer mounted at various positions along the length of the vibratory trough to study the distribution of vibrations across the machine if any is shown in Figure 3.
Type of system Author/Researchers Applications
High speed cameras
Sangid et al.; Kumar et al.
Monitoring media flow for Vibro-strengthening
Accelerometers Naeini et al.
Measuring acceleration and then using Fourier Transform to determine frequency
Laser displacement
sensors
Hashemnia et al.
Measuring impact velocities by triangulation
Force sensors Wang et al.; Yabuki et al.
Measuring tangential and normal forces
Almen strips Ciampini et al.
Characterizatio n of vibratory finishing system
Golf balls Bill Nebiolo
Fig.3. Various locations of accelerometer placements – with and without media
II.3 RESULTS
The RPM readings noted at the various speed dial positions from the control panel of the vibratory trough is shown in table 2. The calculated frequency values for the RPM values (dividing them with 60) is also shown in the same table. This would be useful in comparing the experimental frequency values obtained from the Fourier plots using the accelerometer.
TABLE2
RPM and frequency values at various positions of speed dial
[image:3.595.317.535.50.168.2]In figures 4-6, the FFT plots are given for speed dial position 10 in the X, Y and Z direction when the accelerometer was placed at the center of the trough with no media loaded (as shown in Fig 1).
Fig.4. FFT plot of speed dial position 10 in X direction
[image:3.595.51.283.51.173.2]Fig.5. FFT plot of speed dial position 10 in Y direction
Fig.6. FFT plot of speed dial position 10 in Z direction
As can be seen from figures above, highest magnitude peaks are observed in the Z direction. This was true with all the other speed dial positions.
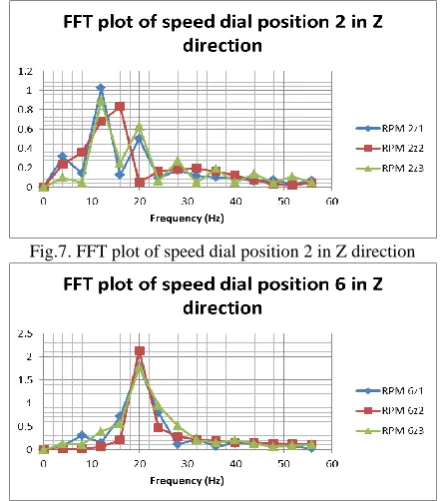
[image:3.595.315.536.305.556.2]Also, as RPM was increased on the control panel, the frequency also increases as can be seen in the shifts in the peaks from RPM 2 to RPM 10.Figures 7 and 8 show the FFT plots at speed dial positions 2 and 6 respectively in the Z direction.
Fig.7. FFT plot of speed dial position 2 in Z direction
Fig.8. FFT plot of speed dial position 6 in Z direction Table 3 will compare the calculated values in table 2 and the experimental values observed in the above graphs in the Z direction.
TABLE3
Comparison of calculated and theoretical values
Figures 9 and 10 below show the FFT plots obtained at speed dial position 10 without media at two different locations of the trough- back left and front right respectively. The objective behind conducting these set of trials was to determine if the frequency of vibrations were different closer to the vibratory motor along the trough than away from it.
Speed dial
position RPM
Calculated frequency value
(Hz)
2 888.81 14.81
6 1060.03 20.57
10 1499.97 25.00
Speed dial position
Calculated value (Hz)
Experimental value (Hz)
2 14.81 13.29
6 20.57 19.93
[image:3.595.56.248.355.430.2] [image:3.595.61.278.503.752.2] [image:3.595.321.511.629.694.2]Fig.9. FFT plot of speed dial position 10 without media-back left
Fig.10. FFT plot of speed dial position 10 without media-front right
The average of the frequency values obtained from the accelerometer (FFT plots) along the different positions of the trough was found to be 26.01 and 26.67 respectively. Similar set of experiments were conducted with 300 kg of super polishing media loaded into the trough. The readings obtained from the control panel of the machine were the same as those obtained without media as shown in Table 2. The FFT plots obtained for the two different locations of the trough were also similar to the previous case- back left and front right, and are shown in figures 11 and 12 respectively.
Fig.11. FFT plot of speed dial position 10 with media-back left
Fig.12. FFT plot of speed dial position 10 with media-front right
The average of the frequency values obtained in the above cases were 25.57 and 26.8 respectively, which are in close
comparison to the values obtained in the case without media for the same positioning of the accelerometer.
II.4 DISCUSSION
Frequency monitoring was done with the help of accelerometers and DAQ systems. The accelerometer was mounted in 3 different directions and 3 readings per axis and speed dial positions were taken at the same point for every trial conducted. The data were analyzed and the FFT graphs were plotted. It can be seen that as RPM increases, the FFT plots shift towards the right, indicating an increase in frequency of vibrations. Even though the vibratory finishing trough is known to be a three-dimensional system, it is evident that the magnitude of vibrations is predominantly in the Z direction, with very small magnitudes present in the other two directions. From Table 3, it can be seen that the experimental values obtained from the accelerometers are up to 11 % of the calculated values from those obtained from the control panel of the machine. Also, the uniaxial accelerometer readings, mounted at different points on the trough, both with and without media loaded, convey that the vibrations are uniform throughout the trough. Another important conclusion is that adding media or increasing the weight of the machine does not significantly alter the frequency of vibrations of the machine.
III. AMPLITUDE MONITORING WITH HIGH SPEED CAMERA
The amplitude of vibrations or the mean displacement of the trough from its mean position is an important parameter of a vibratory finishing system which is determined by the flyweight settings of the vibratory motor. It is familiar to people in this field that most conventional vibratory systems have an amplitude sticker (Figure 13) attached to it from which the amplitude is read by determining the number above which the circles coincide most closely when the machine is vibrating. The numbers obtained are whole numbers and this conventional method remains a rudimentary way of determining the real time amplitude of the machine.
Fig.13. Amplitude sticker
of amplitude of the machine for a given flyweight setting and RPM.
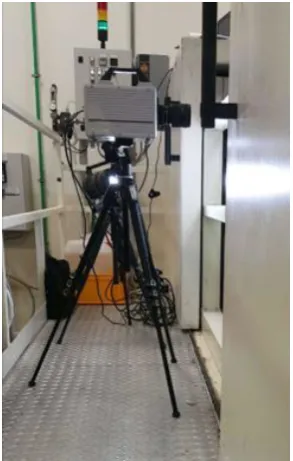
III.1 SPECIFICATIONS AND EXPERIMENTAL SETUP A Photron Fastcam SA4 high speed camera along with Photron Fastcam Viewer (PFV) software was used to determine the amplitude of vibrations of the trough. The PFV software, with a framerate of 1000 fps and a resolution of 1024 x 1024 pixels was used to capture video images, which was then imported to Photron Fastcam Analysis (PFA) software to perform the analysis of the displacement of the trough from its mean position. The PFA software uses an image correlation algorithm to analyze the displacement motion. A scale as shown in figure 13 was setup with a known distance between two points to calibrate the units for displacement measurement. In this study, the tracker particle was set at the circle above ‘2’ in the amplitude sticker as shown in figure 15. The PFA software identifies this tracker particle and notes down its coordinates and surrounding pixels, which further identifies and matches the template of the first image in the second one and so on. In this way, the value of the displacement is calculated based on the calibrated scale. The field of view of the camera was kept perpendicular to the vibratory trough directly facing the amplitude sticker which was at the center of the trough. The camera setup is shown in figure 14 and a screenshot of the PFA software is shown in Figure 15. This process of recording and analyzing the videos was repeated three times for each of the RPM dial positions 2 and 10- with and without media loaded. A sample amplitude-time plot as that obtained from one of the trial runs when the machine was loaded with 300 kg super polishing media and run at RPM dial 2 is shown in Figure 16.
[image:5.595.320.544.50.201.2]Fig.14. High Speed Camera Setup
[image:5.595.333.529.237.363.2]Fig.15. Screenshot of PFA software showing displacement (amplitude)
Fig.16. Amplitude-time plot III.2 RESULTS
The RPM readings noted at the speed dial positions 2 and 10 from the control panel of the vibratory trough without media loaded, the corresponding amplitude as shown from the amplitude sticker and the displacement/amplitude as calculated from the PFA software are shown in Table 4.
TABLE4
AMPLITUDE VALUES WITHOUT MEDIA
Table 5 shows the RPM and amplitude readings with 300 kg of super polishing media loaded into the vibratory trough.
TABLE5
AMPLITUDE VALUES WITH MEDIA
Speed dial
position RPM
Amplitude sticker reading
(mm)
Average amplitude reading from
PFA (mm)
2 886 5 5.22
10 1500 5 5.32
Speed dial
position RPM
Amplitude sticker reading
(mm)
Average amplitude reading from
PFA (mm)
2 886 5 5.82
[image:5.595.100.247.482.713.2] [image:5.595.300.553.508.583.2]III.3 DISCUSSION
A high speed camera was used to determine the amplitude of vibrations. It can be clearly seen that the PFA software can predict amplitude well and more accurately. This is a more efficient and precise way of obtaining the amplitude setting of a vibratory machine for a given flyweight setting of the vibratory motor. The amplitude sticker on the machine is based on the observation skills of the user and is read off directly from the machine.
An important finding of this amplitude study using high speed camera was that the amplitude of vibrations decreased when 300 kg of media was loaded into the container. This is attributed to the overall weight of the machine being increased and hence the greater inertia to displace it from its mean position when the machine is in operation.
IV. MAIN CONCLUSIONS
The two important parameters of a vibratory finishing trough-namely frequency and amplitude were monitored through the use of uniaxial accelerometer and high speed camera respectively. The main findings of this study are as summarized as follows:
1) Vibrations in a vibratory trough are three-dimensional with one direction (Z) being the dominant one
2) The uniaxial accelerometer readings, mounted at different points on the trough (with and without media), convey that the vibrations are consistent throughout the trough.
3) Weight of the machine does not affect frequency values- frequency remains the same with and without media
4) The amplitude sticker present on conventional vibratory systems are basic and do not provide readings accurately. A high speed camera can predict the values well.
5) Weight of the machine affects the amplitude of the machine- when the machine was loaded with media, the amplitude decreased even though frequency remained the same.
Further work could be done to determine if the frequency of vibrations of the media inside the trough are the same as those obtained on the various locations of the trough. Other displacement sensors could also be used to study the amplitude of vibrations of the machine. Apart from the two parameters studied in this paper, further research in terms of studying media motion such as forces of media in the bulk of the container and amplitude of media motion for different flyweight settings could be carried out.
ACKNOWLEDGMENT
The authors would like to thank Thomas Haubold, Arthur Wee and Manikanta Rajarathinam Saravanan from Rolls-Royce for their contributions.
REFERENCES
[1] E. Holzknecht, "Everything you need to know about mechanical/mass finishing," Metal Finishing, vol. 107, pp. 27-31, 2009.
[2] L. K. Gillespie, Mass finishing handbook: New York : Industrial Press, c2007.1st ed., 2007.
[3] S. Wang, R. S. Timsit, and J. K. Spelt, "Experimental investigation of vibratory finishing of aluminum," Wear, vol. 243, pp. 147-156, 8/28/ 2000.
[4] J. Domblesky, R. Evans, and V. Cariapa, "Material removal model for vibratory finishing," International Journal of
Production Research, vol. 42, pp. 1029-1041, 2004.
[5] J. Domblesky, V. Cariapa, and R. Evans, "Investigation of vibratory bowl finishing," International Journal of Production
Research, vol. 41, pp. 3943-3953, 2003.
[6] E. Uhlmann, A. Dethlefs, and A. Eulitz, "Investigation of Material Removal and Surface Topography Formation in Vibratory Finishing," Procedia CIRP, vol. 14, pp. 25-30, 1/1/2014 2014.
[7] R. Mediratta, K. Ahluwalia, and S. H. Yeo, "State-of-the-art on vibratory finishing in the aviation industry: an industrial and academic perspective," The International Journal of Advanced
Manufacturing Technology, pp. 1-15, 2015/10/15 2015.
[8] P. P. Kumar and S. Sathyan, "Simulation of 1D abrasive vibratory finishing process," Advanced Materials Research, vol. 565, pp. 290-295, 2012.
[9] B. Nebiolo, "The basics of vibratory bowl set-up," Products Finishing, vol. 70, pp. 41-45, 2005.
[10] A. Yabuki, M. R. Baghbanan, and J. K. Spelt, "Contact forces and mechanisms in a vibratory finisher," Wear, vol. 252, p. 635, 2002.
[11] S. E. Naeini and J. K. Spelt, "Two-dimensional discrete element modeling of a spherical steel media in a vibrating bed," Powder
Technology, vol. 195, pp. 83-90, 2009.
[12] S. E. Naeini and J. K. Spelt, "Development of single-cell bulk circulation in granular media in a vibrating bed," Powder
Technology, vol. 211, pp. 176-186, 2011.
[13] K. Hashemnia, A. Mohajerani, and J. K. Spelt, "Development of a laser displacement probe to measure particle impact velocities in vibrationally fluidized granular flows," Powder Technology,
vol. 235, pp. 940-952, 2013.
[14] M. Sangid, J. Stori, and P. Ferriera, "Process characterization of vibrostrengthening and application to fatigue enhancement of aluminum aerospace components-part I. Experimental study of process parameters," International Journal of Advanced
Manufacturing Technology, vol. 53, pp. 545-560, 2011.
[15] D. Ciampini, M. Papini, and J. K. Spelt, "Characterization of vibratory finishing using the Almen system," Wear, vol. 264, pp. 671-678, 1/1/2008 2008.