Abstract— The paper’s aim is to describe and discuss the results of an experimental investigation of power quality parameters in an exemplary ship. The measurements have been carried out during the disturbing load operation. Particularly, the voltage waveform distortions have been considered, completed by voltage and frequency deviations analysis. In fact, the research has been carried out in order to check the actual level of the distortions after installation of a new power converter for the motor driving ship’s bow thruster. The various configurations of the ship power plant have been taken into account, which means that the number of generating sets working in parallel have changed. Finally, the recommendations for the ship crew have been formulated.
Index Terms— marine electric power system, power quality, voltage distortions
I. INTRODUCTION
HE quality of electricity in the ship power system is defined by the set of parameters describing the processes of production, distribution and usage of electricity on shipboard in all operating conditions (manoeuvring, sea voyage, harbour operation). The power demand during these conditions changes significantly. This leads to necessity of adjustment of the actual power plant configuration to the actual load. Otherwise, one can observe a significant increase in specific fuel consumption. Thus, the number of generating sets working in parallel depends on the actual demand. However, it impacts upon the level of power quality as well, which is determined by interactions between actual supply and actual load. Insufficient quality of electricity usage in a marine electric grid causes deterioration of the production of this energy, and vice versa, i.e. the poor quality of electricity generation deteriorates its use.
The above-mentioned set of power quality indices covers the parameters of voltages and currents (rms value, frequency, asymmetry, waveforms) throughout the whole of
Manuscript received March 06, 2014.
Tomasz Tarasiuk is with the Department of Marine Electrical Power Engineering, Gdynia Maritime University, Morska 81-87, 81-225 Gdynia, Poland (phone: 48 58 6901 470; e-mail: [email protected]).
Andrzej Pilat is with the Department of Marine Electrical Power
Engineering, Gdynia Maritime University, Poland (e-mail:
Mariusz Szweda is with the Department of Marine Electrical Power
Engineering, Gdynia Maritime University, Poland (e-mail:
the analysed system. Obviously, such an extensive monitoring is quite unfeasible and one must limit the number of considered points in the investigated system. The assessment of power quality should be carried out at least on the point of common coupling of generators and all receivers, namely bus bars of the ship’s main switchboard. Any deterioration of power quality on these bus bars would impact upon the operation of the whole system.
Modern ship systems and devices require a reliable electric power supply of standardised quality. It means within permitted limits, provided by rules of ship classification societies, which are to ensure the safety of the ship and its crew as well as help to avoid significant economic losses due to a malfunction of the electricity receivers. The power quality can change during the time of ship exploitation [1], e.g. due to the system overhauling or installation of new receivers. After all major changes, power quality tests are required in order to check conformity of its current level with related provisions of respective classification society rules. Authors of the paper have planned and conducted such tests after installation of the new power converter for the motor driving bow thruster on board the Gdynia Maritime University research-training vessel HORYZONT II. The purpose has been to identify the actual level of power quality during bow thruster operation and provide some recommendations for the ship power plant exploitation. Particularly, the authors measured power quality parameters on bus bars of the main switchboard during various configurations of the power plant, understood in terms of the number of generating sets working in parallel. The chief aim has been to answer the following question:
What is the required minimal number of generators working in parallel during bow thruster operation at HORYZONT II in order to fulfill requirements of the Polish Register of Shipping?
The ship’s system under investigation is shortly presented in Section II of this paper. The rules of the Polish Register of Shipping related to the paper’s purpose are presented in Section III. Results of the research are presented in Section IV. This consists of analysis of voltage and frequency deviations and, particularly, voltage waveform distortion changes considered in the wake of requirements of the Polish Register of Shipping rules. At last, a final recommendation is laid out in Section V.
Experimental Study on Impact of Ship Electric
Power Plant Configuration on Power Quality in
the Ship Power System
Tomasz Tarasiuk, Andrzej Pilat, Mariusz Szweda
II. POWER SYSTEM OF RESEARCH-TRAINING SHIP M/V HORYZONT II
The most typical configuration of a ship power plant is a system composed of at least three synchronous generators droved by auxiliary internal combustion engines. Each generating set is equipped with an independent automatic voltage regulator and governor for speed control. The permissible levels of voltage and frequency deviations under steady-state and non-steady-state conditions are laid out in the relevant requirements of ship classification societies. The power plant of research-training ship HORYZONT II consists of three identical generating sets that are able to work in parallel. The single generating set includes: a synchronous generator with a rated power of 301 kW (376 kVA) driven by a four-stroke diesel engine with a rated power of 357 kW. Rated voltage of the power system is equal to 380 V, and the rated frequency is 50 Hz. Depending on the actual power demand, a single generator or two or three generators work in parallel. The simplified diagram of the power system of the ship HORYZONT II is shown in Fig. 1.
Fig. 1. Electric power system of the m/v HORYZONT II (designations: G1…G3 – synchronous generators, DE1…DE3 – diesel engines, GR – gear, MS – motor of bow thruster, BR – breaker).
All main receivers installed on the vessel are supplied directly from the bus bars of the main switchboard. Among them, one can distinguish: a bow thruster with a rated power of 125 kW, a 55kW squirrel cage motor of a deck crane pump, and a 28kW squirrel cage motor which drives the compressor for air conditioning. Other receivers have smaller power and they have minor influence on power quality parameters. Regarding the waveform distortions, the bow thruster has to be mentioned, since it is supplied via a power converter, which is used to regulate the speed of the electric motor for driving the thruster. Moreover, its rated power is equal to nearly 40% of rated power of a singular auxiliary diesel engine. Therefore, its impact on power quality must not be neglected.
III. POWER QUALITY IN RULES OF POLISH REGISTER OF
SHIPPING – CHOSEN PROVISIONS
The permissible limits of power quality parameters on board the ships classed by the Polish Register of Shipping are laid out in standards [2] and [3]. The former defines limits for voltage and frequency deviations, whereas the latter contains limits for waveform distortions for general-purpose electric power systems as well as systems designed for supplying nonlinear consumers. The following parameters of waveform distortions have been defined (some designations are changed by authors due to simplification reasons):
TWD – total waveform distortion containing all components — harmonics and interharmonics — in the frequency band up to harmonics of the 50th order (in fact it is the ratio of rms value of the residue (after elimination of the fundamental) to the rms value of the fundamental, as defined in [6], [7]);
TWD2.5–10 kHz – combined content of components from
50th harmonic up to 10 kHz;
SGH – content of respective harmonics subgroups.
The instantaneous values of the above-mentioned indices have to be determined (for 200 ms), completed by their aggregated values (for 10 minutes). Finally, their permissible limits are laid out in Table 1 [3].
TABLEI
PERMISSIBLE LIMITS OF DISTORTION PARAMETERS IN GENERAL-PURPOSE SYSTEMS ACCORDING TO POLISH REGISTER OF SHIPPING RULES
General-purpose systems Parameter
200 ms 10 min
TWD 7.5% 5%
TWD2.5–10 kHz 4.5% 3%
SGH 4.5% 3%
In Table I, only parameters related to this paper’s purpose are laid out.
IV. POWER QUALITY ON BOARD HORYZONT II– RESULTS OF EXPERIMENTAL RESEARCH
In order to assess power quality in the electric power system of research-training ship HORYZONT II, the series of measurements on bus bars of the main switchboard have been carried out by authors of the paper. For the aim, National Instruments controller PXIe-8106 equipped with two data acquisition cards PXIe-6124 has been used and three-phase voltages have been registered. The CV3-1500 LEM voltage transducers and LTC 1564 anti-aliasing filters have been applied for input voltage conditioning. The sampling frequency has been equal to 25 kHz for each input channel, and the cut-off frequency of anti-aliasing filters has been equal to 10 kHz.
- IEC 61000-4-7 General guide on harmonics and interharmonics measurements and measuring instruments for power supply networks and attached devices used for the measurements [4];
- IEC 61000-4-30 Testing and Measurement Techniques – Power Quality Measurement Methods [5].
The width of the measurement window (10 cycles for systems with rated frequency 50 Hz) has been evaluated by determining the zero-crossing of the fundamental component, after eliminating the higher-frequency components by means of low-pass filtering. The following parameters were determined: rms value of phase-to-phase voltages Urms, rms value of fundamental components of
phase-to-phase voltages U1, frequency f, the total harmonic
distortion factor THD, total waveform distortion factor TWD, and total interharmonic distortion factor TIHD. THD and TIHD have been calculated on the basis of harmonics and interharmonics subgroups respectively, up to the frequency of the 50th harmonic. However, TWD has been determined up to 10 kHz. Finally, the content of harmonic and interharmonic subgroups has been calculated up to harmonics of the 50th order. The number of distortion factors has been increased in comparison to the Polish Register of Shipping requirements [3]. This enables better assessment of considered cases.
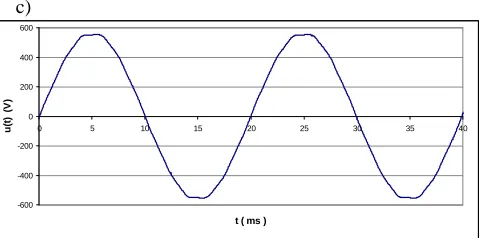
Three configurations of the ship power plant have been considered: one generator working alone and two or three generators working in parallel. In all cases, the load has remained the very same. In fact, the dominant load has been the bow thruster. The exemplary voltage waveforms recorded for bow thruster full load and various power plant configurations are depicted in Fig. 2.
a)
-600 -400 -200 0 200 400 600
0 5 10 15 20 25 30 35 40
t ( ms )
u
(t
)
(
V
)
b)
-800 -600 -400 -200 0 200 400 600
0 5 10 15 20 25 30 35 40
t ( ms )
u
(t
)
(
V
)
c)
-600 -400 -200 0 200 400 600
0 5 10 15 20 25 30 35 40
t ( ms )
u
(t
)
(
V
)
Fig. 2. Exemplary voltage waveforms recorded on bus bars of main switchboard during bow thruster operation for: one generator working (a), two generators working in parallel (b), and three generators working in parallel (c).
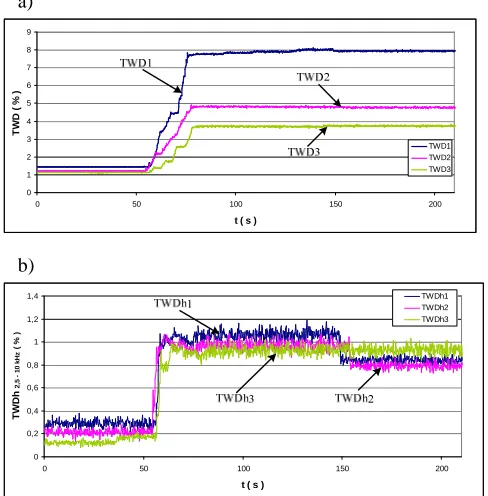
Finally, the measured frequency and rms value of voltage are depicted in Fig. 3 and Fig. 4, respectively. Basic distortion parameters like TWD and TWD2.5–10 kHz are shown
in Fig. 5 for all considered power plant configurations. The parameters represent an increase in the bow thruster load from zero to full load and subsequent operation with rated power.
It has to be added that any significant asymmetry has been found. Therefore, all results are presented for one phase-to-phase voltage. Nevertheless, the conclusions are valid for other channels as well.
379 380 381 382 383 384 385 386 387
0 50 100 150 200
t ( s )
U
_
rm
s
(
V
)
1 generator 2 generators 3 generators
Fig. 3. RMS value of voltage during increasing load of bow thruster and subsequent full load operation for various electric power plant configurations on m/v HORYZONT II (the colour designations are laid out in the figure).
48,8 49 49,2 49,4 49,6 49,8 50 50,2 50,4
0 50 100 150 200
t ( s )
f
(
H
z
)
1 generator 2 generators 3 generators
[image:3.595.307.547.65.184.2] [image:3.595.306.546.387.495.2] [image:3.595.307.545.554.661.2]a)
0 1 2 3 4 5 6 7 8 9
0 50 100 150 200
t ( s )
T
W
D
(
%
)
TWD1 TWD2 TWD3
b)
0 0,2 0,4 0,6 0,8 1 1,2 1,4
0 50 100 150 200
t ( s )
T
W
D
h
2,5
1
0
k
H
z
(
%
)
TWDh1 TWDh2 TWDh3
Fig. 5. Basic distortion parameters during increasing load of bow thruster and subsequent full load operation for various electric power plant configurations on m/v HORYZONT II, total waveform distortion factor
TWD up to 10 kHz (a), and total waveform distortion factor TWD2.5–10 kHz
for frequency band approximately equal to 2.5–10 kHz (b) (the colour designations are laid out in the figure).
Analysis of above figures leads to the conclusion that rms values of voltage, frequencies and TWD2.5–10 kHz factors
assume similar values for all power plant configurations and existing differences can be neglected, although a significant increase of TWD2.5–10 kHz values for bow thruster full load has
to be pointed out. But significant differences appear in the case of TWD factors, with a single rule: fewer generators, more distortions. Next, the components with frequencies below the 50th harmonic have been dominant (compare TWD and TWD2.5–10 kHz values). The profound analysis of the cases
requires calculation and comparison of other parameters as well. The mean values of these parameters, completed by maximum and minimum values (observed for 200ms window), have been determined and laid out in Table II.
The bold fonts in Table II marks the cases of breaching the permissible limits laid out in Table I for instantaneous (200 ms) values and the case of when the permissible level for aggregated 10-minute values can be breached, if full load of the bow thruster would last this very time. This concerns content of the 11th harmonic subgroup during single generator operation. However, it should be firmly stated that typical bow thruster manoeuvring with full load does not last 10 minutes.
The special case is content of the 5th harmonic subgroup during two generating sets working in parallel (marked as italic). Although the acceptable value for 10 minutes of aggregation is lower than the registered mean value, authors are convinced that the value should not adversely impact upon the ship system operation. First of all, other parameters are well into their permissible limits and the very value would be accepted for land systems according to standard [8]. Furthermore, it has been mentioned above that the operation of a bow thruster with full load is shorter than 10
minutes. Therefore, authors are convinced that bow thruster usage during parallel operation of two generating sets should be permitted.
TABLEII
PARAMETERS OF POWER QUALITY MEASURED ON THE BUS BARS OF THE MAIN SWITCHBOARD (DESIGNATIONS:µ– MEAN VALUE, MIN – MINIMUM REGISTERED VALUE, MAX – MAXIMUM REGISTERED VALUE,SGHX
-CONTENT OF HARMONIC SUBGROUP OF X ORDER)
Number of working generators
1 2 3
max 386.8 384.6 384.0
µ 385.5 384.2 383.4
Urms [V]
min 384.5 383.8 382.9
max 8.10 4.87 3.80
µ 7.92 4.79 3.73
TWD
min 7.70 4.72 3.61
max 8.08 4.85 3.77
µ 7.91 4.77 3.70
THD
min 7.68 4.70 3.58
max 0.65 0.53 0.50
µ 0.48 0.41 0.44
TIHD
min 0.32 0.29 0.38
max 1.19 1.07 1.05
µ 0.97 0.89 0.93
TWD2.5–10kHz
min 0.78 0.73 0.84
max 6.17 3.81 3.02
µ 6.00 3.72 2.92
SGH5
min 5.72 3.63 2.80
max 1.01 1.46 1.47
µ 0.87 1.36 1.38
SGH7
min 0.71 1.28 1.28
max 4.22 2.13 1.38
µ 4.05 2.07 1.30
SGH11
min 3.92 1.98 1.23
max 2.78 0.97 0.60
µ 2.62 0.89 0.53
SGH13
min 2.48 0.83 0.46
The values of the voltage and frequency for all configurations of generators are considered safely within acceptable limits for marine applications. The voltage does not differ from the nominal one (380 V) more than 1.79%, whereas the frequency does not differ from the nominal frequency (50 Hz) by more than 1.9%.
[image:4.595.48.292.56.304.2] [image:4.595.311.540.153.572.2]been observed for other considered ship power plant configurations.
0 1 2 3 4 5 6 7
0 50 100 150 200
t ( s )
S
G
H
(
%
)
SGH5 SGH7 SGH11 SGH13
SGH5
SGH11
SGH13
[image:5.595.49.290.89.195.2]SGH7
Fig. 6. Changes of content of harmonic subgroups of 5th, 7th, 11th and 13th order during increase of bow thruster load.
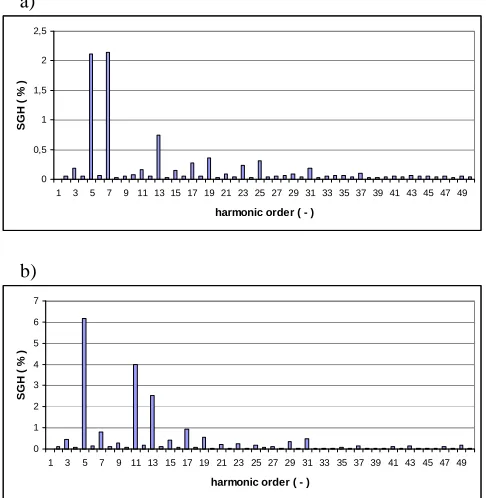
It can be noted that an increase of bow thruster load leads to an increase in all considered harmonics content but proportionality among respective harmonics has not existed, i.e. some harmonics content increases more than other harmonics. For example, content of the 11th harmonic is greater than the 5th for bow thruster idle operation, but during the thruster full load the 5th harmonic is predominant. In order to present the phenomenon graphically, the calculated spectra for two cases have been presented in Fig. 7. The first marked in Fig. 6 by a dashed line represents the maximum value of content of the 7th harmonic subgroup. The second marked in Fig. 6 by a dotted line represents bow thruster full load.
a)
0 0,5 1 1,5 2 2,5
1 3 5 7 9 11 13 15 17 19 21 23 25 27 29 31 33 35 37 39 41 43 45 47 49 harmonic order ( - )
S
G
H
(
%
)
b)
0 1 2 3 4 5 6 7
1 3 5 7 9 11 13 15 17 19 21 23 25 27 29 31 33 35 37 39 41 43 45 47 49 harmonic order ( - )
S
G
H
(
%
)
Fig. 7. Amplitude spectra of voltage for increase of bow thruster load (partial load) (a) and full bow thruster load (b).
Therefore, the changes of the relation between respective harmonics during changes of bow thruster load are clearly discernible in Fig. 7. The very same effect has been observed for a decrease of bow thruster load as well and for other configurations of the ship electric power plant. Especially, the increase of the 7th harmonic content for partial bow thruster load and the subsequent decrease for full
load should be noted. This has been observed for all power plant configurations (see Fig. 8) and clearly depends on characteristics of the installed power converter.
0 0,5 1 1,5 2 2,5
0 50 100 150 200
t ( s )
S
G
H
7
(
%
)
SGH7_1 SGH7_2 SGH7_3
Fig. 8. Changes of 7th harmonic subgroup content during increase of bow thruster load and various electric power plant configurations (SGH7_1 – operation of single generator, SGH7_2 – operation of two generators, SGH7_3 – operation of three generators).
The exemplary spectra of voltages for all considered configurations of the ship electric power plant have been graphically compared in Fig. 9.
0 1 2 3 4 5 6 7
2 4 6 8 10 12 14 1618 2022 24 26 28 30 32 34 36 38 40 42 44 46 4850 harmonic order ( - )
S
G
H
(
%
)
1 generator 2 generators 3 generators 1 generator
2 generators 3 generators
Fig. 9. Amplitude spectra of the voltages measured on bus bars of the main switchboard during bow thruster full load.
It can be seen that for all of the ship power plant configurations, the harmonics of the very same order are predominant, if actual load is comparable.
V. CONCLUSIONS
The presented paper shows the changes of power quality parameters on an exemplary seagoing ship — HORYZONT II — during her bow thruster operation. The measurements were performed on the bus bars of the main switchboard and their results have been analysed in the wake of requirements of related rules of the Polish Register of Shipping. The studies have shown significant changes of the level of voltage distortions, which depends on the actual load and electric power plant configuration. The instantaneous values of the TWD coefficient have been from 1.46% to 8.10%. Moreover, the character of the distortions has varied, i.e. the predominant harmonics have been of various orders depending on the actual bow thruster load, but not electric power plant configuration. Other changes in power quality parameters do not raise major objections.
Finally, the following recommendation has been issued (and supported by the Polish Register of Shipping) for the surveyed ship:
[image:5.595.307.546.100.206.2] [image:5.595.308.549.313.421.2] [image:5.595.47.290.411.660.2]The above conclusion has some consequences beyond the very ship system. The investigated system can be considered representative for other similar microgrids. In such cases, the simplest and the most reliable method of power quality improvement is adding new generators to parallel work. It is a viable solution, if an increase in the overall level of voltage distortions is only temporary, e.g. during ship manoeuvring. In such a case, the resulting increase in specific fuel consumption can be neglected, since its impact on overall system efficiency would be insignificant. Otherwise, application of a passive or active filter has to be considered.
It has to be added that investigation of ship systems’ behaviour, power quality in these systems and observed phenomena is just a good testing ground for future smart grid research and design. It can be stated that development of smart grids, especially development of microgrids as a key building block for smart grids [9], will lead to the emergence of similar problems with power quality, like in the case of modern ship systems.
REFERENCES
[1] Report on the investigation of the catastrophic failure of a capacitor
in the aft harmonic filter room on board RMS Queen Mary 2 while approaching Barcelona on 23 September 2010. Marine Accident
Investigation Branch, December 2011.
[2] Rules for the classification and construction of sea-going ships. Part
VIII Electrical installations and control systems. Polish Register of
Shipping, Gdańsk 2007.
[3] Technical requirements for ship power converters. Polish Register of
Shipping Rules, Gdańsk, 2006.
[4] IEC Standard 61000-4-7 General guide on harmonics and
interharmonics measurements and measuring instruments for power supply networks and attached devices used for the measurements.
[5] IEC Standard 61000-4-30 Testing and Measurement Techniques –
Power Quality Measurement Methods.
[6] IEC Standard 60092-101, Electrical installations in ships. Definitions and general requirement, 2002.
[7] M. Bollen, I. Gu, Signal processing of power quality disturbances, Wiley-Interscience, 2006.
[8] EN Standard 50160 Voltage characteristics of electricity supplied by
public electricity networks.
[9] M. Smith, D. Ton, Key connections – the U.S. Department of
Energy’s microgrid initiative, IEEE Power & Energy Magazine, vol.