Abstract—Agility in supply chain management for
automotive industries is important in order to supply the customer requirements at right time and making the supply chain capable to compete with internal and external competitors. This study finds what the most agile automotive factory in supply chain is. Two approaches, namely, Analytical Hierarchy Process (AHP) and Analytical Network Process (ANP) are applied to propose a framework for recognizing the most agile automotive factory in supply chain. In AHP, the criteria are considered independently but in ANP interdependencies between criteria are also considered. Five criteria, which are involved in this study, are: response to changes, flexibility, competency, economical optimization, and speed. The related sub-criteria are identified by industrial experts and Delphi method. Two models are elaborated using two AHP and ANP approaches considering four suppliers: A, B, C, D factories. Pairwise comparison matrixes are designed in questionnaires for determining the importance degree between criteria and sub-criteria based on Saaty scale (1-9). The validity of questionnaires is also confirmed by industrial experts using Cronbach’s alpha. Questionnaire asks from industrial engineers and production managers to express their opinions through pairwise comparison matrixes about criteria and sub-criteria. The geometrical mean is used to summarize the evaluations. The results of models are valid because the overall inconsistency of models are lower than 0.1 in all matrixes. Finally, regarding to the obtained ultimate weights, the suppliers are ranked. It is identified that factory A with ultimate weight of 50.4% in AHP and weight of 54.2% in ANP models has been selected as the most agile supplier. On the other hand, factory D with 7.2% in AHP and 7.1% in ANP has been recognized as the least agile supplier.
Keywords: Supply Chain Management; Analytical Hierarchy Process; Analytical Network Process; Automotive Industry.
I. INTRODUCTION
N the modern agitated world, change has become as an indispensable part of social and industrial life. Regarding these changes, organizations have found out that they cannot get to their goals with only properly management of their organization. They also need to take part in the management of the network of all suppliers and the network of all companies that do the delivery and also the customer services. Hence the supply change concept is emerged. Organizations generally compete for different aspects such as economical optimization, delivery, flexibility etc [1].
*Faculty of Manufacturing Engineering,
University Malaysia Pahang, 26600 Pekan, Pahang, MALAYSIA
a [email protected], b [email protected]
Successful organization is the one that enjoys competitive advantage in new environments and can adapt itself to customer needs and market changes. This is what is referred to as organization agility and has been considered a lot. Therefore, agility is to be accountable to clients and monitor the market turbulences [2]. An agile supply chain is able to appropriately respond to the environment and in a situation that market demand for products is fluctuating and changing, agility will improve responsiveness in supply chain by increasing the speed and flexibility in diversity of products, and because the product diversity is vast, its proper utilization will bring high marginal profit. Thus, the agility in supply chain is highly important.
This study focuses on agile supply chain. It aims for promoting and improving supply chain management and identifying supply agility evaluation model. The study finds how the agility of supply chain is in automotive industries and what its weaknesses and strengths are.
II. LITERATUREREVIEW
The concept of agility was introduced to the public by Iacocca (1991). The term agile means able to move fast, nimbly, actively, and to be able to think in very quickly and intelligently. However in modern world, it means effective response to unpredicted environmental change and utilizing those changes as an opportunity to improve the organization [3]. Agile production is a concept that has become public and has been accepted by producers that are preparing for a considerable jump as a successful strategy [4]. There are different definitions for Agility. Christopher defines the agility as “an organization’s ability in quick response to the changes in demand, in both volume and variety [5].
Tolone in 2009 believes that agility is “representing the effective combination of supply chain and emphasis on close and long term association between consumers and suppliers. Despite, the diversified definitions of agility, none of them contradict each other [6]. These definitions generally demonstrate the idea of “quickness and change in business environment”. In order to achieve competitive advantage in business environment, besides internal organization, suppliers must align with their customers and suppliers to increase the operations efficiency and collaborate with each other to attain an acceptable level of agility [7]. It is in such state that an agile supply chain forms. An agile supply chain is able to respond to changes in business environment appropriately [3]. Supply chain alludes to material, information, cash, and service flows from row material suppliers, thorough plants and warehouses to the end users and includes organization and processes the produces goods, information, and services and delivers them to customers [8]. Jafarnejad in 2007 defined
Comparative Study of AHP and ANP on
Multi-Automotive Suppliers with Multi-Criteria
Amir Azizi*, a, Razieh malekib
that agility in supply chain is “the ability of a supply chain to react rapidly to the change in market and customer needs” [9]. In the literatures on supply chain agility, one aspect of agility has been chosen and developed. For example, Bal et al. in 1999 emphasized only on virtual groups to create agility [10]. Tolone in 2000 supported the role of real time and simultaneous collaboration technologies to allow the producers to increase agility in their supply chain [6]. Svensson highlights the confidence inside the collaborating supply chain network to create an agile supply chain [11]. Stratton and Warburton emphasized on the inventory and capacity [12]. Holweg in 2005 stressed the sensitive and responsive role to the current trends in the market and Swafford et al. emphasized the flexibility [13] [14]. Power et al. identified key success factors in an agile supply chain for instance [15]. Ambe in 2010 argued that agile supply chain would be the best supply chain strategy to meet the customer’s expectations when demand is unknown. Also, in an uncertain business setting, competitive advantage will be reached when the stimuli change, flexibility, adaptiveness, and responsiveness are determined through the agile supply chain strategy and when the supply chain strategy is in line with the overall strategy of the business to achieve competitve advantage [16].
Another study dealt with the gap of ambiguity surrounding the aspects and definitions of agility to gain an in-depth understanding of agility by revewing multi-disciplinary litrature. The results indicate that supply chain nimbleness of a company consists of five separate dimensions, that is, alertness, accessibility, decisiveness, swiftness, and flexibility [18].
III. METHODOLOGY
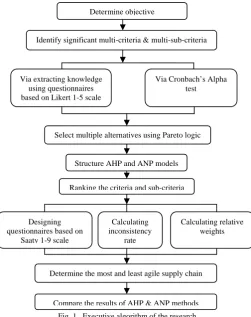
From the method perspective and the circumstances that the data are gathered, this research is descriptive-survey. Mathematical modeling and tools has been used. In order to identify the automotive enterprise with the most agile supply chain, two methods namely AHP and ANP are applied. The main framework in this research is depicted in Fig 1. The statistical population used in this research is based on Cochran's formula including 79 experts and senior executives in A, B, C and D factories.
[image:2.595.304.556.47.365.2]According to the research executive algorithm, after choosing the objective, in order to identify the effective criteria and sub-criteria on agility of the supply chain from experts and the statistical population directors cited based on Likert spectrum five scales were asked. Reliability of the questionnaires was examined using Cronbach's Alpha. In order to determne the relative importance of each effective criteria and sub-criteria, the paired comparison, several questionnaires were prepared. Due to the large number of questions to be answerd, only five experts in every factory replied the questioners based on Saaty scale. The rate of incompatibility questionnaires and their relative weights was measured using the Super Decisions Software. Reliability of the questionnaires is examined by Cronbach's Alpha. In order to determine the important weights of effective criteria and sub-criteria, the paired comparison questionnaire was prepared.
Fig. 1. Executive algorithm of the research
The inconsistency rate of the questionnaires and their relative weight in AHP method are calculated in Expert Choice Software, and in ANP method are calculated using Super Decisions Software. All collected data was achieved by consensus of expert judgments.
A. Analytic hierarchy process (AHP)
AHP first breaks up the difficult and complicated problems into simple ones and then solves them which the objective is placed at the top level and criteria and suppliers are placed in the next levels.
B. Analytic network process (ANP)
ANP is a Multi-Criteria Decision Making (MCDM) technique that has been proposed by Saaty (2004) for the MCDM problems in which there exists relationship and correlation among the different levels of decision making (Goal, decision criteria and sub-criteria, and alternatives) [19]. It is in fact an extension of AHP. The basic assumption in AHP is that the relationship amongthe decision levels is unidirectional and hierarchical. But many decision problems cannot be formed as AHP, because there are internal and externalrelationships and inter-relationship among elements in decision levels. In ANP the measurement of relative importance quantities is done via paired comparisons and scale 1 to 10 [20]. One can notice structural differences in ANP and AHP in Fig.2, clusters represent decision levels and straight lines show the interactions among these levels. The direction of arcs shows the dependencies and loops show the interdependency of elements in each cluster.
(a) AHP (b) ANP
Fig. 2. Linear Structure (a), nonlinear structure or network structure (b) Determine objective
Identify significant multi-criteria & multi-sub-criteria
Via extracting knowledge using questionnaires based on Likert 1-5 scale
Via Cronbach’s Alpha test
Select multiple alternatives using Pareto logic
Determine the most and least agile supply chain Structure AHP and ANP models
Ranking the criteria and sub-criteria
Designing questionnaires based on
Saaty 1-9 scale
Calculating inconsistency
rate
Calculating relative weights
[image:2.595.312.520.721.772.2]In order to show the interdependencies and interactions among decision levels in ANP technique, super- matrix is applied to determine the relative importance for criteria and prioritize the suppliers. A super- matrix is in fact a partitioned matrix in which each matrix entry indicates the relationship between two decision levels (two clusters) in overall decision problem. In other word, super- matrix is the collective effects of elements of one cluster to the elements of the other cluster thorough priority vector, which is the eigenvector of the paired comparison matrix [19]. In super- matrix, when the paired comparisons among decision levels elements are entered, in the case that the sum of a columns becomes more than unity, the unweighted super- matrix is formed. In order to calculate the limit matrix in next steps, we have to change the sum to 1. The next step is to multiply the weight of each cluster, which is figured out from the paired comparison matrix of the cluster, by the weight of the elements of that cluster to obtain the priority of one element among all the clusters. Finally, to achieving the final prioritization of the alternatives, determining the relative importance of decision criteria and problem-solving, the weighted matrix can be achievd infinitely as long as the limited matrix is achieved [20].
A. Criteria and sub- criteria
The criteria and sub-criteria are identified in TABLE I.
TABLEI
IDENTIFIED CRITERIA AND SUB-CRITERIA
Criteria
Sub-Criteria
Responsiveness
Strategic Thinking Sensitivity to Change Virtual Enterprise
Knowledge Management and IT
Flexibility
Product Development Sourcing
Production Logistics
Competency
Learning Motivation System/Structure/Process Integrating Mechanisms Culture of Sharing
Economical optimization
Financing Costs Logistics Costs Delivery Costs
Speed
The pace of product introduction On time delivery
Operation speed
IV. ANALYSIS USING AHPMETHOD
Step 1: forming the hierarchy. This hierarchy includes: 1) Goals: identifying the most agile supply chain in
automotive industry
2) Criteria: five criteria are responsiveness, flexibility, competency, economical optimization, and speed 3) Sub-criteria: 18 sub-criteria are considered as
shown in Fig 3.
4) Suppliers: A, B, C, and D factories.
[image:3.595.309.552.51.475.2]
Fig. 3. AHP hierarchy structure
Step 2 prioritizing criteria and sub-criteria
The three paired comparison matrices are as follows:
‐ paired comparison matrix for criteria based on goals
‐ paired comparison matrix for sub-criteria based on criteria
‐ paired comparison matrix for alternatives based on sub-criteria
For the paired comparisons, nine questionnaires are designed with interval scale for criteria and sub-criteria and submitted them to five experts as decision makers from all factories as alternatives.
The experts filled the questionnaires according to their preferences or the importance of one paired to another on a nine scale basis. Then the inconsistency rate for the matrices was calculated using Expert Choice. It should be less than 0.1 then the result is acceptable and reliable Results of Paired comparison for criteria are presented in TABLE 2. The inconsistency rate is 0.03 which is less than 0.1 and it is acceptable.
For these paired comparisons, nine questionnaires are designed with interval scale for criteria and sub-criteria and submitted them to 5 experts, from A, B, C and D factories, so that they fill them according to their preferences or the
Identifying
the
m
o
st
agile
supply
chain
Flexibilit
y
Res
p
onsive
n
ess
S
p
eed
E
conom
ical
o
p
timization
Com
p
etenc
y Culture of Sharing
Operation speed
On time delivery
The pace of product
Financing Costs Delivery Costs Logistics Costs
Integrating Mechanisms
System/Structure/Process
Learning Motivation
Logistics
Production
Sourcing
Product
Knowledge Management
Virtual Enterprise
Sensitivity to Change
Strategic Thinking
A
D
C
[image:3.595.40.295.379.617.2]importance of one paired to the other on a nine scale basis. Then the inconsistency rate for the matrices was calculated using Expert Choice and in the case it is less than 0.1 the result is accepted and we can rely on them and then calculate their importance weights.
A. Results of Paired Comparison for Criteria
Results of paired comparison for criteria are presented in TABLE II.
TABLEII
PAIRED COMPARISON FOR CRITERIA
Responsive
n
ess
Flexibility
Competency Econom
ical
optimization
Speed
relative weights
Responsiveness 1 3 3 1/2 2 0.274
Flexibility 1/3 1 2 1/2 1 0.140
Competency 1/3 1/2 1 1/3 1/2 0.085
Economical optimization 2 2 3 1 3 0.363
Speed 1/2 1 2 1/3 1 0.138
CR= 0.03
B. Results of Paired Comparison for Sub-Criteria
Results of paired comparison for responsiveness sub- criteria are shown in TABLE III.
TABLEIII
PAIRED COMPARISON FOR RESPONSIVENESS SUB-CRITERIA
Str
ategic T
h
inking
Sensitivity to
Change
Virtu
al En
te
rp
rise
Knowledge Managem
ent
relative w
eights
Strategic Thinking 1 2 4 2 0.418 Sensitivity to
Change 1/2 1 4 3 0.330 Virtual Enterprise 1/4 1/4 1 1/3 0.078
Knowledge Management
1/2 1/3 3 1 0.175
CR= 0.06
Results of paired comparison for flexibility sub- criteria are shown in TABLE IV.
TABLEIV
PAIRED COMPARISON FOR FLEXIBILITY SUB-CRITERIA
Pr
oduct
Developm
e
nt
Sour
cing
Production L
ogistics
relative weights
Product
Development 1 2 2 1/3 0.236 Sourcing 1/2 1 1/2 1/2 0.135 Production 1/2 2 1 1/3 0.168 Logistics 3 2 3 1 0.461
CR= 0.08
Results of paired comparison for economical optimization sub- criteria are tabulated in TABLE V.
TABLEV
PAIRED COMPARISON FOR ECONOMICAL OPTIMIZATION SUB-CRITERIA
Financing Costs Logistics Costs Delivery Costs relative weights
Financing Costs 1 4 5 0.674 Logistics Costs 1/4 1 3 0.226 Delivery Costs 1/5 1/3 1 0.101
CR= 0.08
Results of paired comparison for competency sub- criteria are exposed in TABLE VI.
TABLEVI
PAIRED COMPARISON FOR COMPETENCY SUB-CRITERIA
L
ear
ning
Motivation
System/Structure
/Process
Integr
ating
Mechanisms
Culture of Shar
ing
relative w
eights
Learning
Motivation 1 2 2 1/3 0.104 System/Structure
/Process 1/2 1 1/2 1/2 0.439 Integrating
Mechanisms 1/2 2 1 1/3 0.146 Culture of Sharing
3
2 3 1 0.311
CR= 0.05
Results of paired comparison for speed sub- criteria are presented in TABLE VII.
TABLEVII
PAIRED COMPARISON FOR SPEED SUB-CRITERIA
The pace of pr
oduct
On time delivery Operation speed relative weights
The pace of product 1 1/2 1/4 0.149 On time delivery 2 1 1 0.376 Operation speed 4 1 1 0.474
CR= 0.05
C. Results of Paired comparison for suppliers
Since the paired comparisons for the suppliers are voluminous, only the final result is explained in TABLE VIII.
TABLEVIII
PAIRED COMPARISON FOR SUPPLIERS RELATIVE STRATEGIC
THINKING SUB-CRITERIA
A
B C D relative weights
A
1 3 4 4 0.517
B
1/3 1 3 3 0.260 C
1/4 1/3 1 3 0.142 D
1/4 1/3 1/3 1 0.081
CR= 0.09
Similar to previous paired comparison matrices, in TABLE 8 indicates that inconsistency rate is 0.09 and hence it is acceptable.
TABLEIX
RELATIVE WEIGHT FOR SUPPLIERS RELATIVE TO SUB-CRITERIA
Criteria
Sub-criteria Suppliers
A B C D
Responsive
n
ess
Strategic
Thinking 0.517 0.260 0.142 0.081
Sensitivity to
Change 0.579 0.225 0.125 0.071 Virtual
Enterprise 0.418 0.405 0.121 0.056 Knowledge
Management
0.561 0.260 0.079 0.100
Flexibility
Product
Development 0.568 0.243 0.109 0.080 Sourcing 0.526 0.297 0.102 0.075 Production 0.465 0.354 0.117 0.063 Logistics
0.268 0.529 0.134 0.068
Competency
Learning
Motivation 0.590 0.139 0.204 0.067 System/Struct
ure /Process
0.484
0.288 0.156 0.072
Integrating
Mechanisms 0.502 0.306 0.127 0.065 Culture of
Sharing 0.306 0.492 0.125 0.078
E
conom
ical
optimization
Financing Costs 0.548 0.274 0.109 0.070
Logistics Costs
0.524 0.312 0.085 0.079
Delivery Costs
0.476 0.349 0.115 0.059
Speed
The pace of
product 0.521 0.317 0.108 0.054 On time
delivery 0.521 0.317 0.108 0.054 Operation speed 0.460 0.341 0.128 0.070
C. The final weight of suppliers using AHP method
The final weight of suppliers is presented in TABLE X.
TABLEX
THE FINAL WEIGHT OF SUPPLIERS USING AHP METHOD
The final weight of suppliers A
(0.504)
B (0.307)
C (0.117)
D (0.072)
TABLE 10 shows that A has the highest score (0.504). Hence it has the most agile supply chain among automotive suppliers based on AHP method.
V. ANALYSIS USING ANPMETHOD
Step 1: determine the goal
The goal is to identify the most agile supply chain in automotive industry.
Step 2: Determine the evaluation clusters There are three clusters that are:
‐ Criteria clusters
‐ Sub-criteria clusters
‐ Alternative clusters
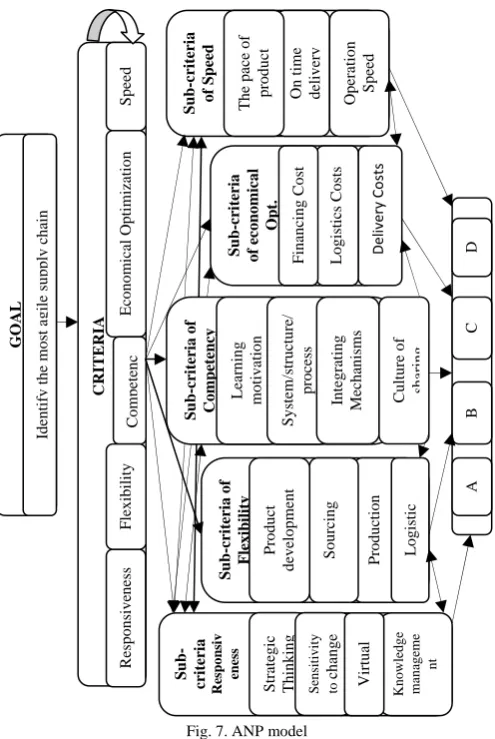
There are five criteria, 18 sub-criteria, and four suppliers. Step 3: the feedback model is applied and the decision network is designed using Super Decision Software as shown in Fig 7.
[image:5.595.308.556.57.427.2]In which convoluted arrows represent interdependencies and reciprocal arrows stand for feedback dependencies which should be considered.
Fig. 7. ANP model
Step 4: In order to determine the relative importance between criteria and sub-criteria, initially, paired comparison questionnaire without considering dependencies on a Saaty nine scale basis and the validity of the questionnaire was confirmed by technical working group. Then it was filled in via senior executives. The consensus was made using geometric average (see TABLE II to TABLE VII).
Step 5: considering the internal relationship among criteria, paired comparison matrices formed and utilizing the comments of expert group calculations were done. The results of eigenvalues achieved in this stage were used in constructing the super-matrix.
Results of Paired comparison matrix for internal dependencies between criteria and responsiveness criteria are shown in TABLE XI.
TABLEXI
PAIRED COMPARISON MATRIX FOR INTERNAL DEPENDENCIES BETWEEN
CRITERIA AND RESPONSIVENESS CRITERIA
Responsiveness
Flexibility
Competency
E
conom
ical
optimization
Speed
relative weights
Flexibility 1 2 1/2 1 0.220
Competency 1/ 2
1 1/3 1/
2 0.119 Economical
optimization 2 3 1 3 0.460
Speed 1 2 1/3 1 0.200
CR= 0.02
GO
AL
Identif
y
the most a
g
ile su
pp
ly
chain
CRITERIA
Responsive
n
ess
Speed
E
conom
ical Optimization
Competenc
Flexibility
Sub-cri
teria
of Speed
On time deli
ve
ry
The pace of pr
oduct
Operation Speed
Sub-cri
teria
of economical
Opt
.
Deliver
y
Co
sts
Logistics Costs
Financing Cost
A
B
C
D
Sub-cri
teria of
Flexibility Sour Production
cing
Pr
oduct
developm
ent
L
ogistic
Sub-criteria Respon
si
v
enes
s
Strategic Th
inkin
g
Sens
it
ivi
ty
to
change
K
now
ledg
e
mana
ge
me
nt
Virtual
Sub-cri
teria of
Competency L
ear
ning
motivation
System/structure/
pr
ocess
In
tegr
ating
Mechanisms Culture of
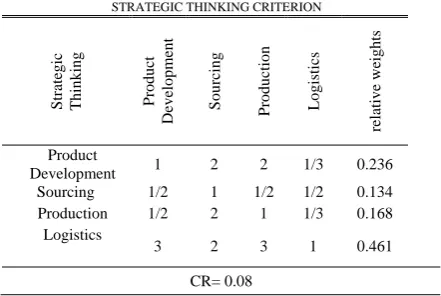
Results of paired comparison matrix for external dependencies and strategic thinking criterion are presented in TABLE XII.
TABLEXII
PAIRED COMPARISON MATRIX FOR EXTERNAL DEPENDENCIES AND
STRATEGIC THINKING CRITERION
Strategic Th
inking
Pr
oduct
Developm
ent
Sour
cing
Production L
ogistics
relative w
eights
Product
Development 1 2 2 1/3 0.236 Sourcing 1/2 1 1/2 1/2 0.134 Production 1/2 2 1 1/3 0.168
Logistics
3 2 3 1 0.461
CR= 0.08
Step 6: After all paired comparisons, un-weighted, weighted and limited, super-matrices, are achieved. In super-matrix, when importing paired comparisons made between elements of decision-making, if the sum of the columns is more than 1 then un-weighted super-matrix is obtained that in which case the sum of columns shall be united, and to this end, each cluster, the weight can be achieved through clustering of paired comparisons and multiple in the weight that cluster. With this technique, the priority of an element in a flower clusters is obtained and ultimately, to achieve the final ranking the suppliers ,determining the relative importance of criteria in decision-making and problem-solving, weighted super-matrix will need to be extremely, thus the limited super-matrix is obtained.
Step 7: determining the best alternative
The final weight of suppliers using ANP method is shown in TABLE XIII.
TABLE XIII
Suppliers ranking using ANP method Suppliers
The final weight of normal The final weight of ideal A
0.542 1
B
0.274 0.506
C
0.112 0.207
D
0.072 0.133
According to the obtained weights, it is clear that A factory possesses the most agile supply chain.
VI. CONCLUSION
In this article, the most agile supply chain in automotive industries using AHP and ANP methods has been discussed. Thereby, five-centered responsibility, flexibility, competency, economical optimization and speed as the main criteria to identify supply chain agility and 18 sub-criteria were considered based on four suppliers: A, B, C and D factories. Initially, the hierarchical structure into one-way was designed and incompatibility rates and their weights are calculated using Expert Choice Software and the suppliers were ranked based on AHP method. Then network structure with regarding to the dependencies of the internal and external designed and inconsistency rate and their weights using Super Decisions Software has been calculated. Finally, the suppliers were ranked based on ANP method. Factory A possesses the most agile supply chain in automotive industry based on AHP indicated by 50.4% weight and in ANP indicated by 54.2% weight. The least
agile supply chain belongs to factory D based on AHP (weight is 7.2%) and ANP (weight is 7.1%). Factories; A and B are able to efficiently respond to the environmental change, based on their agile supply chain. On the contrary, factories; C and D, which are not agile, increasing agility, will have direct effects on reducing the delivery time, increasing customer satisfaction, and decreasing inventory level. Thus, these suppliers need to implement more effective strategies for finding the bottlenecks where there exists malfunction and respond to the rapid changes in supply chain, in line with business process reengineering. They also can entice their employees to be creative and introduce new ideas and also allure weaker companies in their supply chain to emulate more agile and stronger companies.
REFERENCES
[1] Wheel Wright, S. C., “Manufacturing strategy: defining the missing link”, Strategic Management Journal, 1984, 5(1), 77-91
[2] Van Hoek, R. I., 2001, "Epilogue-Moving forward with agility", International Journal of Physical Distribution & Logistics Management, 31(4), 290-301 .
[3] Agarwal, A., Shankar, R., & Tiwari, M. “Modeling agility of supply chain”, Industrial Marketing Management, 2007, 36(4), 443-457 . [4] Braunscheidel, M. J., “Antecedents of supply chain agility: an
empirical investigation”, State University of New York at Buffalo, 2005.
[5] Christopher, M., & Towill, D., “An integrated model for the design of agile supply chains’, International Journal of Physical Distribution & Logistics Management, 2001, 31(4), 235-246.
[6] Tolone, W. J., “Virtual situation rooms: connecting people across suppliers for supply-chain agility”, Computer-Aided Design, 2000, 32(2), 109-117.
[7] World watch institute, Globalization straining planets health, news release, 2002.
[8] Power, D. J., Sohal, A. S., & Rahman, S.-U, “Critical success factors in agile supply chain management-An empirical study’, International Journal of Physical Distribution & Logistics Management, 2001, 31(4), 247-265 .
[9] Jafar Nejad and et al., “Organizational agility and agile manufacturing”, book publishing Mehraban firm, 2007, No.4.
[10] Bal, J., Wilding, R., & Gundry, J, “Virtual teaming in the agile supply chain”. International Journal of Logistics Management, The, 1999, 10(2), 71-82.
[11] Svensson, G, Perceived trust towards suppliers and customers in supply chains of the Swedish automotive industry. International Journal of Physical Distribution & Logistics Management, 2001, 31(9), 647-662.
[12] Stratton, R., & Warburton, R, “The strategic integration of agile and lean supply”, International Journal of Production Economics, 2003, 85(2), 183-198.
[13] Holweg M., “The three dimensions of responsiveness”, International Journal of Operation & Production Management, Vol, 2005, 25, No.7 [14] Swafford, P. M., Ghosh, S., & Murthy, N., "The antecedents of supply chain agility of a firm: scale development and model testing", Journal of Operations Management, 2006, 24(2), 170-188.
[15] Power, D. J., Sohal, A. S., & Rahman, S.-U., "Critical success factors in agile supply chain management-An empirical study", International Journal of Physical Distribution & Logistics Management, 2001, 31(4), 247-265 .
[16] Ambe, I. M., “Agile supply chain: Strategy for competitive advantage”, Journal of Global Strategic Management, 2010, (7), 5-17. [17] Gligor, D. M., Holcomb, M. C., & Stank, T. P., "A Multidisciplinary Approach to Supply Chain Agility: Conceptualization and Scale Development", Journal of Business logistics, 2013, 34(2), 94-108 . [18] Saaty, T. L, “Fundamentals of the analytic network process
Dependence and feedback in decision-making with a single network”, Journal of Systems science and Systems engineering, 2004,13(2), 129-157.
[19] Gencer, C., & Gürpinar, D, “Analytic network process in supplier selection: A case study in an electronic firm”, Applied Mathematical Modelling, 2007, 31(11), 2475-2486.
[image:6.595.60.281.105.253.2]