Abstract— This paper discusses a life cycle analysis of a thermal power plant to quantify environmental impacts of thermal power production at an old power plant. Coal is used in electricity generation worldwide and many power plants in developing countries are very old. Knowing the life cycle environmental impacts of such power plants is very important since they produce a lot of greenhouse gases. This paper develops life cycle inventories for an old power plant in Africa and identifies ways to minimize coal consumption for the same capacity of power output. A life cycle assessment (LCA) was done for the power plant. The emitted carbon dioxide, sulphur dioxide, nitrous oxides and solid waste have adverse effects on flora, fauna, water bodies and humans. A number of environmental metrics were obtained for the thermal power plant and these form the basis for future comparative and extended studies.
Index Terms— thermal power plant life cycle assessment, environmental management, greenhouse gas reduction
I. INTRODUCTION
HE challenge facing the coal industry in the new century is to continue to deliver the many economic and social benefits of coal, while also reducing impacts associated with its production and use. Electricity production from coal results in detrimental effects not only to humans but also to the environment in general. Gaseous, solid and water emissions are produced at power stations and are discharged to the environment posing great danger to plant and animal life. This paper applies a life cycle assessment tool to evaluate environmental impacts of electricity generation from raw material extraction to final use and disposal at a power station. The paper identifies, quantifies and evaluates all the resources consumed and the associated emissions for the production of electricity from coal at that plant with the objective of improving resource efficiency; reducing emissions to the environment; ensuring that identified eco-efficiency opportunities do not shift environmental impacts to other stages within the product life cycle; developing and implementing cost effective measures to mitigate environmental impacts, and recommending strategies to improve the overall perception of electricity generation from coal to stakeholders, customers, environmentalists, government and community
Manuscript received March 21, 2013; revised April 16, 2013. This work was supported by the researcher’s own research funds.
Charles Mbohwa is an Associate Professor, Department of Quality and Operations Management, University of Johannesburg, Auckland Park Bunting Road Campus, P. O. Box 524, Auckland Park 2006, Johannesburg, South Africa: phone: +27-11-5591202; fax: +27-11-5591307; e-mail: [email protected]
groups. The aim is to avoid encouraging activities that have lower environmental emissions locally which are offset by higher environmental emissions along the product chain. Life cycle assessment has the advantage that it gives an overview of the whole picture of a product’s life cycle. In addition there is need for optimisation of resource usage and minimisation of energy losses to save the scarce available resources.
The country where the plant is one of the major polluters in the region [1] and any opportunities to reduce environmental impacts are important. Understanding the environmental implications of producing electricity from coal is important if any plan to reduce total emissions and resource consumption in the electricity industry is to be effective. Thermal power stations emit carbon dioxide , sulphur dioxide and nitrous oxides which damage the human respiratory system and cause other illnesses. The emissions from the electricity producing industry in the country are not scientifically estimated and this work will attempt to do so using a life cycle assessment methodology.
II. LITERATURE REVIEW
Life cycle assessment (LCA) is a systematic method that helps to identify, evaluate and find ways to minimise the environmental impacts of a specific process. It is an evaluation of the impacts on the environment generated by a process throughout the life cycle. Material and energy balances are used to quantify the emissions, resource consumption, and energy use of all processes between transformation of raw materials into useful products and the final disposal of all products and by-products. The results are then used to evaluate the environmental impacts of the process so that efforts can be focused on mitigating possible effects. The life cycle assessment International Standard Organisation documents that have been used historically are as follows; [2, 3, 4, 5, 6, and 7]
ISO 14040: life cycle principle of framework
ISO 14041: Environmental management-Life cycle assessment-Goal and scope definition and inventory analysis
ISO 14042: Environmental management –Life cycle assessment-Life cycle impact assessment
ISO 14043: Environmental management-Life cycle assessment-Life cycle interpretation
ISO 14048:Environmental management-Life cycle assessment-Life cycle assessment data documentation format
ISO 14049 :Environmental management-Life cycle assessment-Examples for the application of ISO
Life Cycle Assessment of a Coal-fired Old
Thermal Power Plant
Charles Mbohwa
14001
Life-cycle assessment (LCA) is a technique for systematically analysing a product from cradle-to-grave, that is, from resource extraction through manufacture and use to disposal. An inventory phase analyses system inputs of energy and materials along with outputs of emissions and wastes throughout life cycle, usually as quantitative mass loadings. An impact assessment phase then examines these loadings in light of potential environmental issues using a mixed spectrum of qualitative and quantitative methods. The end result is that impact assessment does not measure actual effects of impacts, nor does it calculate the likelihood of an effect or risk. Rather, LCA impact assessment results are largely directional environmental indicators. The accuracy and usefulness of indicators needs to be assessed individually and in a circumstance-specific manner prior to decision making. This limits LCA's usefulness as the sole basis for comprehensive assessments and the comparisons of alternatives. In conclusion, LCA may identify potential issues from a system wide perspective, but more-focused assessments using other analytical techniques are often necessary to resolve the issues.
Life cycle impact assessment examines the environmental and human health effects associated with the stressors quantified in the inventory stage. In classification, the inventory data that can be linked with potential ecological and human health effects are placed into stressor categories. Discovering and establishing a causal relationship between an emission inventory and an impact on the environment is not a component of this work. The purpose of LCA is to inform on known ecological and human health concerns associated with the emissions of a process. In terms of total air emissions, carbon dioxide is emitted in the greatest quantity, accounting for the greatest percentage weight of the total air emissions for all systems in thermal power production. In carbon dioxide terms a typical coal fired power plant emits 943g of CO2 /kWh of electricity generated [8]. Samples of the effluent water from power plants are tested for the following:
COD - the chemical oxygen demand, a measure of the ability to oxidize a substance expressed as an equivalent amount of oxygen in the oxidizing agent consumed by a substance under fixed conditions
pH -to determine if it is within specifications
Total dissolved solids (TDS) –the amount of dissolved solids in the effluent water
Total suspended solids- (TSS) the amount of substances floating in the effluent water
Total hardness
P- alkalinity –alkalinity of the water is determined using phenolphthalein as the indicator
M- alkalinity –determining the alkalinity of the effluent water using methyl red as the indicator
Chlorides – amount of chlorides in the water The expected environmental impacts are briefly discussed as follows: Climate Change: The climate that a region experiences results from a complex set of chemical and physical phenomena in the atmosphere. When heat energy
from the sun enters the earth’s atmosphere, much of the ultraviolet portion is absorbed by ozone in the stratosphere. The short wave radiation that reaches the surface of the earth is absorbed and then emitted as long-wave infrared radiation, warming the troposphere when trapped through absorption by trace atmospheric gases called greenhouse gases. The rest is normally radiated into space [9]. The increase in the concentration of greenhouse gases causes an increase in the mean global temperature. Carbon dioxide, in particular, has increased in concentration and has high greenhouse properties. It is produced from the burning of coal and some of it is sequestered through photosynthesis. A few other tropospheric gases capable of infrared absorption and available in small quantities are methane, nitrous oxide, ozone, and chlorofluorocarbons (CFCs). They are however not insignificant and the global warming potential (GWP) of methane and nitrous oxide for example, are 21 and 310 times the GWP of carbon dioxide on a mass basis, respectively. [9] The global average surface temperature relative to 1990 is projected to increase by 1 to 3.5 degrees Celsius by 2100. Average sea level is projected to rise by between 15 and 19 cm above present levels. [10]
Ozone depletion is a major challenge, since it shields the earth from short wavelength ultraviolet radiation. A 5% decrease in the amount of stratospheric ozone has been predicted to produce 20% more cases of skin cancer, mostly cell carcinoma, per year in the United States [8]. The main ozone depleting substances contain the chlorine atom, nitric oxide, the hydroxyl radical, and the hydrogen atom.
Smog is one of the critical environmental impacts expected from coal power plants. There are two types of smog: photochemical smog and London smog. Photochemical smog consists of a yellow-brown haze, which reduces visibility, and consists of substances that both irritate the respiratory tract and cause eye-watering. Nitrogen dioxide is the chemical responsible for the colour and opacity of the smog, while the substances that irritate both the respiratory tract and cause eye watering include; the ozone, aliphatic aldehydes, and organic nitrates. The following four conditions must all be present simultaneously in order for photochemical smog development; nitrogen oxides (NO)x, sunlight, hydrocarbons and temperatures higher than about 18°C. London smog results mainly from the burning of coal, which releases large amounts of particulates and sulphur dioxide gas. The most devastating occurrence of London smog occurred in London in 1952. Visibility in the centre of the affected area was less than 22 yards. Sulphur dioxide concentrations were as high as 1.3 ppm (parts per million), and total particles of 4.5 mg were recorded. These conditions caused over 4,000 fatalities [11].
the soil by acid rain. Acidic water may release sufficiently high concentrations of aluminium from minerals in the soil resulting in phototoxic concentrations. High concentrations of aluminium may also reduce the uptake of nutrient cations such as Calcium. In areas where the underlying rocks have poor buffering capacity (e.g., granite), lakes and streams the lower the pH becomes, the greater the losses of aquatic life. At a pH less than 4, lakes become suitable habitats for white moss, which forms a thick covering on the lake bottom preventing nutrient exchange between the water and lake sediments. Building structures are corroded by acid rain through reactions with concrete, iron and steel. Even galvanized steel (steel protected with zinc) may experience accelerated corrosion under acidic conditions. Five major gaseous forms of nitrogen compounds released from burning coal for electricity production include nitrogen gas, ammonia, nitrous oxide, nitric oxide, and nitrogen dioxide.
Ammonia is the only atmospheric gas capable of neutralising the acids produced forming ammonium salt particulates of sulphuric and nitric acids. Nitrous oxide absorbs infrared radiation with an estimated global warming potential 310 times (weight basis) that of carbon dioxide. It acts as a catalyst for the depletion of stratospheric ozone, can cause smog [11] and contributes to acid deposition by conversion to nitric acid. Nitrogen dioxide also similarly contributes to acid deposition. The ingestion of nitrates and nitrites can cause relaxation of smooth muscle cells, which can be so drastic that the contractile system is totally inhibited. These compounds can cause blood to pool in the veins so that the heart is not completely filled. Therefore the blood pressure drops and the pulse rate increases. Dilation of blood vessels in the brain leads to headaches. [9]
The combustion of coal is the primary source of sulphur pollutants. Sulphur dioxide is readily adsorbed onto the surface of particulate matter, which acts as catalysts for its oxidation to sulphur trioxide. The sulphur trioxide immediately combines with water to form sulphuric acid. Inhaling these particles can damage the respiratory system. Another sulphur compound, hydrogen sulphide is emitted and is responsible for the tarnishing of copper, silver and other metals. It can lead to corrosion because it is readily oxidised. [9]
Carbon monoxide results from the incomplete combustion of hydrocarbons. It is a highly poisonous, odourless, colourless, tasteless and flammable gas. It is particularly dangerous in that its presence cannot be detected and can be harmful to humans if inhaled. Methane is the simplest hydrocarbon which has an estimated global warming potential of 21 times (weight basis) that of carbon dioxide. It is highly explosive in atmospheric concentrations of 5%-15%. Concentrations of 0.5%-2% may be dangerous, especially in the presence of coal dust. [12]. Methane is also a contributor to photochemical smog. Four moles of ozone, one of the irritant species associated with photochemical smog, may be produced for every one mole of methane that is oxidized [12]. Coal mining is a major source of methane emissions.
Particulate matter is a general term for solid particles of organic and inorganic compounds that are suspended in the atmosphere. If inhaled, large particles (> 2.5 µm) are
removed in the upper respiratory tract. On the other hand, particles that are typical of fossil fuel combustion are much smaller (< 2.5 µm) and are inhaled and travel to the region of the lower respiratory tract where gas exchange occurs. They typically contain toxic substances. [11] Particulates also act as catalysts for the oxidation of sulphur dioxide which leads to acid precipitation. In addition, small particles are responsible for most light scattering and visibility reduction. Solid waste created by a typical 500-megawatt coal plant includes more than 125,000 tons of ash and 193,000 tons of sludge from the smokestack scrubber each year. The waste is usually disposed of in unlined, unmonitored onsite landfills and surface impoundments. Toxic substances in the waste, including arsenic, mercury, chromium, and cadmium can contaminate drinking water supplies and damage vital human organs and the nervous system. One study found that one out of every 100 children who drink groundwater contaminated with arsenic from coal power plant wastes were at risk of developing cancer. [10]
Cooling water discharge from coal-fired power plants is released back into the lake, river, or ocean. This water is hotter than the water that receives it, resulting in thermal pollution which decreases fertility and increases death rates in fish. Typically, power plants also add chlorine or other toxic chemicals to their cooling water to decrease algae growth. These chemicals are also discharged back into the environment and are dangerous to aquatic life. Waste heat: Much of the heat produced from burning coal is wasted. A typical coal power plant uses only 33-35% of the coal's heat to produce electricity. The majority of the heat is released into the atmosphere or absorbed by the cooling water.
III. METHODOLOGY
The system boundaries for this LCA were drawn as broadly as possible; all of the major processes necessary to produce electricity from coal such as coal mining, transportation, chemical usage and storage for the mining and power plant operations were included. The material and energy flows of processes involved in the extraction of raw materials (coal) and the production of electricity are all included. The energy use within the system was tracked so that the net energy production could be assessed.
The system boundary is shown in Figure 1.
Figure 1: system boundary of the study
Only surface coal mining was examined. The information was gathered from the mining company documents. Surface mining machinery is required for stripping, drilling, blasting, excavating, and hauling the coal. Coal preparation involves size reduction of the mined coal and the removal of some ash forming material and rocks as well as very fine coal .The clean coal is then transported to the power plant. Methane, which is stored in the coal seams and surrounding rock strata, is emitted from the coal seam during the mining operations. The amount of methane stored is controlled by the pressure and temperature of the coal seam, and will remain stored until the pressure is reduced during erosion of overlying strata or coal mining activities. In general, large methane emissions are associated with underground mining than with surface mining because the deeper coal beds are under greater pressure and often contain more methane. Usually methane from coal mining is vented to the atmosphere. This is the assumption used in this LCA, although a number of mines have begun to recover some methane for other uses such as power production, fuel use at the mine site or additional natural gas supply. Mines also pose great danger especially to mine workers since the mine might collapse or suffocate. Explosions due to coal dust are also a possibility. The chemicals and materials used at the mine are transported from their point of production to either the coal mine or the Power Plant. The production of these resources is however not included in the LCA study since their effect is negligible. Additionally, the stressors associated with manufacturing the trains and trucks were also excluded.
The inventory assessment for the transportation includes the energy required and emissions generated for the transportation of coal by trains and trucks between the boundaries of the coal mining and power generation areas. Coal transport by trucks is rare and expensive and therefore is assumed to be zero in this analysis. However, some amount of truck transport is used for hauling other items such as chemicals and wastes at the power plant. However they are not considered since their impacts are negligible. The trucks and train use diesel fuel, light fuel oil, and heavy fuel oil, respectively. The resources, energy usage and emissions related to extracting crude oil, distilling it, producing a usable transportation fuel and distributing it to refuelling stations were excluded in the total inventory.
For this analysis, the plant construction and decommissioning were excluded. It is worth noting that during construction, particulate matter emissions were high due to the activities associated with land preparation,
drilling and blasting, ground excavation, earth moving and the building of the power plant. The inventory assessment for the power generation subsystem begins at the plant gate of the power plant and ends with the production of electricity. The power plant resources/inputs, emissions and solid wastes generated in the production of electricity were included in the study. However, no additional materials were included for equipment manufacture and thus no credits were applied for decommissioning the equipment. During the production of electricity from coal , gaseous , liquid and solid waste are produced. The solid waste produced is ash and has to be disposed in landfills. When ash is placed into a landfill, the resulting leachate depends on conditions such as precipitation, leachability of the fly ash, type of fly ash, and soil type. Fossil fuels, metals, and minerals are used in all of the process steps required to convert coal to electricity. For all three systems, coal is used at the highest rate.
Water and oil account for the bulk of the remaining resources consumed. Water at the power plant is used for cooling purposes and for the generation of steam that will turn the turbines for the generation of electricity. Chemical transportation, storage, usage and disposal also pose a great danger not only to those who handle them but also to the general public and the surrounding environment. Safety measures for bulk storage of chemicals need careful planning. Factors to be taken into account include: location of storage site; quantities of chemicals to be used; warning system in the event of a major spillage; protective clothing for those who handle the chemicals. Chemical disposal have adverse effects to the environment if the chemicals are not properly disposed. The chemicals might inhibit growth of vegetation and might also have detrimental effects to the living species in the surrounding area.
The approaches that were employed in the collecting of data included the attachment of one of the authors at the company for one year during the study, consultations with company employees at different levels, the use of ISO 14000 series based methodology and the use of SimaPro software. The project was carried out at the Power Station. Data were obtained through liaising with the Principal Maintenance Engineer, Plant Chemist, laboratory technician, boiler house operators and the stores officer. Some daily logbooks were quite helpful in observing trends and so were laboratory reports. An overview of the day to day activities at the plant was also observed. Shop floor workers were also useful sources of information since they are involved in the day to day running of the plant. The laboratory at the power plant carried out routine daily experiments and these experiments provided some of the necessary inventory data for the project. Mining engineers were helpful in the provision of data about the company. SimaPro software was used to analyse the data and necessary modifications and adjustments were done to reflect local resources and data. A number of problems were faced in carrying out the project. The difficulties include:
Erratic coal supplies at the power station causing production disruptions which affected data patterns
Frequent breakdowns diverting the attention of those
Generation of electricity Coal
transportation Coal mining
Inputs
Inputs
Emission Emissions Emissions
who provided data.
Some of the data was confidential information thus access to it was difficult.
For all three systems, the majority of the water emissions were evenly distributed between the mining and power generation subsystems. The power plant produces a significant amount of water that is treated prior to discharge and thus resulting in minimal waste being discharged to the environment. In general, though, the total amount of water pollutants was found to be small compared to other emissions. The effluent water at the power station is from the underground coal bunkers, softening plant, cooling water ducting and from the station itself. Before being discharged to the environment effluent water is examined to determine its constituents. Execution of a successful LCA study was however faced with many challenges. These include the following
Life cycle assessment needed co-operation between different companies involved and non-co-operation was a challenge tackled.
Lack of familiarity with life cycle assessment techniques on the part of employees
Lack of demonstration projects to show the importance of life cycle assessment
Government policies and regulations that focus on single medium pollutant reductions discourage innovative solutions to pollution reduction and offer incentives for investment in end of pipe technologies.
Confidentiality issues at companies
The data collected were divided into two types, namely foreground data and background data. Data collection is the most demanding part of an LCA study and needs careful planning since important data may be left out from the collection of data. Foreground data refers to specific data needed to model a system. It is typical data that describes a particular system. Background data is data for generic materials and can be found in databases and in literature already available. Inventory data were gathered from all the systems included in the system boundary and was fed into SimaPro software.
IV. FINDINGSANDRESULTS
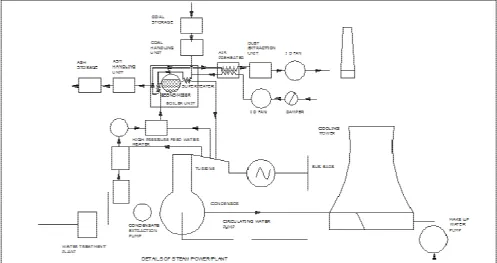
The power plant was built in stages from 1946 to 1957. Up to 1962 the plant was used to supply power to the local network including the local towns. The plant was used as a peaking power station, but of late due to power shortage in the country the station was used as a base station. The main plant is a conventional layout as shown in Figure 2, with the ash dam located uphill of the main station posing a potential threat should it collapse. The coal stock yard is located to the west of the plant and coal dust is continually wind-blown from this area into the plant and the surrounding residential areas.
Health and safety risks at the power station include among other things coal dust related health problems and electrocution. In order to alleviate occurrences of accidents at the power station some of the procedures adopted include the issuing of a work order by the responsible authority
before any job can be carried out. It indicates limitations of access of that area; Medical check-ups for each employee at least once a year; Prevention of electrocution when work is being carried out. Most of the environmental monitoring duties were done by the chemistry department.
To show its commitment to improving its environmental performance and have quality standards in its performance, the power station embarked on a drive to attain ISO quality certification. The aim is to embark on ISO 14001 afterwards. Coal is the main resource consumed at the power station. The coal used at the power station is transported by rail. The distance between the plant and the coal mine colliery is 615 km. After being transported by rail to the power station the coal is off loaded to underground bunkers and conveyed to the boiler’s overhead bunkers by a total of seven conveyor belts. To minimise coal dust, water spraying was done during offloading. Further treatment was done before it gets into the boiler furnace by a fire steam spray to minimise dust emission in the boiler house. Water is the other main input of the power station.
Explosions and fires are not regular occurrences but in the event of them happening they do have detrimental effects on the environment and workers. Electrical fires and coal fires constitute the main risk of fire at the power station. Detection of fires is mainly by smoke detectors in most critical areas. There is a fire fighting team at the power station which holds regular fire-fighting drills to keep alert on any fire cases. There are fire extinguishers strategically located throughout the plant. As a measure to prevent fires no smoking signs are appropriately posted in areas were risks of fire exist. Areas that pose the greatest risk of fire include: coal bunkers, ash basement, boiler house, gas bottle room, stores, fuel pumps and step up transformers, station transformers and unit transformers. The plant does not have a comprehensive emergency plan for dealing with all risk situations that are most likely to be faced by the station. However there are safety signs placed throughout the plant. Activities at the power station result in effluent water, which has to be discharged to the environment. The effluent water is from the softening plant, underground coalbunkers, cooling water ducting, and from within the power station itself. Before discharge effluent water has to be within specific standards so as to minimise the adverse effects by the pollutants to the environment.
Figure 2: The Layout of the Power Station
A. Inventory Analysis
This involves the quantification of all the energy inputs, raw materials, outputs and emissions for the processes involved in the generation of electricity namely: coal mining, coal transportation and the actual generation of electricity at the power station. The functional unit for the data collected is 1 GWh. Erratic coal supplies have hindered continuous generation of electricity. All data collected is normalised to the functional unit. Table 1 presents the gross material consumption for the functional unit and the specific consumption of the power plant and these are comparable to those of similar plants. Table 2 shows the plant specification and Table 3 presents the characteristics of the coal used.
Table 1: Power Plant Resource Consumption
Resource Amount Energy
Intensity
Coal 700 T 6 037kg/GWh
Aluminium sulphate 845kg 80,5kg/GWh
Caustic soda 450kg 42,4kg/GWh
Sodium chloride 560 kg 52,8kg/GWh
Hydrochloric acid 470 kg 44,3kg/GWh
Petrol 780L 73,5L/GWh
Diesel 1240L 116,9L/GWh
Station water m3 1240000 116 981/GWh
Transformer oil 980L 92,4kg/GWh
Table 2: Power Plant information
Plant parameter Data
Plant capacity 100MW
Availability 60MW Coal at 100% operating capacity 1200T/day
[image:6.595.298.540.377.531.2]Power plant efficiency 19%
Table 3: Received coal: bulk density
Free falling compacted
Volume(m3) 4394,13 4394.13
Mass of vessel (T) 254,96 254,96
Mass of vessel and coal(T)
3518,68 4042,39
Mass of coal(T) 3263,72 3769,43
Bulk density(Tm-3) 0,74274 0,85783
Average density =0, 8003 Tm-3
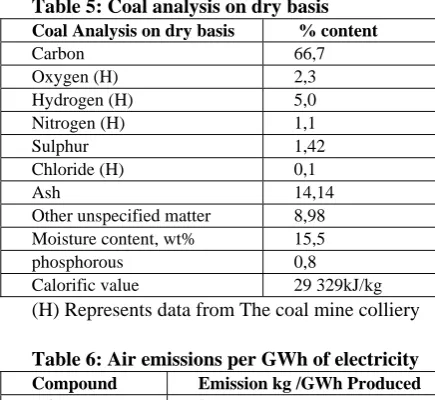
Table 4 indicates the size of the coal used. The percentage of fines at 3.92% is quite low thus the amount of coal dust is minimal. Not all coal energy is converted to electrical energy. Some of the energy is lost through steam leaks, heat loss in effluent water and cooling water. The results of the coal analysis on a dry basis are presented in Table 5 followed by the air emissions per gigawatt-hour of electricity produced in Table 6.
Table 4: Size analysis of the received coal
Size 26 500 19 000 13 200 6 700 3 350 Pan
Mass of sieve and sample(g) 1795,11 2053,55 1777,96 1726,96 1253,85 1289,11
Mass of sieve (g) 1178,36 1178,36 1178,36 1178,36 1178,36 1178,36
Mass of sample (g) 616,75 875,19 599,60 547,78 75,49 101,75
Table 5: Coal analysis on dry basis Coal Analysis on dry basis % content
Carbon 66,7
Oxygen (H) 2,3
Hydrogen (H) 5,0
Nitrogen (H) 1,1
Sulphur 1,42
Chloride (H) 0,1
Ash 14,14 Other unspecified matter 8,98
Moisture content, wt% 15,5
phosphorous 0,8
Calorific value 29 329kJ/kg
[image:7.595.41.262.281.348.2](H) Represents data from The coal mine colliery
Table 6: Air emissions per GWh of electricity Compound Emission kg /GWh Produced
NOX 2,95E-7
SOX 2,32E-7
CO2 1,84E-5
particulates 1,56E-6
The results of the effluent water analysis are presented in Table 7. Effluent 1 is from the softening plant, Generation of electricity at the power station contributes the greatest percentage of global warming accounting for about 78% of
the effects. Coal mining accounts for about 15% and the transportation of coal from the coal mine to the plant accounts for about 5%. The high percentages at the power station are due to the high volumes of coal burnt in the generation of electricity emitting large volumes of waste to the environment. The extensive use of diesel fuel and blasting, account for the greatest emissions during open cast mining. During transportation of coal, diesel is used extensively. However coal dust is emitted along the way and amounts of coal dust are estimates obtained from the amount of coal fines. Effluent 2 is from the power station: effluent 2 has high-suspended solids due to ash cleaning at the station. Effluent 1 and 2 samples were sent to the National Water Laboratory and they were classified as yellow and green respectively.
Coal is transported from the coal mine colliery to the power station by rail. The distance between the coal mine and the power station is 615km. Life cycle analysis measures the input of transportation in ton kilometres. [13] It was assumed that diesel engine-powered trains were used to transport coal. Emissions produced during transportation include coal dust estimated from the amount of coal fines and from the combustion of diesel to emit carbon dioxide, sulphur dioxide and nitrogen oxides. Power coal was mined and consumed at a rate of 200 000 tons per month. The materials consumed per ton of coal produced are indicated in Table 8. Table 9 presents the coal production levels and methane emissions in the coal mine.
Table 7: Effluent water analysis
Parameter I. Effluent 1 variance II. Effluent 2 variance specification
Conductivity 486 +68 250 +83 1500
pH 7,99 0 6,16 0 6,0 –9,0
Chlorides(ppm) 17 =51mg/m3 +83 4 +96 100
Calcium hardness 90 - 60 - -
Total hardness 210 - 100 - -
TDS (ppm) 335 ppm= 1005mg/m3 +33 224 +55 500
TSS (ppm) 8= 24mg/m3 +68 64 -156 25
TS (ppm) 343ppm = 1029mg/m3 +35 288 +45 525
Ammonia(ppm) 0 - 0 - 0,5
Sulphates(ppm) 49ppm = 147mg/m3 +75 74 +63 200
Turbidity 2,0 - 171 - -
PO4 (ppm) 0 - 0 - 1,0
COD 2,6 3,8 60
P- alkalinity 0 - 0 - -
M-alkalinity 140 - 80 - -
Table 8: Resource consumption per tonne of coal produced
Item Ammonium Nitrate
Aluminium Caustic Soda Hydrochloric Acid Limestone Water Diesel Petrol
Kg/Tonne 62.5E-3 16.5E-3 7.4E-3 21.6E-3 42.1E-3 2.67m3/T 1.15L/T 0.25L/T
[image:7.595.44.536.725.777.2]
Table 9: Coal mining outputs and Methane emissions per month
Power coal
production/month
Coking coal production /month
Electrical usage/ month (kWh/ month)
Methane emissions g/kg of coal mined
Underground mining 0 100 000T 780 400 0,96
A. Impact Assessment
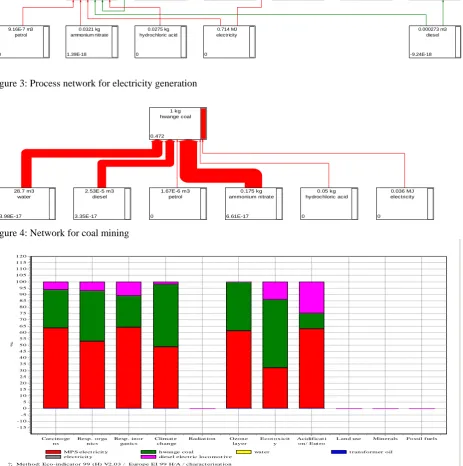
SimaPro software was used to analyse the inventory data. Process trees for the generation of electricity and the impacts associated with the life cycle of thermal generation of electricity were also similarly calculated. The impact assessment results show how the three subsystems (mining coal, transportation and generation) contribute to environmental damage. Figure 3 shows the process network and impact assessment results for the generation of electricity at the power plant. Coal accounts for the greatest
amount of inputs into the generation of electricity. The transportation of coal using a diesel locomotive is also a major contributing factor in the system. Diesel fuel is used extensively in all the three subsystems. The other direct and indirect inputs are water, transformer oil, petrol and diesel use in the plant. Figure 4 presents the results that show the inputs that go into the production of a kilogram of coal during the mining stage. The main inputs are diesel for the heavy plant and machinery, water, petrol, ammonium nitrate in blasting, hydrochloric acid and electricity.
3.59E-8 m3 diesel
0 1.24E-8 m3
petrol
0 1.63E-8 m3
transf ormer oil
-5.89E-17
0.000273 m3 diesel
-9.24E-18 9.16E-7 m3
petrol
0
2.72E3 m3 w ater
-1.1E-16
1 MJ MPS electricity
0.756
0.714 MJ electricity
0 0.0321 kg
ammonium nitrate
1.39E-18
0.266 tkm diesel electric
locomotive
0.0784 0.55 kg
hw ange coal
0.26
0.0275 kg hydrochloric acid
[image:8.595.62.540.192.362.2]0
Figure 3: Process network for electricity generation
2.53E-5 m3 diesel
3.35E-17
1.67E-6 m3 petrol
0 28.7 m3
water
3.98E-17
0.036 MJ electricity
0 0.175 kg
ammonium nitrate
6.61E-17 1 kg
hwange coal
0.472
0.05 kg hydrochloric acid
0
Figure 4: Network for coal mining
?; Met hod: Eco-indicat or 99 (H) V2.03 / Europe EI 99 H/A / charact erisat ion
MP S elect ricit y hwange coal wat er t ransformer oil
elect ricit y diesel elect ric locomot ive
Carcinoge ns
Resp. orga nics
Resp. inor ganics
Climat e change
Radiat ion Ozone
layer
Ecot oxicit y
Acidificat i on/ Eut ro
Land use Minerals Fossil fuels
%
120 115 110 105 100 95 90 85 80 75 70 65 60 55 50 45 40 35 30 25 20 15 10 5 0 -5 -10 -15
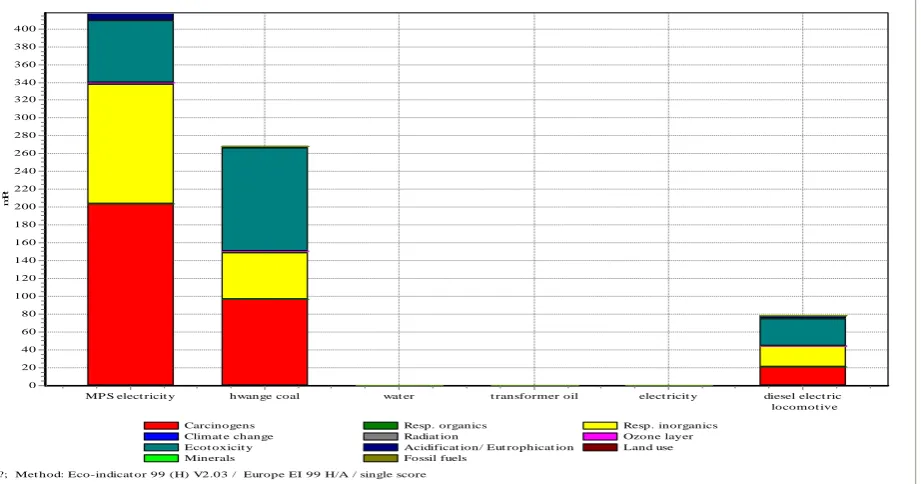
[image:8.595.66.530.296.763.2]Figure 5 shows the damage and characterization results. For carcinogenic emissions electricity generation accounted for about 63% of the emissions, the coal mine 31% and transportation about 6%. On respiratory organics 52% of emissions were from the power station, 40% from mining operations and transportation accounted for about 8%. On respiratory inorganic emissions, the power plant accounted for 63% of the emissions, the coal mine 26% while transportation accounted for 11%. 49% of impacts that contribute to climatic change were emitted at the power station while coal mining had equal impacts and transportation just 2%. The power plant accounted for 61% of the effects on ozone layer depletion, 38% for the mining of coal and transportation a minute 1%. The Power Station accounted for 34% of eco-toxic effects while coal mining accounted for 52% and 14% for transportation. The plant had the greatest effects on acidification accounting for 63%.
Coal mining contributed 30% and transportation 7%. Water, transformer oil and electricity usage had very minimal environmental impacts. Single score results showed that the power plant had the most environmental impacts followed closely by coal mining and then transportation. To enable a comparison between different environmental impact categories, normalisation was done. An analysis of the normalisation results in Figure 6 shows that carcinogeneous emissions had the greatest impacts on the environment. Eco-toxic emissions and respiratory inorganic substances were also emitted in large volumes. Minimal effects were noted on climatic change and on the acidification. Single score analysis was done using the Eco indicator 99(H) method.
The results, in Figure 7, showed that the power plant had the most environmental impacts followed closely by coal mining and then transportation.
?; Met h o d: Eco -in dicat o r 9 9 (H) V2.0 3 / Euro p e EI 9 9 H/A / n o rm alisat io n
MP S elect ricit y h wan ge co al wat er t ran sfo rm er o il elect ricit y diesel elect ric lo co mo t iv e
Carcin o ge n s
Resp . o rga n ics
Resp . in o r gan ics
Climat e ch an ge
Radiat io n Ozo n e lay er
Eco t o x icit y
Acidificat i on / Eut ro p
Lan d use Min erals Fo ssil fuels 8 e-4
[image:9.595.61.551.284.470.2]7 .5 e-4 7 e-4 6 .5 e-4 6 e-4 5 .5 e-4 5 e-4 4 .5 e-4 4 e-4 3 .5 e-4 3 e-4 2 .5 e-4 2 e-4 1 .5 e-4 1 e-4 5 e-5 -2 .0 3 e-1 9
Figure 6: Normalisation of the results
?; Met hod: Eco-indicat or 99 (H) V2.03 / Europe EI 99 H/A / single score
Carcinogens Resp. organics Resp. inorganics
Climat e change Radiat ion Ozone layer
Ecot oxicit y Acidificat ion/ Eut rophicat ion Land use
Minerals Fossil fuels
MP S elect ricit y hwange coal wat er t ransformer oil elect ricit y diesel elect ric
locomot ive
m
Pt
400
380
360
340
320
300
280
260
240
220
200
180
160
140
120
100
80
60
40
20
[image:9.595.75.536.516.758.2]0
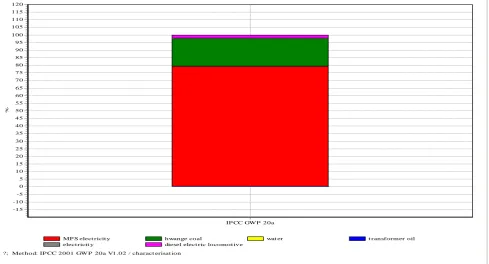
?; Met hod: IP CC 2001 GW P 20a V1.02 / charact erisat ion
MP S elect ricit y hwange coal wat er t ransformer oil
elect ricit y diesel elect ric locomot ive
IP CC GW P 20a
%
120
115
110
105
100
95
90
85
80
75
70
65
60
55
50
45
40
35
30
25
20
15
10
5
0
-5
-10
[image:10.595.72.562.79.343.2]-15
Figure 8: Global Warming Potential Results
Generation of electricity had the greatest percentage of global warming potential accounting for about 78% of the effects. Coal mining accounts for about 15% and transportation about 5%. The high percentages at the power station are due to the high volumes of coal burnt in the generation of electricity emitting large volumes of waste to the environment. The use of diesel fuel and the blasting account for most of the emissions in the mining operations. During transportation diesel is used and coal dust is emitted along the way. Figure 8 presents the global warming potential results.
V. DISCUSSIONS AND RECOMMENDATIONS Life cycle assessment, a directional indicator has been used to note the areas with the greatest environmental burdens within the system boundary. Open cast mining activities at the coal mine contributed to the environmental degradation through blasting and extensive use of explosives. This distorted the topology of the area. Employees were also exposed to hazardous emissions during the mining activities since toxic substances such as coal dust and methane are emitted continuously. Accidents affect not only the environment but also can cause human damage. Recommended damage mitigation steps suggested include land reclamation, regular watering of coal piles to reduce coal dust and fine particles, Methane capture and use, regular medical checkups for employees and community and use of sensing and alarm systems.
Other improvements include coal dust reduction and mitigation, replacement of steam locomotives, better storage of coal, use of wet scrubbers, electrostatic dust precipitators and fabric filters for emission control, use of sulphur scrubbers to trap synthetic gypsum, increasing stack chimney height.
VI. CONCLUSION
Research findings indicate that most of the environmental impact reduction interventions have to be in the power plant, at the coal mine and in the transportation. Electric locomotives can reduce pollution. There is need for further studies such as the uncertainty analysis, disposal scenarios of waste and the inclusion of such issues as social issues and economic issues which were not covered in this analysis. The work contributes to effort to green the electricity production activities in the thermal powered coal plants and can be used for comparisons with other plants.
REFERENCES
[1] The country Herald, 2006, The Business Herald, Thursday 31st
January 2006
[2] ISO 14040, 2000: provides the life cycle principle of framework [3] ISO 14041, 2006 Environmental management-Life cycle
assessment-Goal and scope definition and inventory analysis
[4] ISO 14042, 2006 Environmental management –Life cycle assessment-Life cycle impact assessment
[5] ISO 14043, 2000: Environmental management-Life cycle assessment-Life cycle interpretation
[6] ISO 14048, 2000: Environmental management-Life cycle assessment-Life cycle assessment data documentation format
[7] ISO 14049, 2000 Environmental management-Life cycle assessment-Examples for the application of ISO 14001
[8] Modern Power Systems Magazine, 2005, Modern Power Systems
Magazine, September 2005, Vol. 25 No. 8, Wilmington Publishing House
[9] Taylor B., 1994, The Environmental Management Handbook, Pitman, London
[10] NREL, 2008, The National Renewable Energy Laboratory:
http://www.nrel.gov/docs/fy99osti/25119.pdf Last accessed on 10th
October 201
[11] Clean Coal Centre, 2008, The Clean Coal Centre:
http://www.iea-coal.org.uk Last accessed on 3rd December 2012
[12] Simeons C., 1994, Coal: Its Role in Tomorrow’s Technology
[13] Goedkoop M., De Schryver and Oele M., Report Version 4-