In recent decades, such anthropic activities as combustion of fossil fuels (Karlsson et al. 2017) and overuse of nitrogen fertilizers (Wang et al. 2007) have contributed to the elevated ozone (O3) concentration in the near-ground atmosphere. The rising O3 levels can impact ecosystems and compromise plant growth and crop production (Sarkar and Agrawal 2010). Thus, more attention has been directed to evaluate the effects of elevated O3 concentration on agricultural ecosystem (Mills et al. 2013), i.e., crop productivity (Yi et al. 2016), grain quality (Jing et al. 2016) and plant physiology (Feng et al. 2016). Understanding the responses of soil micronutrients bioavailability and nutrients
uptake in plants to elevated O3 level is very impor-tant, but to date, the information is still lacking. The ozone levels can affect plant nutrient uptake and concentrations in plant tissues. Broberg et al. (2015) summarized the experimental data from Asia, Europe and North America, and concluded that ozone exposure have positive effects on grain mineral (K, P, Ca, Mg, Zn, Mn and Cu) concen-trations. Since micronutrients play important functions in plant growth (Kabata-Pendias 2010), O3 may change micronutrient-involved plant me-tabolism. Besides, O3 stress may correspond to altered plant physiology. The previous studies sug-gest that O3 could suppress chlorophyll synthesis
Elevated ozone level affects micronutrients bioavailability
in soil and
their concentrations
in wheat tissues
Yabo WANG
1, Siyu WEI
1, Yue SUN
1, Wei MAO
2, Tingting DANG
1, Weiqin YIN
1,
Shengsen WANG
1, Xiaozhi WANG
1,*
1
College of Environmental Science and Engineering, Yangzhou University,
Yangzhou, P.R. China
2
Station of Land Protection of the Yangzhou City, Yangzhou, P.R. China
*Corresponding author: [email protected]
ABSTRACT
Wang Y.B., Wei S.Y., Sun Y., Mao W., Dang T.T., Yin W.Q., Wang S.S., Wang X.Z. (2017): Elevated ozone level affects micronutrients bioavailability in soil and their concentrations in wheat tissues. Plant Soil Environ., 63: 381–387.
To investigate the bioavailability of essential micronutrients (Fe, Mn, Cu, Zn) in soil-plant system, sequential scheme of weak acid soluble (WAS), reducible (RED) and oxidizable (OXI) fractions was used to evaluate the bio-availability of micronutrients in different soil depths. The results revealed that at the tillering stage elevated O3 concentration significantly increased WAS-Fe at 0–5 cm and 10–15 cm soils by 69.11% and 59.72%, respectively. At the ripening stage, both WAS-Cu and RED-Cu were significantly increased in elevated O3 treatment compared to control, while WAS-Mn only showed significant in 0–5 cm soil. In bulk soil, WAS-Zn and RED-Zn concentrations were generally greater than those in control, which was more evident at 10–15 cm soil. Besides, O3 decreased the whole plant biomass by 14.63% and increased the root to shoot ratio. Elevated O3 significantly increased grain Fe, Mn and Cu concentrations by 9.37, 36.68 and 48.18%, respectively, while it decreased Zn by 17.09%. It can be in-ferred that altered micronutrients bioavailability in soil and nutrients uptake in plants are likely associated with the changed soil chemical properties and plant physiology in response to the rising O3 level.
Keywords: Triticum aestivum; microelement; nutrition; sequential analysis
and leaf photosynthesis (Back et al. 1999), and disturb translocation and partitioning of carbohy-drates (Zheng et al. 2013). It was found that ozone alone may decrease ethanol-soluble carbohydrate contents in pine needles (Barnes et al. 1990) and change the allocation of macro-and-minor nutri-ents in leaves (Zhuang et al. 2017). More likely, the inhibited plant physiology in the presence of high O3 level is associated with changed nutrient concentrations in plant tissues. A recent study reveals that O3 suppression on plant biomass ac-cumulation may be compensated by the adequate nutrient supply (Kinose et al. 2016). That is, the nutrient supply may mediate plant response to O3 stress (Barnes et al. 1990). Thus, it is vital to ensure adequate nutrient supply from soil to plant since soil is a major source of micronutrients for plants. Nutrient availability in soil under O3 environ-ment may be inhibited as a result of changed soil chemistry and microbiology. To date, the effects of O3 on bioavailability of micronutrients in soil remain unclear.
The bioavailability and solubility of micronu-trients may indicate their availability to plants (McBride et al. 2004). Micronutrients are usu-ally associated with major components of soils (Rutkowska et al. 2014). The Community Bureau of Reference (BCR) procedure is a commonly used sequential procedure that differentiates micro-nutrients into weak acid soluble, reducible (ox-ide-bound), oxidizable (OM-bound) and residual fractions (Bakircioglu et al. 2010), in the order of decreasing bioavailability. To date, few studies have been conducted to illustrate the response of bioavailability of micronutrients to enhanced O3 levels.
In this work, wheat plants were grown in a sandy loam soil and incubated in an O3 purged OTC chamber. The pot experiment was carried out to analyse the micronutrient behavior in bulk soils as well as nutrient uptake by wheat under rising O3 levels. The purposes of this study were to (1) investigate the effects of elevated O3 concentra-tions on bioavailability of Fe, Mn, Cu and Zn in
a wheat-soil system with the BCR technique, and to (2) find out the O3 effects on plant biomass accumulation, grain yield, and nutrient concen-trations in plant tissues.
MATERIAL AND METHODS
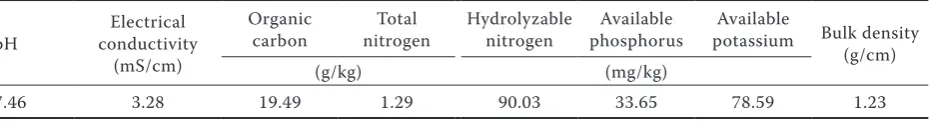
Experimental design. The pot experiment was carried out in the College of Environmental Science and Engineering, Yangzhou University, China (32°31'N, 119°41'E). The soil used (yellow brown soil, Alfisol) was collected from a field with a paddy-wheat rotation agro-ecosystem. The soil texture is sandy loam, comprising of 55.68% sand, 29.40% silt, and 14.92% clay. The total concentra-tions of Fe, Mn, Cu and Zn in soil were 7671.36, 411.90, 39.80 and 113.91 mg/kg, respectively. The physicochemical properties of the tested soil are summarized in Table 1, and were determined by conventional methods (Bao 2000).
Twenty wheat seeds (cv. Yangmai 16) were planted in each pot (upper diameter of 25 cm, bottom di-ameter of 23 cm and height of 30 cm) loaded with 8.5 kg of dry soil that passed a 5 mm sieve. These pots were placed in open top chambers (OTCs) at two ozone concentrations, namely ambient atmospheric (38.5 nmol/mol) and doubled concen-trations (78.5 nmol/mol) to represent the current and future atmospheric ozone concentrations (Feng and Kobayashi 2009). The O3 gas was continu-ously purged between 8:30–17:30 during daytime with an ozone generator (RQ, Ruiqing Ozone, China). The ozone concentration in the chamber was monitored with an O3 monitor (Model 205, 2B Technologies, Boulder, USA) and maintained within ± 10% of target value. The treatments were implemented from February 25 to May 31, 2016. Each treatment had three replicates.
[image:2.595.67.532.696.757.2]Sampling and analysis. Wheat seeds were sown on January 1, 2016 and emerged on January 10. The soil and plant samples were collected on March 16, April 13, May 3 and May 31, corresponding to tillering, jointing, heading and ripening stages of
Table 1. Physicochemical properties of the tested soil
pH conductivity Electrical (mS/cm)
Organic
carbon nitrogenTotal Hydrolyzable nitrogen phosphorusAvailable potassiumAvailable Bulk density (g/cm)
(g/kg) (mg/kg)
wheat growth, respectively. The harvested wheat plants were rinsed with deionized water and blotted dry. The plants were then separated into grains, straw and roots, and were dried in the oven for 24 h at 80°C after 30 min oven-drying at 105°C. The plant tissue samples were digested with a mixture of hydrochloric acid, hydrofluoric acid, nitric acid and perchloric acid (HNO3-HF-HClO4) solutions.
Soil samples were randomly obtained using a 5 cm diameter soil corer in the four growth stages men-tioned above. Considering the root growth of wheat and the penetration ability of ozone on the soil, the impact of elevated ozone level on soil processes at different depths may be different. The soil samples were thus collected in three layers (0–5, 5–10 and 10–15 cm) for analysis, air-dried and passed on a 2 mm sieve. The micronutrients in soil samples were extracted using the BCR schemes (Bakircioglu et al. 2010). All chemicals used in this work were of analytical grade and were dissolved in Milli-Q water (18.2 MΩ) (DI water).
In the BCR extraction method, soil was prepared and extracted as previously reported with modi-fication. Specifically, weak acid soluble (WAS), reducible (RED), oxidizable (OXI) and residual fractions (RES) were extracted with 0.11 mol ace-tic acid, 0.5 mol hydroxyl ammonium chloride, combined 30% hydrogen peroxide and 1 mol am-monium acetate, and aqua regia, respectively. The mixture was vacuum-filtered with a 0.25 μm membrane. The total concentrations of Fe, Mn, Cu and Zn were analysed with an atomic absorption spectrophotometer (Thermo M939QZ/989QZ,
Waltham, USA).
Statistical analysis. Data were analysed with the Microsoft® Excel 2010 package (Microsoft® Inc., Redmond, 2010) and SPSS Statistics 19.0 (IBM, Amon, USA). One-way analysis of variance (ANOVA) and the Duncan’s multiple range tests were used with the SPSS software. The figures were obtained by using the Origin 8.5 (OriginLab, Protable Soft, Hampton, USA). All data were pre-sented at the significance level of 0.05, unless clarified otherwise.
RESULTS
Influence of O3 on the Fe, Mn, Cu and Zn concen-tration in bulk soil. Micronutrients concentrations in bulk soil were dependent on plant development
(Figure 1). The WAS and RED fractions are
consid-ered as two most bioavailable fractions, which are presented to compare with OXI extractable micronu-trients. Overall, the RED-Fe concentrations at three soil depths during plant development were several times greater than WAS-Fe. In all three soil depths (0–5, 5–10 and 10–15 cm), WAS-Fe decreased in the whole plant growth period, whereas the peak concentrations of RED-Fe occurred at the heading stage. At the tillering stage, WAS-Fe at 0–5 cm and 10–15 cm soils with elevated O3 exposure (E) were 69.11% (P < 0.05) and 59.72% (P < 0.05) higher than that in control (A), respectively. At the ripening stage, the RED-Fe content of 5–10 cm soil in E treatment was higher than A by 11.89% (P < 0.05).
The WAS-Mn concentrations in all soil depths were all higher than RED-Mn and OXI-Mn in all growth stages. WAS-Mn increased to the peak concentrations at the heading stage. O3 treatment only showed significant effects as compared to control at top soil at the ripening stage, when rising O3 levels increased WAS-Mn (0–5 cm) by 10.75% (P < 0.01) relative to control. In terms of RED-Mn, O3 significantly increased Mn concen-trations by 40.63% (P < 0.01), 20.67% and 11.03% in 0–5, 5–10, 10–15 cm soil at the ripening stage, respectively, as compared to control.
At ripening stage, both WAS-Cu and RED-Cu were significantly increased in E treatment relative to control. For example, WAS-Cu in E treatment increased significantly by 52.54% (P < 0.01), 67.47% (P < 0.01) and 69.09% (P < 0.01) in 0–5, 5–10, and 10–15 cm soil, respectively.
WAS-Zn and RED-Zn concentrations in E treat-ment were generally greater than those in con-trol, which was more evident at 10–15 cm soil. In the tillering stage, WAS-Zn at both 0–5 cm and 10–15 cm in E treatment were 25.97% (P < 0.05) and 19.19% (P < 0.05) greater than those in con-trol, respectively. RED-Zn from the top to the lowest soil depth was 35.84% (P < 0.01), 42.99% (P < 0.01) and 40.75% (P < 0.01) higher than those in control, respectively. An opposite trend was found in 5–10 cm soil at the ripening stage. For example, the WAS-Zn and RED-Zn at 5–10 cm was significantly decreased by 6.66% (P < 0.05) and 35.49% (P < 0.01) in O3 treatments, respectively.
Figure 1. The concentration of different micronutrients in weak acid soluble fraction, reducible fraction and DTPA-oxidizable fraction at each soil depth. Mean ± standard error; *P < 0.05; **P < 0.01; E – elevated ozone concentration treatment; A – ambient treatment; WAS – weak acid soluble fraction; RED – reducible fraction; OXI – oxidizable fraction; T – tillering; J – jointing; H – heading; R – ripening
0 20 40 60 80 600 900 1200 1500
*
0-5cm E A
Fe
0 20 40 60 80 600 900 12005-10cm Co nte nt o f F e/m g · kg -1*
*
T J H R
0 20 40 60 80 600 900 1200
*
10-15cmT J H R
Growth periods T J H R
*
OXI RED WAS 0 40 80 120 160 0-5cm Growth periods**
**
E A OXI 0 40 80 120 5-10cm RED WAS C ont ent o f M n/ m g · kg -1*
Mn
*
T J H R
0 40 80 120
10-15cm
T J H R
*
T J H R
0 4 8 12 16 20 Growth periods
**
0-5cmCu
**
**
E A 0 4 8 12 16*
**
5-10cm Co nt ent o fC u/ mg · kg -1*
*
**
T J H R
0 4 8 12 16
*
**
10-15cmT J H R
**
*
T J H R
OXI RED WAS 0 6 12 18 24 30
*
0-5cm*
*
**
**
E A Growth periodsZn
0 6 12 18 24*
5-10cm C ont ent o fZ n/ mg · kg -1**
**
*
T J H R
0 6 12 18 24
*
*
10-15cmT J H R
*
*
**
T J H R
*
OXI RED WAS C on te nt o f F e (m g/ kg ) C on te nt o f C u (m g/ kg ) C on te nt o f Z n (m g/ kg )Growth periods Growth periods
WAS RED OXI WAS RED OXI
0–5 cm 5–10 cm 10–15 cm 1500 1200 900 600 80 60 40 20 0 1200 900 600 80 60 40 20 0 1200 900 600 80 60 40 20 0
WAS RED OXI OXI
0–5 cm 5–10 cm 10–15 cm 0–5 cm 5–10 cm 10–15 cm 20 16 12 8 4 0 16 12 8 4 0 160 120 80 40 0 16 12 8 4 0 C on te nt o f M n (m g/ kg ) 120 80 40 0 120 80 40 0 0–5 cm 5–10 cm 10–15 cm WAS RED 30 24 18 12 6 0 24 18 12 6 0 24 18 12 6 0
of soil available micronutrients more than those in control, especially in wheat ripening stage.
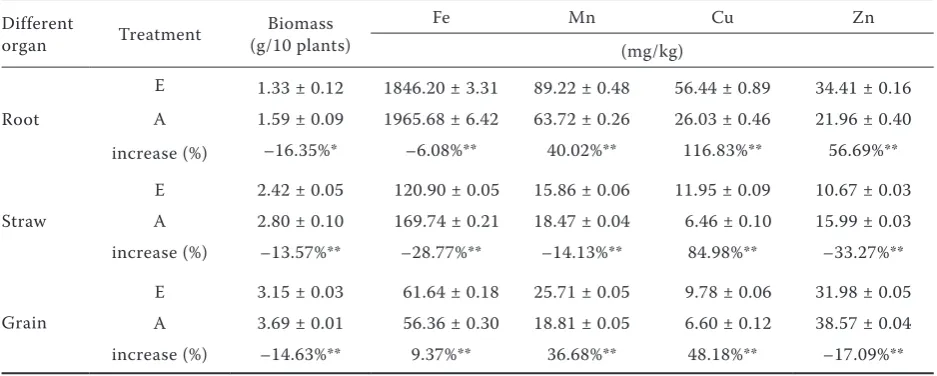
The effects of O3 on wheat biomass and mi-cronutrients concentrations in plant tissues. The wheat plants were harvested at the ripening stage, and plant biomass and metal concentra-tions in plant tissues were measured (Table 2). Overall, O3 stress inhibited root, straw and grain biomass by 16.35% (P < 0.05), 13.57% (P < 0.01) and 14.63% (P < 0.01), respectively, which is in agree-ment of previous observations (Feng et al. 2015). Micronutrients concentrations in different plant tissues were significantly altered when exposed to the elevated O3. Overall, Cu concentrations in different plant tissues were consistently increased in E treatment compared to control. The largest increase occured in roots, whereas the least in grains. In terms of Fe, O3 treatment significantly decreased concentrations in roots and straws, but increased in grains. For Mn in O3 treatment, the concentrations were elevated in roots and grains but decreased in straw. The only element with lower concentration in grains was Zn, which was increased in roots but decreased in straw.
DISCUSSION
Open-top-chamber (OTC-1) is a reliable facil-ity commonly employed to study the response to changed atmosphere (Wang and Liu 1993). Elevated O3 can alter soil properties and plant physiology
i.e. photosynthesis, carbohydrate synthesis and translocation (Kassir et al. 2012). In this study, the contents of micronutrients in individual soil fractions were evaluated with a widely used method (BCR). Moreover, micronutrients uptake was in-dicated by the total elemental concentrations in plant tissues (roots, straw and grains).
[image:5.595.63.532.555.743.2]Regarding micronutrients in bulk soil, the nu-trient bioavailability responded differently to the elevated O3 as a function of growth periods and soil depths. Under O3 stress, bioavailability of soil micronutrients is controlled by the combined effects of soil physical and chemical properties (Dotaniya and Meena 2015). Rising O3 may cause cellular damages to plant leaves, which reduces photosynthetic production of carbohydrates. In our study, O3 treatment resulted in 14.6% reduction of total dry biomass relative to control (Table 2). This changed the quantity of plant tissues in surface soil. It has been reported that ozone pollution changed the C/N ratio of plant tissues (Zheng et al. 2014) and increased the mineralization of soil organic carbon (SOC) (Fuhrer and Booker 2003). Since micronutrients tend to complex with SOC, their mobility and bioavailability are inevitably responsive to the change of SOC. The SOC miner-alization may also be associated with the increased soil pH (Wang et al. 2012), which could affect the speciation as well as bioavailability of micronutri-ents (Narteh and Sahrawat 1999, Kabirinejad et al. 2014). Besides, O3 may change the composition and amounts of root exudes, which may alter their
Table 2. The influence of elevated atmospheric ozone on the biomass of different organs and micronutrients concentrations at the ripening period of wheat
Different
organ Treatment (g/10 plants)Biomass
Fe Mn Cu Zn
(mg/kg)
Root
E 1.33 ± 0.12 1846.20 ± 3.31 89.22 ± 0.48 56.44 ± 0.89 34.41 ± 0.16 A 1.59 ± 0.09 1965.68 ± 6.42 63.72 ± 0.26 26.03 ± 0.46 21.96 ± 0.40 increase (%) –16.35%* –6.08%** 40.02%** 116.83%** 56.69%**
Straw
E 2.42 ± 0.05 120.90 ± 0.05 15.86 ± 0.06 11.95 ± 0.09 10.67 ± 0.03 A 2.80 ± 0.10 169.74 ± 0.21 18.47 ± 0.04 6.46 ± 0.10 15.99 ± 0.03 increase (%) –13.57%** –28.77%** –14.13%** 84.98%** –33.27%**
Grain
ability to combine with and mobilize micronutri-ents in soil (Lu 1999). Moreover, root exudes are closely related to redox potential (Eh), and thus the O3-induced changes in root exudes would also af-fect speciation and bioavailability of micronutrients (Karan et al. 2014). Thus, ozone stress is ascribed to changes of the bioavailability of micronutrients.
Besides, O3 stress affects plant physiology and thus affects nutrient uptake and transport. The translocation and partitioning of carbohydrates between source (leaves) and sink organs (roots and grains) are often disturbed (Zheng et al. 2013). Our findings of reduced root biomass correspond with previous studies. The lower ratio of aboveground to root biomass in response to elevated O3 level confirms the inhibition of O3 on carbohydrate translocation to roots. Since photosynthetic sub-strates are required for iron reduction by roots, it is expected that lower carbohydrate in roots may result in lower Fe uptake when bioavailable Fe in soil is similar between A and E treatments. Similar findings were observed in this study, which showed lower Fe concentration in root under similar ambi-ent bioavailable Fe concambi-entration. In terms of Mn and Cu, elevated bioavailability in soil contributes to an increased uptake in plant roots. The greater Mn and Cu concentrations in roots ensure a larger amount of ions transported to grains. Regarding Zn, lower bioavailable Zn in soil contributed to decreased Zn concentration in grains in O3 treat-ment. Further studies should be carried out to identify the mechanisms associated with nutrient transport in response to carbohydrates in roots.
REFERENCES
Bakircioglu D., Kurtulus Y.B., Ibar H. (2011): Investigation of trace elements in agricultural soils by BCR sequential extrac-tion method and its transfer to wheat plants. Environmental Monitoring and Assessment, 175: 303–314.
Bao S.D. (2000): Soil Agrochemical Analysis. 3rd Edition. Beijing,
China Agricultural Press. (In Chinese)
Barnes J.D., Eamus D., Brown K.A. (1990): The influence of ozone, acid mist and soil nutrient status on Norway spruce [Picea abies (L.) Karst.]. New Phytologist, 115: 149–156.
Broberg M.C., Feng Z.Z., Xin Y., Pleijel H. (2015): Ozone effects on wheat grain quality – A summary. Environmental Pollution, 197: 203–213.
Dotaniya M.L., Meena V.D. (2015): Rhizosphere effect on nutrient availability in soil and its uptake by plants: A review.
Proceed-ings of the National Academy of Sciences, India Section B: Biological Sciences, 85: 1–12.
Feng Z.Z., Hu E., Wang X., Jiang L.J., Liu X.J. (2015): Ground-level O3 pollution and its impacts on food crops in China: A review. Environmental Pollution, 199: 42–48.
Feng Z., Wang L., Pleijel H., Zhu J., Kobayashi K. (2016): Differen-tial effects of ozone on photosynthesis of winter wheat among cultivars depend on antioxidative enzymes rather than stomatal conductance. The Science of the Total Environment, 572: 404–411. Feng Z.Z., Kobayashi K. (2009): Assessing the impacts of current and future concentrations of surface ozone on crop yield with meta-analysis. Atmospheric Environment, 43: 1510–1519. Fuhrer J., Booker F. (2003): Ecological issues related to ozone:
Agricultural issues. Environment International, 29: 141–154. Jing L., Dombinov V., Shen S., Wu Y., Yang L., Wang Y., Frei M.
(2016): Physiological and genotype-specific factors associ-ated with grain quality changes in rice exposed to high ozone. Environmental Pollution, 210: 397–408.
Kabata-Pendias A. (2011): Trace Elements in Soils and Plants. 5th
Edition. Florida, Crc Press, 951–974.
Karlsson P.E., Klingberg J., Engardt M., Andersson C., Langner J., Karlsson G.P., Pleijel H. (2017): Past, present and future concentrations of ground-level ozone and potential impacts on ecosystems and human health in northern Europe. Science of the Total Environment, 576: 22–35.
Kassir L.N., Darwish T., Shaban A., Olivier G., Ouaini N. (2012): Mobility and bioavailability of selected trace elements in Medi-terranean red soil amended with phosphate fertilizers: Experi-mental study. Geoderma, 189–190: 357–368.
Kabirinejad S., Kalbasi M., Khoshgoftarmanesh A.H., Hoodaji M., Afyuni M. (2014): Effect of incorporation of crops residue into soil on some chemical properties of soil and bioavailability of copper in soil. International Journal of Advanced Biological and Biomedical Research, 2: 2819–2824.
Karan A.K., Kar S., Singh V.K., Singh C.V. (2014): Effects of liming and soil moisture regimes on time changes of soil pH, redox potential, availability of native sulfur and micronutrients to rice (Oryza sativa L.) in acid soils. International Journal of Soil Science, 9: 1–15.
Kinose Y., Fukamachi Y., Okabe S., Hiroshima H., Watanabe M., Izuta T. (2016): Nutrient supply to soil offsets the ozone-induced growth reduction in Fagus crenata seedlings. Trees, 31: 259–272. Lu W.L., Cao Y.P., Zhang F.S. (1999): Role of root exuded organic
acids in mobilization of soil phosphorus and micronutrients. Chinese Journal of Applied Ecology, 10: 379–382. (In Chinese) McBride M.B., Richards B.K., Steenhuis T. (2004): Bioavailability
and crop uptake of trace elements in soil columns amended with sewage sludge products. Plant and Soil, 262: 71–84.
Narteh L.T., Sahrawat K.L. (1999): Influence of flooding on elec-trochemical and chemical properties of West African soils. Geoderma, 87: 179–207.
Rutkowska B., Szulc W., Sosulski T., Stepien W. (2014): Soil micronutrient availability to crops affected by long-term in-organic and in-organic fertilizer applications. Plant, Soil and Environment, 60: 198–203.
Sarkar A., Agrawal S.B. (2010): Elevated ozone and two modern wheat cultivars: An assessment of dose dependent sensitivity with respect to growth, reproductive and yield parameters. Environmental and Experimental Botany, 69: 328–337. Wang C.Y., Gao S.H., Pan Y.R., Bai Y.M., Wen M., Liu J.G. (1993):
Test and evaluation of physical performance of OTC-1 open top chamber. Meteorological Monthly. (In Chinesse) Wang J., Zhang X., Li G.H. (2012): Effects of ozonation on soil
organic matter of contaminated soil containing residual oil. Journal of Soils and Sediments, 12: 117–127.
Wang X.K., Manning W., Feng Z.W., Zhu Y.G. (2007): Ground-level ozone in China: Distribution and effects on crop yields. Environmental Pollution, 147: 394–400.
Yi F.J., Jiang F., Zhong F.N., Zhou X., Ding A.J. (2016): The impacts of surface ozone pollution on winter wheat productivity in China – An econometric approach. Environmental Pollution, 208: 326–335.
Zheng F.X., Wang X.K., Zhang W.W., Hou P.Q., Lu F., Du K.M., Sun Z.F. (2013): Effects of elevated O3 exposure on nutrient elements and quality of winter wheat and rice grain in Yangtze River Delta, China. Environmental Pollution, 179: 19–26. Zhuang M., Lam S.K., Li Y., Chen S. (2017): Elevated tropospheric
ozone affects the concentration and allocation of mineral nutrients of two bamboo species. Science of The Total Envi-ronment, 577: 231–235.
Zheng Y., Cheng D., Simmons M. (2014): Ozone pollution effects on gas exchange, growth and biomass yield of salinity-treated winter wheat cultivars. Science of the Total Environment, 499: 18–26.