Original Article
Long noncoding RNA expression
profiles of the doxorubicin-resistant human
osteosarcoma cell line MG63/DXR and its parental
cell line MG63 as ascertained by microarray analysis
Kun-Peng Zhu1*, Chun-Lin Zhang2*, Guo-Qi Shen3, Zhong-Sheng Zhu2
1Department of Orthopaedic Surgery, The Sixth People’s Hospital Affiliated to Shanghai Jiaotong University,
Shanghai 200233, PR China; 2Department of Orthopaedic Surgery, Shanghai Tenth People’s Hospital Affiliated
to Tongji University, Shanghai 200072, PR China; 3Department of Orthopaedic Surgery, Shanghai Sixth People’s
Hospital, Soochow University, Shanghai 200233, PR China. Co-first authors.
Received June 3, 2015; Accepted July 21, 2015; Epub August 1, 2015; Published August 15, 2015
Abstract: Long non-coding RNAs (lncRNAs) are emerging in molecular biology as crucial regulators of cancer. The efficacy of doxorubicin--based chemotherapy in osteosarcoma (OS) is usually limited by acquired drug resistance. To explore the mechanism of chemoresistance of OS in terms of lncRNA, using a human lncRNA-mRNA combined microarray, we identified 3,465 lncRNAs (1,761 up and 1,704 down) and 3,278 mRNAs (1,607 up and 1,671 down) aberrantly expressed in all three sets of doxorubicin-resistant MG63/DXR and their paired parental MG63 cells (fold-change >2.0, P<0.05 and FDR <0.05). Fifteen randomly selected lncRNAs were dysregulated in MG63/DXR cells relative to MG63 cells by qRT-PCR detection, which were consistent with our microarray data. Bioinformatics analysis identified that classical genes and pathways involved in cell proliferation, apoptosis, and drug metabolism were differently expressed in these cell lines. A lncRNA-mRNA co-expression network identified lncRNAs, including ENST00000563280 and NR-036444, may play a critical role in doxorubicin-resistance of OS by interacting with im -portant genes such as ABCB1, HIF1A and FOXC2. Besides, we found that lncRNA ENST00000563280 was distinctly increased in specimens of OS patients with a poor chemoresponse compared to those with a good chemoresponse and the patients of lower expression of it may survive longer than those of higher expression, which suggest that it may serve as a biomarker to predict the chemoresponse and prognosis of osteosarcoma patients. These results provide important insights about the lncRNAs involved in osteosarcoma chemoresistance and lay a solid foundation for uncovering the mechanism ultimately.
Keywords: Osteosarcoma, long-noncoding RNA, drug-resistant, chemoresistance
Introduction
Osteosarcoma is the most common primary
malignant bone tumor in children and adoles-cents, making up approximately 15% of all bone tumors [1]. With the application of adju-vant and neoadjuadju-vant chemotherapy, the sur-vival rate in osteosarcoma patients with local-ized disease has been largely increased [2]. However, despite improvements in osteosarco-ma therapy over the last two decades, the over-all survival of patients has reached a plateau [3]. To a certain extent, the reason behind this may be attributed to chemoresistance of
tumors to anti-OS therapy [4].
To elucidate the underlying mechanisms of
che-moresistance in OS, extensive genetic and
molecular analyses have been performed. Results from these studies have revealed mul-tiple biological changes, such as perturbations
to cell cycle regulation, overexpression of ABC
LncRNA profiles in paired doxorubicin-resistant and sensitive osteosarcoma cell line
cell (CSC)-mediated drug resistance [15, 16]. Previous studies have proposed a number of potential mechanisms of chemoresistance in
OS, but almost none of the currently available
methods are able to effectively reverse
chemo-resistance in OS. New molecular therapeutic targets for OS chemoresistance are still urgent -ly needed. Thus, in order to improve the
effec-tiveness of current cancer therapies and to find
new targets for chemotherapies, it is necessary to better understand the global molecular changes that occur during the progression of drug-resistance induction.
With the advance of next generation sequenc -ing methods and progress in transcriptome
analysis, people have identified that at least
90% of the entire human genome is transcribed
as non-coding RNAs (ncRNAs) [17]. On the
basis of transcript size, ncRNAs of less than
200 nt in length are classified as small RNAs
and include well known subtypes such as tRNAs, rRNAs, small nuclear RNAs (snRNAs), small nucleolar RNAs (snoRNAs), and miRNAs, which are constitutively expressed and play crucial roles in protein biosynthesis. In con-trast, long non-coding RNAs (lncRNAs) are
defined as eukaryote RNAs longer than 200
nucleotides in length, without protein coding capacity [18]. LncRNAs could regulate expres-sion of neighboring protein-coding genes that have a pivotal role in development or disease progression, and also regulate gene expression via a trans-acting mechanism by associating with protein complexes, such as chromatin
modifiers, transcription factors, splicing fac -tors, or RNA decay machinery in levels of
tran-scription, posttranscriptional modification and
even translation. Thus, analysis of the co-expression of lncRNAs and mRNA can help pre-dict their functional role in the development of various diseases, including cancer and lay a foundation for further mechanism studies. However, to date we found no studies that have
discussed the roles of lncRNAs in acquisition of
doxorubicin resistance by osteosarcoma, and the global pathological contribution of lncRNAs
to drug-resistance in OS remains largely
unknown.
To investigate the potential role of lncRNA in regulating the development of
chemoresis-tance in OS, in this study, we described a com -prehensive analysis of lncRNAs and mRNAs in
the human doxorubicin-resistant osteosarco-ma cell line MG63/DXR and its osteosarco-matched MG63 parental cell line using microarray analysis. We
then classified the lncRNAs and predicted the
possible functions of those that were differen-tially expressed. In addition, we constructed a mRNA-lncRNA co-expression network among the differently expressed lncRNAs and their related co-expressed genes, such as ABCB1, HIFA and so on. These findings may provide
novel insights into mechanism of drug-resis-tance in osteosarcoma patients. Then we
pre-liminarily explored the potential clinical signifi -cance of one of the validated lncRNAs.
Materials and methods
Cell lines and culture conditions
The MG63 human osteosarcoma cell line (American Type Culture Collection, ATCC, No.
CRL-1427) was cultured in Dulbecco’s modified
Eagle’s medium (Advanced DMEM, Gibco. Cat.12491-015, California, USA) supplemented with 10% fetal bovine serum (Gibco, Gran Island, NY, USA). The doxorubicin-resistant osteosarcoma cell line MG63/DXR, kindly
pro-vided by Dr. Yoshio Oda [19], was selected in a
step-wise manner by exposing drug-sensitive MG63 cells to increasing doses of doxorubicin (DXR). The surviving cells were then maintained
in the conditioned medium plus with 1 μg/ml
DXR (Sigma-Aldrich, Cat. No. D1515, Missouri, USA) to maintain its drug-resistant phenotype. Clinical samples and histological response evaluation
A total 60 of patient’s specimens were used in this study. All patients have received same mul-tidrug chemotherapy before surgery. 60 prima-ry osteosarcoma tissues were obtained from patients who underwent complete resection at the Shanghai Tenth Hospital between 2006 and 2014. All the specimens were gently washed with normal saline to remove excess
blood, and placed immediately into liquid nitro -gen and then stored at -80°C after surgery. Written informed consent was obtained from all patients. After preoperative chemotherapy, the tumors were resected and an expert panel of pathologists reviewed the histologic response. When the percentage of tumor necrosis was
≥90%, the patients were classified as good
necrosis was lower than 90%, the patients
were defied as poor responders [20].
MTT assay
To measure differences in chemoresistance between MG63/DXR and MG63 cells, the num-ber of viable cells in the two groups was deter-mined at daily intervals (0, 24, 48 and 72 h) by
MTT assay. Each well was treated with 15 μl of
MTT (5 mg/ml). The supernatant was removed
after 4 h and replaced with 100 μl of dimethyl sulfoxide (DMSO). The dye crystals were dis -solved, and absorbance was measured at 570 nm. For DXR cytotoxicity measurements, cells were treated with doxorubicin for 48 h with
con-centrations ranging from 0.20 μg/ml to 25.6 μg/ml. MTT was then applied, followed by DMSO as described above. Absorbance was
also measured, at 570 nm. The 50% inhibitory concentration (IC50) was calculated. Each experiment was performed in triplicate and repeated three times.
RNA isolation
Total RNA was isolated using TrIzol reagent (Invitrogen, CA, USA). Total RNA from each
specimen was quantified using a NanoDrop ND-1000 spectrophotometer (OD 260 nm,
NanoDrop, Wilmington, DE, USA). RNA integrity was assessed using standard denaturing aga-rose gel electrophoresis, and the purity was estimated by the ratio of absorbance at 260 to 280 nm (A260/A280).
LncRNA microarray
The Human LncRNA Microarray V3.0 (Arraystar
Inc., MD, USA) is designed for the global profil -ing of human LncRNAs and protein-cod-ing tran-scripts. Approximately 30,586 LncRNAs and 26,109 coding transcripts were collected from
authoritative data sources including Refseq,
UCSC known genes, Gencode, and landmark publications.
RNA labeling and array hybridization
In our study, double-strand cDNA (ds-cDNA)
was synthesized from 5 μg of total RNA using
an Invitrogen SuperScript ds-cDNA synthesis kit in the presence of 100 pmol oligo dT prim-ers. The ds-cDNA was cleaned and labeled in accordance with the NimbleGen Gene Expression Analysis protocol (NimbleGen
Systems, Inc., USA). Briefly, ds-cDNA was incu
-bated with 4 μg RNase A at 37°C for 10 min,
and then cleaned using phenol: chloroform: iso-amyl alcohol followed by ice-cold absolute
etha-nol precipitation. The purified cDNA was quanti
-fied using a NanoDrop ND-1000 and labeled with Cy3 using a NimbleGen One-Color DNA
labeling kit according to the manufacturer’s guidelines detailed in the Gene Expression Analysis protocol (NimbleGen Systems, Inc.,
Madison, WI, USA). A total of 1 μg of ds-cDNA was incubated for 10 min at 98°C with 1 OD of
Cy3-9 mer primer. In addition, 100 pmol of deoxynucleoside triphosphates and 100 U of
the Klenow fragment (New England Biolabs,
USA) were added, and the mix was incubated at 37°C for 2 h. The reaction was stopped by add-ing 0.1 volume of 0.5 M EDTA, and the labeled
ds-cDNA was purified by isopropanol/ethanol
precipitation. Microarrays were hybridized at
42°C for 16-20 h with 4 μg of Cy3-labeled
ds-cDNA in NimbleGen hybridization buffer/hybrid-ization component A in a hybridbuffer/hybrid-ization chamber (Hybridization System-NimbleGen Systems, Inc., Madison, WI, USA). Following hybridization, washing was performed using the NimbleGen
Wash Buffer kit (NimbleGen Systems, Inc.,
Madison, WI, USA). After being washed in an ozone-free environment, the slides were
scanned using an Axon GenePix 4000B micro -array scanner. The micro-array analysis was
per-formed by KangChen Bio-tech, Shanghai, PR
China. Data analysis
All of the slides were scanned at 5 μm/pixel resolution using an Axon GenePix 4000B scan -ner (Molecular Devices Corporation) running GenePix Pro 6.0 software (Axon). Scanned images (JPEG format) were then imported into NimbleScan software (version 2.5) for grid alignment and expression data analysis.
Expression data were normalized by quantile
normalization with the Robust Multichip Average (RMA) algorithm included in the
nimbl-eScan software. Probe level files and mRNA level files were generated following the normal
-ization. All gene level files were imported into
the Agilent GeneSpring GX software (version
11.5.1) and normalized by the quantile method.
Then, combat software was used to adjust the normalized intensity to remove batch effects.
-LncRNA profiles in paired doxorubicin-resistant and sensitive osteosarcoma cell line
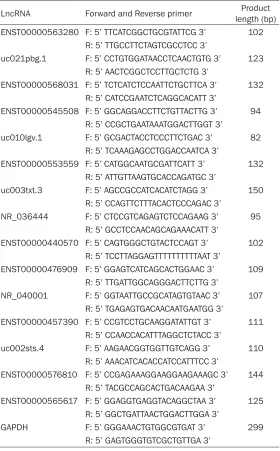
Table 1. Primers used for qRT-PCR analysis of fifteen randomly
selected lncRNAs
LncRNA Forward and Reverse primer length (bp)Product ENST00000563280 F: 5’ TTCATCGGCTGCGTATTCG 3’ 102
R: 5’ TTGCCTTCTAGTCGCCTCC 3’
uc021pbg.1 F: 5’ CCTGTGGATAACCTCAACTGTG 3’ 123 R: 5’ AACTCGGCTCCTTGCTCTG 3’
ENST00000568031 F: 5’ TCTCATCTCCAATTCTGCTTCA 3’ 132 R: 5’ CATCCGAATCTCAGGCACATT 3’
ENST00000545508 F: 5’ GGCAGGACCTTCTGTTACTTG 3’ 94 R: 5’ CCGCTGAATAAATGGACTTGGT 3’
uc010lgv.1 F: 5’ GCGACTACCTCCCTTCTGAC 3’ 82 R: 5’ TCAAAGAGCCTGGACCAATCA 3’
ENST00000553559 F: 5’ CATGGCAATGCGATTCATT 3’ 132 R: 5’ ATTGTTAAGTGCACCAGATGC 3’
uc003txt.3 F: 5’ AGCCGCCATCACATCTAGG 3’ 150 R: 5’ CCAGTTCTTTACACTCCCAGAC 3’
NR_036444 F: 5’ CTCCGTCAGAGTCTCCAGAAG 3’ 95 R: 5’ GCCTCCAACAGCAGAAACATT 3’
ENST00000440570 F: 5’ CAGTGGGCTGTACTCCAGT 3’ 102 R: 5’ TCCTTAGGAGTTTTTTTTTTAAT 3’
ENST00000476909 F: 5’ GGAGTCATCAGCACTGGAAC 3’ 109 R: 5’ TTGATTGGCAGGGACTTCTTG 3’
NR_040001 F: 5’ GGTAATTGCCGCATAGTGTAAC 3’ 107 R: 5’ TGAGAGTGACAACAATGAATGG 3’
ENST00000457390 F: 5’ CCGTCCTGCAAGGATATTGT 3’ 111 R: 5’ CCAACCACATTTAGGCTCTACC 3’
uc002sts.4 F: 5’ AAGAACGGTGGTTGTCAGG 3’ 110 R: 5’ AAACATCACACCATCCATTTCC 3’
ENST00000576810 F: 5’ CCGAGAAAGGAAGGAAGAAAGC 3’ 144 R: 5’ TACGCCAGCACTGACAAGAA 3’
ENST00000565617 F: 5’ GGAGGTGAGGTACAGGCTAA 3’ 125 R: 5’ GGCTGATTAACTGGACTTGGA 3’
GAPDH F: 5’ GGGAAACTGTGGCGTGAT 3’ 299
R: 5’ GAGTGGGTGTCGCTGTTGA 3’
tering. Hierarchical clustering was performed using the Agilent GeneSpring GX software (ver-sion 11.5.1) [21].
Bioinformatics analysis
Go analysis: GO analysis is a functional analy
sis associating differentially expressed mR-
NAs with GO categories. The GO categories are derived from Gene Ontology (www.
geneontology.org), which comprise three
structured networks of defined terms that
describe gene product attributes.
ing specific genes in this study are shown in
Table 1.
Statistical analysis
The expression levels of LncRNAs and mRNAs that were differentially expressed between human doxorubicin-resistant osteosarcoma MG63/DXR cells and the parental MG63 cells were compared by the paired, two-tailed t-test using the SPSS 20.0 software package (SPSS,
Chicago, IL). Overall survival were calculated by
Kaplan-Meier survival analysis and compared Pathway analysis:Pathway ana- lysis for differentially expressed mRNAs was provided, based on the latest KEGG (Kyoto Encyclopedia of Genes and Genomes, http://www.genome. jp/kegg) database, which allow- ed us to determine the biological pathway with the
significantly enriched mRNAs
involved.
Validation of microarray data by quantitative real-time re-verse transcription polymerase chain reaction (qRT-PCR)
qRT-PCR, the gold standard for data verification, was used to
verify the differential expres-sion of LncRNAs and mRNAs that were detected on the microarray. Total RNA was extracted with TRIzol (Invi- trogen, Carlsbad, CA, USA), and 1 mg of total RNA was convert-ed to cDNA with Primer Script RT Mix (Takara, Dalian, China). PCR was performed with the
SYBR Green PCR kit (Takara) on an ABI PRISM 7500 fast Sequence Detection System (Applied Biosystems, Foster
amplify-by the log rank test. All of the data are shown as the Means ± SD of three independent experi-ments. A value of P<0.05 was considered
sta-tistically significant.
Results
MTT assay
The doxorubicin-resistance of the MG63/DXR
cell line was identified by comparing the IC50 -value of MG63/DXR with that of the MG63 cell line. As shown in Figure 1, when exposed to doxorubicin for 48 h, the IC50 value of MG63/ DXR cells was 10.2 µM, whereas that of MG63 cells was 0.4 µM. The resistance factor (R fac-tor) of the MG63/DXR cell line, which was
defined as the ratio of the MG63/DXR IC50 the MG63 IC50 at 48 h, was 23.2. According to a
previously defined standard, R factor <5: low or
no-resistance; R factor 5-15: moderate-resis-tance; R factor >20: high-resistance [23].
Obviously, the high-resistance MG63/DXR cells
were more resistant to doxorubicin than MG63 cells, laying a solid foundation for further study. Differentially expressed lncRNAs and mRNAs
Expression levels of lncRNAs and mRNAs were
statistically significantly altered between
MG-63/DXR and MG63 cells (P<0.05; fold-change >2). In total, 3,465 lncRNAs and 3,278 mRNAs
were identified. Among these differentially
expressed lncRNAs, MG63/DXR cells had a total of 1,761 that were up-regulated >2-fold, and 1,704 that were down-regulated >2-fold relative to the corresponding lncRNAs in MG63 cells (1761 vs. 1704). However, 1,607 mRNAs were found to be up-regulated more than 2-fold in the MG63/DXR cells compared to MG63 cells, while 1,671 were down-regulated more than 2-fold (P<0.05) (1671 vs. 1607). Obviously,
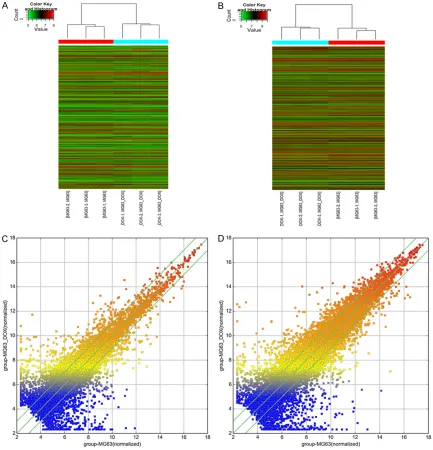
the alteration of number of lncRNAs is more than mRNAs, whatever up and down-regulated, which may suggest the complex interactions between lncRNAs and mRNAs. We used hierar-chical clustering analysis to arrange samples into groups based on their expression levels, which allowed us to hypothesize the relation-ships among samples. The resulting dendro-gram shows the relationships between the lncRNA (Figure 2A and 2C) and mRNA (Figure 2B and 2D) expression patterns between sam-ples. LncRNA ENST00000427085 (fold chan- ge: 352.9027266) was the most up-regulated lncRNA, and NR_038435 (fold change: 708.9148299) was the most down-regulated lncRNA. The ten most dramatically up- and down-regulated lncRNAs are shown in Table 2. Chromosomal distribution of overall differen-tially expressed lncRNAs and mRNAs
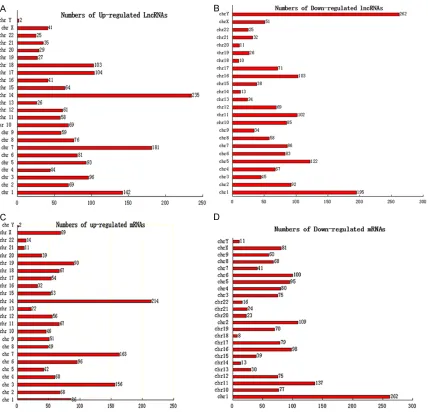
To further elucidate the underlying relation between lncRNAs and mRNAs, a distribution plot with respect to chromosomal location was established to determine the chromosomal patterns of the overall differentially expressed lncRNAs and mRNAs from microarray data (Figure 3). As was shown in Figure 3, the dif-ferentially regulated 3,465 lncRNAs and 3,278 mRNAs were distributed throughout the genome and could be found in every chromo-some. Among them, chromosome 14 had the most up-regulated lncRNAs and mRNAs simul-taneously (235 and 214, respectively), which may imply that lncRNAs and mRNAs transcribed from this chromosome could potentialy stimu-late the expression with each other. However, chromosome Y contained the most down-regu-lated lncRNAs and the fewest up-regudown-regu-lated mRNAs (262 and 2, respectively), which sug-gest that the lncRNAs in this chromosome may negatively regulate the expression of mRNAs here. These results may suggest the impor-tance of chromosome 14 and Y in the
occur-rence of doxorubicin-resistance in OS.
[image:5.612.90.288.72.221.2]LncRNA profiles in paired doxorubicin-resistant and sensitive osteosarcoma cell line
LncRNA classification and subgroup analysis
According to the locations of lncRNAs relative to nearby protein-coding genes and their poten-tial functions, the differently expressed
lncRNAs were classified and sub-grouped into
the following three categories: (1) Enhancer
LncRNA profiling and Enhancer LncRNAs near
coding gene (Table 3), (2) LncRNA profiling and LncRNAs near coding gene, (3) HOX cluster pro
-filing (Table S1). Of these, LncRNAs with
enhancer-like functions (LncRNA-a) were
identi-fied using GENCODE annotation of human
[image:6.612.89.522.71.521.2]er-like function excluded transcripts mapping to both exons and introns of annotated protein coding genes, the natural antisense transcripts that overlap protein coding genes, and all known transcripts. Additionally, the coding genes near to the enhancer-like LncRNAs were less than 300 kb away from the LncRNAs and did indeed encode proteins. In addition,
LncRNAs were identified according to the site in
which they were located relative to two protein-coding genes. Furthermore, nearby protein-coding
genes were defined as above, similar to the
Enhancer LncRNAs that were localized close to
coding genes. The HOX cluster profiling includ
-ed the LncRNAs in the four HOX loci, HOX A, HOX B, HOX C, and HOX D, which encode tran
-scription factors that define cellular identities
along both the major and secondary body axes. As shown in Table 3, the twenty most differen-tially expressed enhancer lncRNAs and their
nearby genes were classified into four catego -ries according to the expression trend of the lncRNA and mRNA: lncRNA up and mRNA up ; lncRNA up and mRNA down; lncRNA down and mRNA up; lncRNA down and mRNA down. This categorization suggested that pervasive regu-latory mechanisms that involve lncRNA
affect-ing the expression of mRNA might exist. From these categories a few important genes, such as the transcription factor genes TCEAL4 and HES4, as well as some classical genes involved in cell cycle regulation and metabolism, such as RSAD2, EDN1, were differentially expressed with the relevant lncRNA. These lncRNAs could either induce or inhibit the expression of these genes to regulate cellular activities. As shown in Table 3, expression of lncRNAs and their nearby genes followed similar trends in some cases, but opposite trends in others. MEG3, which has been shown to play a role as tumor suppressor in various cancers, such as gastric cancer [24], NSCLC [25], cervical carcinoma [26] and others, was associated with twenty differentially expressed lncRNAs.
GO analysis and pathway analysis
A GO enrichment analysis of differentially
expressed mRNAs was performed to identify
GOs with higher confidence. Fisher’s exact test
was used to determine whether the overlap between genes on the differentially expressed
list and the GO annotation list was greater than
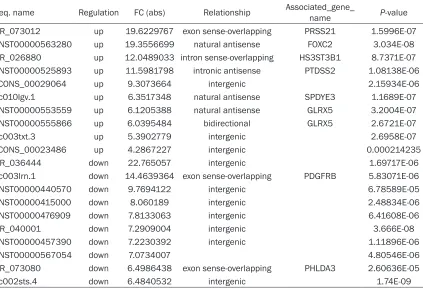
that expected by chance (p-value <0.05 is rec-Table 2. The ten most significantly up- and down-regulated lncRNAs
Seq. name Regulation FC (abs) Relationship Associated_gene_name P-value
NR_073012 up 19.6229767 exon sense-overlapping PRSS21 1.5996E-07
ENST00000563280 up 19.3556699 natural antisense FOXC2 3.034E-08
NR_026880 up 12.0489033 intron sense-overlapping HS3ST3B1 8.7371E-07
ENST00000525893 up 11.5981798 intronic antisense PTDSS2 1.08138E-06
TCONS_00029064 up 9.3073664 intergenic 2.15934E-06
uc010lgv.1 up 6.3517348 natural antisense SPDYE3 1.1689E-07
ENST00000553559 up 6.1205388 natural antisense GLRX5 3.2004E-07
ENST00000555866 up 6.0395484 bidirectional GLRX5 2.6721E-07
uc003txt.3 up 5.3902779 intergenic 2.6958E-07
TCONS_00023486 up 4.2867227 intergenic 0.000214235
NR_036444 down 22.765057 intergenic 1.69717E-06
uc003lrn.1 down 14.4639364 exon sense-overlapping PDGFRB 5.83071E-06
ENST00000440570 down 9.7694122 intergenic 6.78589E-05
ENST00000415000 down 8.060189 intergenic 2.48834E-06
ENST00000476909 down 7.8133063 intergenic 6.41608E-06
NR_040001 down 7.2909004 intergenic 3.666E-08
ENST00000457390 down 7.2230392 intergenic 1.11896E-06
ENST00000567054 down 7.0734007 4.80546E-06
NR_073080 down 6.4986438 exon sense-overlapping PHLDA3 2.60636E-05
[image:7.612.99.522.85.374.2]LncRNA profiles in paired doxorubicin-resistant and sensitive osteosarcoma cell line
ommended as the cut-off). Through GO analy -sis we found that these dysregulated tran-scripts of lncRNAs were associated with heart development and extracellular matrix organiza-tion (ontology: biological process), intracellular molecules and cytoplasm (ontology: cellular component), catalytic activity and oxidoreduc-tase activity (ontology: molecular function) (Figure 4). The genes corresponding to the up-regulated and down-up-regulated mRNAs respec-tively included 152 and 126 genes involved in biological processes, 80 and 72 genes involved
in cellular components, 69 and 56 genes involved in molecular functions.
Significant pathways of differential genes were
compared with the KEGG database to further specify and identify target mRNAs among the
3,278 identified genes. Through the pathway analysis, we identified that 31 pathways were significantly enriched among the up-regulated
transcripts (Table S2) and 25 pathways (Table S3) were significantly enriched among the
[image:8.612.95.523.68.480.2]‘Glutathione metabolism-Homo sapiens (hu- man)’ and ‘Transcriptional misregulation in can-cer-Homo sapiens (human)’ were the most enriched networks respectively. Some of these pathways, such as the classical gene category
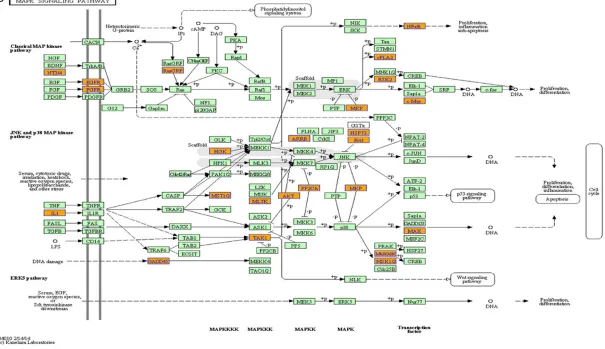
‘NF-κB’ and ‘MAPK’, have been reported to be
involved in the induction of chemoresistance in osteosarcoma [27-30] (Figure 5).
Real-time quantitative PCR validation
Based on the features of the differentially
expressed lncRNAs, such as fold change, gene locus, and nearby encoding gene, we initially
identified a number of interesting candidate
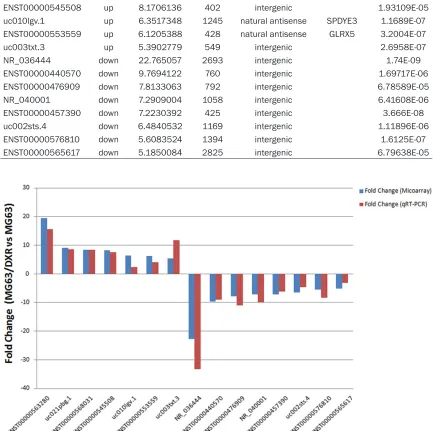
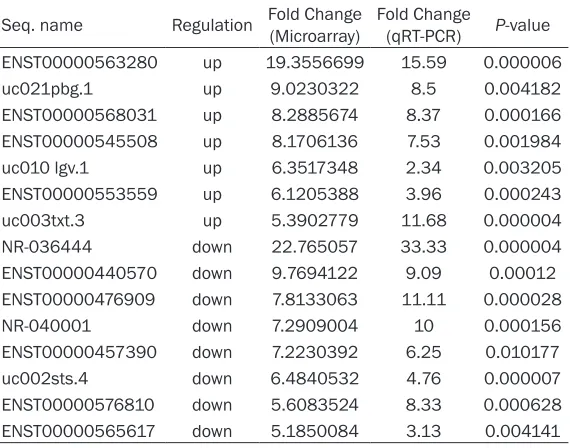
lncRNAs for further analysis. Seven up-regulat-ed lncRNAs (ENST00000563280, uc021pbg.1, ENST00000568031, ENST00000545508, uc- 010 lgv.1, ENST00000553559 and uc003- txt.3), and eight down-regulated lncRNAs (NR_ 036444, ENST00000440570, ENST000004- 76909, NR_040001, ENST00000457390, uc- 002sts.4, ENST00000576810 and ENST00- 000-565617) (Table 4) were randomly chosen. To further validate these differentially
expressed lncRNAs, we performed quantitative
real-time PCR assays, which is the gold
stan-dard for data verification. These selected
lncRNAs were from various categories, such as natural antisense, intergenic and intronic anti-sense. As is illustrated in Figure 6 and Table 5, these data supported a strong consistency
between the qRT-PCR result and microarray
data. The results showed that lncRNA ENST00000563280, uc021pbg.1, ENST000- 00568031, ENST00000545508, uc010lgv.1, ENST00000553559 and uc003txt.3 were up-regulated and that NR-036444, ENST- 00000440570, ENST00000476909, NR_ 040001, ENST00000457390, uc002sts.4, ENST00000576810 and ENST00000565617 were down-regulated in the doxorubicin-resis-tant MG63/DXR cells compared with their parental MG63 cell controls.
Establishment of the lncRNA-mRNA co-expres-sion network
We constructed a coding-noncoding gene co-expression network that included the 15
differ-entially expressed lncRNAs validated by
qRT-PCR and their putative target coding genes. The lncRNAs and coding genes with Pearson corre-Table 3. The twenty most significantly differentially expressed Enhancer lncRNAs and their nearby
genes
Seq. name Gene Symbol Fold change - LncRNAs Regulation-LncRNAs RelationshipGenome Nearby Gene
ENST00000424887 TCEAL3-AS1 22.8374194 up downstream NM-001006935
ENST00000425711 AC097517.2 16.253311 down upstream NM-080657
ENST00000458028 RP3-523C21.1 14.0142442 down upstream ENST00000360971 ENST00000457945 RP11-125M16.1 11.5072572 down downstream NM-001955 ENST00000457253 XXbac-BPG308K3.5 11.1698502 up upstream NM-001010877
NR-038981 LOC100507254 11.1053083 down upstream ENST00000360971
NR-033917 LOC728228 10.8412202 up upstream ENST00000278795
ENST00000456651 RP3-522D1.1 9.5123946 down downstream NM-001166496
ENST00000431761 KIAA0664L3 8.9037958 down downstream NM-003414
ENST00000419627 RP3-323P13.2 8.6173344 down upstream NM-145176
NR-026821 FAM138B 8.5000113 down upstream NM-012184
ENST00000326734 FAM87B 7.7104153 up downstream NM-021170
ENST00000420597 RP11-14N7.2 7.6400478 down upstream NM-001164261
ENST00000457390 RP11-14N7.2 7.2230392 down upstream NM-001164261
NR-024475 LOC100216001 7.0389266 up upstream NM-001040177
ENST00000450467 AC097517.2 6.4548525 down upstream NM-080657
ENST00000419578 RP1-13P20.6 6.3076938 up downstream ENST00000368768
uc001ihe.4 LOC100216001 6.2438775 up upstream NM-001040177
ENST00000443364 RP11-48O20.4 6.190759 down downstream ENST00000368090
[image:9.612.95.521.97.386.2]LncRNA profiles in paired doxorubicin-resistant and sensitive osteosarcoma cell line
LncRNA profiles in paired doxorubicin-resistant and sensitive osteosarcoma cell line
lation coefficients equal to or greater than
0.999 were chosen for network, which was drawn using Cytoscape (Institute of Systems
Biology in Seattle). The result revealed that the
co-expression network was between 15
[image:13.612.92.521.86.307.2]lncRNAs and 593 coding genes. Within this co-expression network, 999 pairs presented as positive and 1053 pairs presented as negative. This co-expression network indicated that one lncRNA could target a maximum of 201 coding Table 4. Fifteen lncRNAs randomly selected for validation by qRT-PCR
LncRNA Regulation FC (abs) RNA length Relationship Associated_gene_name P-value ENST00000563280 up 19.3556699 319 natural antisense FOXC2 3.034E-08
uc021pbg.1 up 9.0230322 1971 natural antisense BCAN 1.16379E-05
ENST00000568031 up 8.2885674 1313 intergenic 6.60888E-06
ENST00000545508 up 8.1706136 402 intergenic 1.93109E-05
uc010lgv.1 up 6.3517348 1245 natural antisense SPDYE3 1.1689E-07
ENST00000553559 up 6.1205388 428 natural antisense GLRX5 3.2004E-07
uc003txt.3 up 5.3902779 549 intergenic 2.6958E-07
NR_036444 down 22.765057 2693 intergenic 1.74E-09
ENST00000440570 down 9.7694122 760 intergenic 1.69717E-06
ENST00000476909 down 7.8133063 792 intergenic 6.78589E-05
NR_040001 down 7.2909004 1058 intergenic 6.41608E-06
ENST00000457390 down 7.2230392 425 intergenic 3.666E-08
uc002sts.4 down 6.4840532 1169 intergenic 1.11896E-06
ENST00000576810 down 5.6083524 1394 intergenic 1.6125E-07
[image:13.612.89.523.148.579.2]ENST00000565617 down 5.1850084 2825 intergenic 6.79638E-05
LncRNA profiles in paired doxorubicin-resistant and sensitive osteosarcoma cell line
genes, and that one coding gene could be relat-ed to a maximum of 9 lncRNAs (Figure 7). At the same time, we found that lncRNA EST00000563280 and NR-036444 were strongly correlated with previously reported multidrug-resistance associated genes such as
ACBC1and HIF1A, which were also differentially
expressed in our data (Table 6). These results may provide us some valuable clues to further clarify the mechanism of how lncRNA EST00000563280 and NR-036444 regulate the sensitivity of MG63 cells to doxorubicin from the perspective of interactions with these classical multidrug-resistance genes.
Potential clinical significance of lncRNA in os-teosarcoma
To explore the potential clinical significance of
lncRNA, we then examined the expression level of lncRNA ENST00000563280, which was named osteosarcoma multidrug-resistance related up-regulated lncRNA, namely lncRNA
OMRUL, in the 60 primary osteosarcoma tis -sues samples, which were divided into two groups: chemosensitivity and chemoresistance group, thirty persons per group. The baseline between the two groups is comparable (Table 7). We used the median expression level of
lncRNA OMRUL as a cut-off to divide the 60 patients into lncRNA OMRUL -high (n=38, with an average ΔCt expression value of 80.25) and low groups (n=22, with an average ΔCt expres -sion value of 19.75). As is shown in the Figure 8A, our data showed that the expression of
lncRNA ENST00000563280 (lncRNA OMRUL), the most up-regulated lncRNA of the seven
selected lncRNAs verified by qRT-PCR, in che-moresistance group was about four fold than that of chemosensitivity group. And in the Figure 8B, the patients in lower expression of
lncRNA ENST00000563280 (lncRNA OMRUL)
may survive longer than those of higher expres-sion (28.2±1.4 months vs. 48.6±1.2 months),
which suggest that lncRNA ENST00000563280
(lncRNA OMRUL) may serve as a biomarker to
predict the chemoresponse and prognosis of
osteosarcoma patients. But it is still needed to
be examined and validated in more clinical samples of osteosarcoma.
Discussion
Osteosarcoma is the most common primary
malignant bone tumor in children and
adoles-cents, making up approximately 15% of all bone tumors. Chemotherapy has been a very impor-tant adjuvant therapy in the treatment of osteo-sarcoma. Doxorubicin and cisplatin in combina-tion with methotrexate is the most common- ly used chemotherapy regimens. However, the appearance of chemoresistance impedes its
clinical usage [31]. Over the past decades, the
molecular mechanism of chemoresistance in osteosarcoma has been extensively investigat-ed. Nevertheless, the exact biological mecha-nism of this process remains still unclear, therefore, further study of chemoresistance in
OS is of great importance. LncRNAs have been
reported to play an vital role in many biological processes [32], including X-chromosome inacti-vation, gene imprinting [33], carcinogenesis and tumor metastasis [34]. Different ty- pes of lncRNAs with a variety of biological func-tions make it possible to regulate the biological behavior of malignant tumors, which provides an important opportunity to reveal the nature of chemoresistance of malignant tumors. Studying the changes in lncRNA expression between multi-drug resistant cells and their drug-sensitive counterparts, as well as study-ing differentially expressed lncRNAs and
corre-sponding epigenetic modifications during
induction of chemoresistance, may provide a new perspective and, potentially, new thera-pies to overcome the multi-drug resistance of malignant tumors.
In fact, some lncRNAs have been reported to be involved in drug resistance of various types of cancers. In particular, the relationship between lncRNA and chemoresistance in non-small cell lung cancer [21], bladder cancer [35], stomach cancer [36], and soft tissue sarcoma [37] has been partly elucidated. Fan [35] showed that over-expression of lncRNA UCA1
significantly increased the viability of
cisplatin-resistant bladder cancer cells during cisplatin treatment, whereas UCA1 knockdown reduced cell viability during cisplatin treatment. And lncRNA UCA1 may regulate the chemoresis-tance of bladder cancer through activating Wnt signaling. Jiang [38] showed that the expres-sion of lncRNA ARA (Adriamycin Resistance
Associated) was significantly associated with
Table 5. The differential expression of lncRNAs validated by
qRT-PCR
Seq. name Regulation Fold Change (Microarray) Fold Change (qRT-PCR) P-value
ENST00000563280 up 19.3556699 15.59 0.000006
uc021pbg.1 up 9.0230322 8.5 0.004182
ENST00000568031 up 8.2885674 8.37 0.000166
ENST00000545508 up 8.1706136 7.53 0.001984
uc010 lgv.1 up 6.3517348 2.34 0.003205
ENST00000553559 up 6.1205388 3.96 0.000243
uc003txt.3 up 5.3902779 11.68 0.000004
NR-036444 down 22.765057 33.33 0.000004
ENST00000440570 down 9.7694122 9.09 0.00012
ENST00000476909 down 7.8133063 11.11 0.000028
NR-040001 down 7.2909004 10 0.000156
ENST00000457390 down 7.2230392 6.25 0.010177
uc002sts.4 down 6.4840532 4.76 0.000007
ENST00000576810 down 5.6083524 8.33 0.000628
ENST00000565617 down 5.1850084 3.13 0.004141
ARA was shown to be capable of modulating ulated and 1,704 down-regulated lncRNAs Figure 7. Predicted lncRNA-mRNA association network. The co-expression
network was established between the 15 qRT-PCR-verified lncRNAs and 593 coding genes that had Pearson correlation coefficients equal to or greater than 0.999. Within this co-expression network, 999 pairs presented as posi-tive, and 1053 pairs presented as negative. This co-expression network in-dicated that one lncRNA could target a maximum of 201 coding genes and that one coding gene could correlate with a maximum of 9 lncRNAs. The seven blue boxes represent up-regulated lncRNAs, while the eight red boxes indicate down-regulated lncRNAs. The orange nodes denote over-expressed genes and the yellow ones represent those with reduced expression.
MAPK signaling pathway, met-abolic pathways, and cell cycle and cell adhesion-relat-ed biological pathways. ARA could also regulate cellular processes, including tran-scriptional processes and protein binding, which plays various important biological functions. In addition, Wang [39] found a set of lncRNAs related to multi-drug resis-tance in gastric cancer, includ-ing lncRNA DMTF1v4 (cyclin D binding myb-like transcription factor 1 (DMTF1), transcript variant 4), which was expre-
ssed at significantly higher
levels in the doxorubicin- and vincristine-resistant gastric cancer cell line SGC7901. After knocking down DMTF1v4 through corresponding siR-NAs, the level of P-g protein in SGC7901 cells markedly decreased, while the
percent-age of apoptotic cells signifi -cantly increased.
To our knowledge, this is the
first study to examine the reg -ulatory effects of lncRNAs in
chemoresistance of OS. In the
present study, to explore the mechanism underlying doxo-rubicin-resistance in the human osteosarcoma cell line MG63/DXR in terms of lncRNA, the lncRNA
expres-sion profiles of these cells
were investigated using mi- croarray analysis. Indeed, the lncRNA expression levels dif-fered compared to the MG63 parental cell line. We analyzed three pairs of human primary MG63/DXR osteosarcoma drug-resistant cell line and their MG63 parental
drug-sensitive cells and identified
[image:15.612.89.379.190.572.2]up-reg-LncRNA profiles in paired doxorubicin-resistant and sensitive osteosarcoma cell line
Table 6. Differentially expressed multidrug-resistance associated genes
Seq. name FC (abs) Regulation Gene Symbol Product P-value
NM-000927 459.720896 up ABCB1 multidrug resistance protein 1 3.35E-07 NM-181054 20.4640428 up HIF1A hypoxia-inducible factor 1-alpha isoform 2 3.01E-06
DXR cells relative to MG63 cells. Additionally, the dysregulated lncRNAs were distributed across all 22 autosomes and the X and Y sex chromosomes, which may suggest their exten-sive role in regulation of various biological activ-ities. Fifteen lncRNAs (seven up and eight down-regulated) of three types (intergenic, intronic antisense and natural antisense) were
evaluated by quantitative real-time PCR to vali -date the consistency of our results. Furthermore,
we utilized Gene Ontology (GO) analysis and
pathway analysis and constructed an lncRNA-mRNA co-expression network to preliminarily study the biological functions of these lncRNAs
in the development of OS chemoresistance. In
addition, we examined the expression of lncRNA ENST00000563280 in 30 pairs of osteosarcoma patient samples to explore its
potential clinical significance.
Through the GO and pathway analyses, we have identified the biological functions enriched among the differentially expressed mRNAs. GO
analysis revealed that the number of genes cor-responding to up-regulated mRNAs was larger than that corresponding to down-regulated mRNAs (152 vs. 126). We found that these genes were mainly involved in cell components and basic metabolic processes, which may sug-gest that the differently expressed lncRNAs
proliferation and apoptosis. Meanwhile, the ‘Glutathione metabolism’ and ‘Drug metabo-lism-cytochrome P450’ pathways have been previously reported to be associated with the occurrence of drug-resistance [40, 41]. These may suggest that the different expressed lncRNAs may regulate the chemoresistance of osteosarcoma through these classical pathways.
Furthermore, according to the microarray and
qRT-PCR results, we found that lncRNA
ENST00000563280, the most highly over-expressed of the seven validated up-regulated lncRNAs (fold change: 19.3556699), and lncRNA NR_036444, the most dramatically decreased of the eight validated down-regulat-ed lncRNAs (fold change: 22.765057), were most likely involved in the induction of doxoru-bincin-resistance of MG63 cells. At the same time, with the help of our established lncRNA-mRNA co-expression network, we found that lncRNA EST00000563280 and NR-036444
had a strong correlation (correlation coefficient of ≥0.97) with classical multidrug-resistance
(MDR) associated genes, including ABCB1 [42] and HIF1A [43] (Table 8). Specifically, ABCB1 (ATP-binding cassette, subfamily B, member 1),
is a well-known multidrug-resistance associat-ed gene, which is one of seven distinct subfami-Table 7. The baseline between chemosensitive and
chemo-resistant group of osteosarcoma patients
chemosensitive
group chemoresistant group
Number 30 30
Gender P=0.08
Male 22 24
Female 8 6
Age (y) 18.6±0.4 (6-40) 19.2±0.8 (8-36) P=0.1
Location P=0.07
Proximal of Humerus 8 6
Distal of Femur 12 14
Proximal of Tibia 8 9
Other 2 1
Follow-up time (m) 25.0±1.2 (6-96) 22.4±1.4 (3-80) P=0.55
could regulate the chemoresponse of
osteosarcoma cell line via influencing
the expression of these genes. Pathway analysis showed that there were 31 pathways corresponded to all up-regulated transcripts (including Transcriptional disregulation in
can-cer, NF-kappa B signaling pathway,
TNF signaling pathway and MAPK sig-naling pathway) and 25 pathways corresponded to all down-regulated transcripts (including Glutathione metabolism, PI3K-Akt signaling path-way, ECM-receptor interaction and Drug metabolism-cytochrome P450
pathway). Of them, the classical sig
[image:16.612.91.344.173.340.2]lies of ABC (ATP-binding cassette) genes (ABC1, MDR/TAP, MRP, ALD, OABP, GCN20, and White). The protein encoded by ABCB1, P-gp, is
an ATP-dependent drug efflux pump for xenobi
-otic compounds with broad substrate specifici -ty, which is responsible for decreased drug accumulation in multidrug-resistant cells and often mediates the development of resistance to anticancer drugs [44]. Here, based on the
correlation coefficient of lncRNA
EST000-00563280 and NR-036444 with ABCB1 and its expression levels, our results suggest that lncRNA EST00000563280 and NR-036444 may stimulate the expression of ABCB1 to transport the chemotherapeutics out of the cell, leading to chemoresistance. These data may provide valuable clues to further clarify the mechanism by which lncRNA EST0000056- 3280 and NR-036444 regulate the sensitivity
of MG63 cells to doxorubicin from the perspec-tive of interactions between the lncRNAs and multidrug-resistance genes. As reported by Wang [39], lncRNA MRUL (MDR-related and upregulated lncRNA), located 400 kb down-stream of ABCB1, was significantly upregulated
in two multidrug-resistant GC cell sub-lines, SGC7901/ADR and SGC7901/VCR. Moreover,
MRUL depletion reduced ABCB1 mRNA levels
in a dose- and time-dependent manner, and heterologous luciferase reporter assays dem-onstrated that MRUL might positively affect
ABCB1 expression in an orientation- and posi -tion-independent manner. These results
indi-cated that MRUL promotes ABCB1 expression
[image:17.612.94.524.73.314.2]and is a potential target to reverse the MDR phenotype of GC MDR cell sub-lines. In addi-tion, lncRNA ENST00000563280 was found to be located near FOXC2 (forkhead box protein Figure 8. LncRNA expression in osteosarcoma (OS) tissue and potential clinical significance. A. The expression of lncRNA ENST00000563280 (OMRUL) in specimens of OS patients that had a poor chemoresponse was about four fold than those with a good chemoresponse (20.2±0.3 vs. 80.4±0.6). The data are presented as the mean ± SD. GR stands for good chemoresponse group and PR means poor chemoresponse. B. The average survival lifetime of the patients in lower expression of lncRNA OMRUL was 48.6±1.2 months and the higher patients was 28.2±1.4 months, which may suggest the potential significance of this lncRNA.
Table 8. Correlation coefficient of lncRNA with ABCB1, HIF1A and FOXC2
Seq. name Regulation Drug-resistance associated Genes
ABCB1 HIF1A FOXC2
[image:17.612.89.522.422.476.2]LncRNA profiles in paired doxorubicin-resistant and sensitive osteosarcoma cell line
C2), which has been demonstrated to regulate cell proliferation [45], tumor angiogenesis [46] and epithelial-to-mesenchymal transition (EMT) [47] through the MAPK and AKT signaling path-ways [45]. Considering the natural antisense relationship between the simultaneously increased expression of the lncRNA ENST- 00000563280 and FOXC2, lncRNA ENST- 00000563280 may have the capacity to regu-late the expression of FOXC2 at the
transcrip-tional level to influence tumor angiogenesis
and EMT. In turn, this could potentially mediate the metastasis of osteosarcoma. These results provided valuable clues for future studies.
Besides, through detecting the expression of
lncRNA ENST00000563280 in 60 primary osteosarcoma tissues resected from osteosar-coma patients, which has been divided into chemosensitivity group and chemoresistance group according to the histologic response pre-viously described, obpre-viously, the expression of
lncRNA ENST00000563280 (lncRNA OMRUL)
was significantly increased in specimens from OS patients that showed a poor chemore -sponse compared to those that responded well to chemotherapy and the patients in lower expression of lncRNA ENST00000563280
(lncRNA OMRUL) may survive longer than those
of higher expression. This may suggest that there may exist some lncRNA that could serve as a biomarker to predict the chemoresponse of osteosarcoma patients and lncRNA
ENST00000563280 (lncRNA OMRUL) may be
one of candidates, which needed to be
con-firmed in more osteosarcoma tissue samples.
To summarize, our present study shows, for the
first time, that a set of lncRNAs with differential
expression in the human doxorubicin-resistant osteosarcoma cell line MG63/DXR relative to its parental cell line MG63. Furthermore, our study revealed that lncRNA ENST0000056- 3280 and NR-036444 may regulate the sensi-tivity of MG63/DXR cells sensisensi-tivity to chemo-therapeutics by altering the expression of
genes involved in the ‘MAPK’ and ‘NF-κB’ sig -naling pathways, as well as a few classical mul-tidrug resistance (MDR) associated genes,
such as ACBC1 and HIF1A. In addition, lncRNA ENST00000563280 may influence tumor
angiogenesis and EMT by interacting with
FOXC2 to potentially mediate the metastasis of
osteosarcoma. And lncRNA ENST00000563280
(lncRNA OMRUL) may serve as a potential bio -marker to predict the chemoresponse and
prognosis of osteosarcoma patients. Our
results revealed a penetrating layer of lncRNA
of biological significance in pathologies of che
-moresistance in OS, thereby pointing intriguing
directions for further research. A deeper under-standing of lncRNAs and their role in the forma-tion of osteosarcoma chemoresistance pos-sesses potential for discovering possible thera-peutic targets and for identifying feasible biomarkers.
Acknowledgements
This project was supported by a Grant from The National Natural Science Foundation of China (NSFC No. 81572630).
Disclosure of conflict of interest None.
Address correspondence to: Dr. Chun-Lin Zhang, Department of Orthopaedic Surgery, The Tenth People’s Hospital Affiliated to Tongji University, 301, Yan-Chang Middle Road, Shanghai 200072, China. Fax: +86 13761904091; E-mail: [email protected]
References
[1] Picci P. Osteosarcoma (osteogenic sarcoma). Orphanet J Rare Dis 2007; 2: 6-10.
[2] Longhi A, Errani C, De Paolis M, Mercuri M and Bacci G. Primary bone osteosarcoma in the pe -diatric age: state of the art. Cancer Treat Rev 2006; 32: 423-436.
[3] Lee JA, Kim MS, Kim DH, Lim JS, Yoo JY, Koh JS, Lee SY, Jeon DG and Park KD. Relative tu-mor burden predicts metastasis-free survival in pediatric osteosarcoma. Pediatr Blood Cancer 2008; 50: 195-200.
[4] He H, Ni J and Huang J. Molecular mechanisms of chemoresistance in osteosarcoma (Review). Oncol Lett 2014; 7: 1352-1362.
[5] Broxterman HJ, Gotink KJ and Verheul HM. Understanding the causes of multidrug resis-tance in cancer: a comparison of doxorubicin and sunitinib. Drug Resist Updat 2009; 12: 114-126.
[6] Cao B, Li M, Zha W, Zhao Q, Gu R, Liu L, Shi J, Zhou J, Zhou F, Wu X, Wu Z, Wang G and Aa J. Metabolomic approach to evaluating adriamy-cin pharmacodynamics and resistance in breast cancer cells. Metabolomics 2013; 9: 960-973.
[7] Bertino JR. Karnofsky memorial lecture. Ode to methotrexate. J Clin Oncol 1993; 11: 5-14. [8] Townsend DM and Tew KD. The role of
[9] Wang D, Luo M and Kelley MR. Human apu-rinic endonuclease 1 (APE1) expression and prognostic significance in osteosarcoma: en -hanced sensitivity of osteosarcoma to DNA damaging agents using silencing RNA APE1 expression inhibition. Mol Cancer Ther 2004; 3: 679-686.
[10] Meric-Bernstam F and Gonzalez-Angulo AM. Targeting the mTOR signaling network for can -cer therapy. J Clin Oncol 2009; 27: 2278-2287. [11] Asada N, Tsuchiya H and Tomita K. De novo de-letions of p53 gene and wild-type p53 corre-late with acquired cisplatin-resistance in hu -man osteosarcoma OST cell line. Anticancer Res 1999; 19: 5131-5137.
[12] Chao DT and Korsmeyer SJ. BCL-2 family: regu -lators of cell death. Annu Rev Immunol 1998; 16: 395-419.
[13] Gougelet A, Pissaloux D, Besse A, Perez J, Duc A, Dutour A, Blay JY and Alberti L. Micro-RNA profiles in osteosarcoma as a predictive tool for ifosfamide response. Int J Cancer 2011; 129: 680-690.
[14] Song B, Wang Y, Xi Y, Kudo K, Bruheim S, Botchkina GI, Gavin E, Wan Y, Formentini A, Kornmann M, Fodstad O and Ju J. Mechanism of chemoresistance mediated by miR-140 in human osteosarcoma and colon cancer cells. Oncogene 2009; 28: 4065-4074.
[15] Fujii H, Honoki K, Tsujiuchi T, Kido A, Yoshitani K and Takakura Y. Sphere-forming stem-like cell populations with drug resistance in human sarcoma cell lines. Int J Oncol 2009; 34: 1381-1386.
[16] Martins-Neves SR, Lopes AO, do Carmo A, Paiva AA, Simoes PC, Abrunhosa AJ and Gomes CM. Therapeutic implications of an enriched cancer stem-like cell population in a human osteosarcoma cell line. BMC Cancer 2012; 12: 139-152.
[17] Bertone P, Stolc V, Royce TE, Rozowsky JS, Urban AE, Zhu X, Rinn JL, Tongprasit W, Samanta M, Weissman S, Gerstein M and Snyder M. Global identification of human tran -scribed sequences with genome tiling arrays. Science 2004; 306: 2242-2246.
[18] Chen LL and Carmichael GG. Long noncoding RNAs in mammalian cells: what, where, and why? Wiley Interdiscip Rev RNA 2010; 1: 2-21. [19] Oda Y, Matsumoto Y, Harimaya K, Iwamoto Y
and Tsuneyoshi M. Establishment of new mul-tidrug-resistant human osteosarcoma cell lines. Oncol Rep 2000; 7: 859-866.
[20] Xu M, Jin H, Xu CX, Sun B, Mao Z, Bi WZ and Wang Y. miR-382 inhibits tumor growth and en-hance chemosensitivity in osteosarcoma. Oncotarget 2014; 5: 9472-9483.
[21] Yang Y, Li H, Hou S, Hu B, Liu J and Wang J. The noncoding RNA expression profile and the ef -fect of lncRNA AK126698 on cisplatin
resis-tance in non-small-cell lung cancer cell. PLoS One 2013; 8: e65309.
[22] Pfaffl MW. A new mathematical model for rela -tive quantification in real-time RT-PCR. Nucleic Acids Res 2001; 29: e45.
[23] Snow K and Judd W. Characterisation of adria-mycin- and amsacrine-resistant human leu-kaemic T cell lines. Br J Cancer 1991; 63: 17-28.
[24] Sun M, Xia R, Jin F, Xu T, Liu Z, De W and Liu X. Downregulated long noncoding RNA MEG3 is associated with poor prognosis and promotes cell proliferation in gastric cancer. Tumour Biol 2014; 35: 1065-1073.
[25] Lu KH, Li W, Liu XH, Sun M, Zhang ML, Wu WQ, Xie WP and Hou YY. Long non-coding RNA MEG3 inhibits NSCLC cells proliferation and induces apoptosis by affecting p53 expres-sion. BMC Cancer 2013; 13: 461-466. [26] Qin R, Chen Z, Ding Y, Hao J, Hu J and Guo F.
Long non-coding RNA MEG3 inhibits the prolif-eration of cervical carcinoma cells through the induction of cell cycle arrest and apoptosis. Neoplasma 2013; 60: 486-492.
[27] Zhang B, Shi ZL, Liu B, Yan XB, Feng J and Tao HM. Enhanced anticancer effect of gem-citabine by genistein in osteosarcoma: the role of Akt and nuclear factor-kappaB. Anticancer Drugs 2010; 21: 288-296.
[28] Andela VB, Siddiqui F, Groman A and Rosier RN. An immunohistochemical analysis to eval-uate an inverse correlation between Runx2/ Cbfa1 and NF kappa B in human osteosarco -ma. J Clin Pathol 2005; 58: 328-330.
[29] Castro-Gamero AM, Borges KS, da Silva Silveira V, Lira RC, de Paula Gomes Queiroz R, Valera FC, Scrideli CA, Umezawa K and Tone LG. Inhibition of nuclear factor-kappaB by de -hydroxymethylepoxyquinomicin induces sched -ule-dependent chemosensitivity to anticancer drugs and enhances chemoinduced apoptosis in osteosarcoma cells. Anticancer Drugs 2012; 23: 638-650.
[30] Zhang F, Chen A, Chen J, Yu T and Guo F. SiRNA-mediated silencing of beta-catenin sup-presses invasion and chemosensitivity to doxo-rubicin in MG-63 osteosarcoma cells. Asian Pac J Cancer Prev 2011; 12: 239-245.
[31] Luetke A, Meyers PA, Lewis I and Juergens H. Osteosarcoma treatment - where do we stand? A state of the art review. Cancer Treat Rev 2014; 40: 523-532.
[32] Ponting CP, Oliver PL and Reik W. Evolution and functions of long noncoding RNAs. Cell 2009; 136: 629-641.
[33] Lee JT and Bartolomei MS. X-inactivation, im -printing, and long noncoding RNAs in health and disease. Cell 2013; 152: 1308-1323. [34] Gutschner T and Diederichs S. The hallmarks
LncRNA profiles in paired doxorubicin-resistant and sensitive osteosarcoma cell line
[35] Fan Y, Shen B, Tan M, Mu X, Qin Y, Zhang F and Liu Y. Long non-coding RNA UCA1 increases chemoresistances of bladder cancer cells by regulating Wnt signaling. FEBS J 2014; 281: 1750-8.
[36] Ding J, Li D, Gong M, Wang J, Huang X, Wu T and Wang C. Expression and clinical signifi -cance of the long non-coding RNA PVT1 in hu-man gastric cancer. Onco Targets Ther 2014; 7: 1625-1630.
[37] Milhem MM, Knutson T, Yang S, Zhu D, Wang X, Leslie KK and Meng X. Correlation of MTDH/ AEG-1 and HOTAIR Expression with Metastasis and Response to Treatment in Sarcoma Patients. J Cancer Sci Ther 2011; S5.
[38] Jiang M, Huang O, Xie Z, Wu S, Zhang X, Shen A, Liu H, Chen X, Wu J, Lou Y, Mao Y, Sun K, Hu S, Geng M and Shen K. A novel long non-cod-ing RNA-ARA: Adriamycin Resistance Asso- ciated. Biochem Pharmacol 2014; 87: 254-283.
[39] Wang Y, Zhang D, Wu K, Zhao Q, Nie Y and Fan D. Long noncoding RNA MRUL promotes ABCB1 expression in multidrug-resistant gas -tric cancer cell sublines. Mol Cell Biol 2014; 34: 3182-3193.
[40] Traverso N, Ricciarelli R, Nitti M, Marengo B, Furfaro AL, Pronzato MA, Marinari UM and Domenicotti C. Role of glutathione in cancer progression and chemoresistance. Oxid Med Cell Longev 2013; 2013: 972-913.
[41] Backos DS, Franklin CC and Reigan P. The role of glutathione in brain tumor drug resistance. Biochem Pharmacol 2012; 83: 1005-1012. [42] Brambila-Tapia AJ. MDR1 (ABCB1) polymor
-phisms: functional effects and clinical implica-tions. Rev Invest Clin 2013; 65: 445-454. [43] Rohwer N and Cramer T. Hypoxia-mediated
drug resistance: novel insights on the function-al interaction of HIFs and cell death pathways. Drug Resist Updat 2011; 14: 191-201. [44] Sui H, Fan ZZ and Li Q. Signal transduction
pathways and transcriptional mechanisms of ABCB1/Pgp-mediated multiple drug resistance in human cancer cells. J Int Med Res 2012; 40: 426-435.
[45] Cui YM, Jiang D, Zhang SH, Wu P, Ye YP, Chen CM, Tang N, Liang L, Li TT, Qi L, Wang SY, Jiao HL, Lin J, Ding YQ and Liao WT. FOXC2 pro -motes colorectal cancer proliferation through inhibition of FOXO3a and activation of MAPK and AKT signaling pathways. Cancer Lett 2014; 353: 87-94.
[46] Kume T. The Role of FoxC2 Transcription Factor in Tumor Angiogenesis. J Oncol 2012; 2012: 2045-2093.
Table S1. HOX cluster profiling
Probe Name type Seq. name Gene Symbol product
ASHGA5P021981 protein_coding NM_014212 HOXC11 homeobox protein Hox-C11
ASHGA5P033182 protein_coding ENST00000460041 HOXB-AS3 HOXB cluster antisense RNA 3 (non-protein coding) [Source: HGNC Symbol; Acc: 40283]
ASHGA5P053003 protein_coding NM_006735 HOXA2 homeobox protein Hox-A2
ASHGA5P005899 protein_coding NM_024017 HOXB9 homeobox protein Hox-B9
ASHGA5P032505 protein_coding NM_024015 HOXB4 homeobox protein Hox-B4
ASHGA5P053007 protein_coding NM_152739 HOXA9 homeobox protein Hox-A9
ASHGA5P036264 protein_coding NM_002148 HOXD10 homeobox protein Hox-D10
ASHGA5P053006 protein_coding NM_006896 HOXA7 homeobox protein Hox-A7
ASHGA5P036265 protein_coding NM_014213 HOXD9 homeobox protein Hox-D9
ASHGA5P032508 protein_coding NM_032391 PRAC small nuclear protein PRAC
ASHGA5P032507 protein_coding NM_004502 HOXB7 homeobox protein Hox-B7
ASHGA5P036262 protein_coding NM_021192 HOXD11 homeobox protein Hox-D11
ASHGA5P042956 protein_coding NM_024014 HOXA6 homeobox protein Hox-A6
ASHGA5P019589 protein_coding ENST00000576860 AC103702.1
ASHGA5P001267 protein_coding NM_018952 HOXB6 homeobox protein Hox-B6
ASHGA5P055442 protein_coding NM_153693 HOXC6 homeobox protein Hox-C6 isoform 2
ASHGA5P042958 protein_coding NM_005523 HOXA11 homeobox protein Hox-A11
ASHGA5P053002 protein_coding NM_005522 HOXA1 homeobox protein Hox-A1 isoform a
ASHGA5P032504 protein_coding NM_002145 HOXB2 homeobox protein Hox-B2
ASHGA5P049731 protein_coding ENST00000239144 HOXB8 homeobox B8 [Source: HGNC Symbol; Acc: 5119]
ASHGA5P032509 protein_coding NM_006361 HOXB13 homeobox protein Hox-B13
ASHGA5P028031 protein_coding NM_173860 HOXC12 homeobox protein Hox-C12
ASHGA5P028036 protein_coding NM_004503 HOXC6 homeobox protein Hox-C6 isoform 1
ASHGA5P028034 protein_coding NM_022658 HOXC8 homeobox protein Hox-C8
ASHGA5P032506 protein_coding NM_002147 HOXB5 homeobox protein Hox-B5
ASHGA5P028032 protein_coding NM_017409 HOXC10 homeobox protein Hox-C10
ASHGA5P042953 protein_coding NM_002141 HOXA4 homeobox protein Hox-A4
ASHGA5P049726 protein_coding NM_002146 HOXB3 homeobox protein Hox-B3
ASHGA5P013303 protein_coding NM_000523 HOXD13 homeobox protein Hox-D13
ASHGA5P053009 protein_coding NM_018951 HOXA10 homeobox protein Hox-A10
ASHGA5P019040 protein_coding ENST00000465846 HOXB-AS3 HOXB cluster antisense RNA 3 (non-protein coding) [Source: HGNC Symbol; Acc: 40283] ASHGA5P050709 protein_coding ENST00000313173 HOXD8 homeobox D8 [Source: HGNC Symbol; Acc: 5139]
ASHGA5P028037 protein_coding NM_018953 HOXC5 homeobox protein Hox-C5
ASHGA5P009527 protein_coding NM_153620 HOXA1 homeobox protein Hox-A1 isoform b
ASHGA5P020626 noncoding ENST00000517723 HOXA11-AS
LncRNA profiles in paired doxorubicin-resistant and sensitive osteosarcoma cell line
LncRNA profiles in paired doxorubicin-resistant and sensitive osteosarcoma cell line
ASHGA5P053008 noncoding ENST00000523790 HOXA-AS4
ASHGA5P043567 noncoding ENST00000521159 HOXA-AS2
ASHGA5P018465 noncoding ENST00000453875 HOTAIR
ASHGA5P035444 noncoding uc002ukl.1 AX747372
ASHGA5P027317 noncoding ENST00000512916 HOXC-AS5
ASHGA5P014844 noncoding NR_033979 HOXD-AS1
ASHGA5P015699 noncoding NR_024103 HOXB-AS5
ASHGA5P043571 noncoding ENST00000519694 HOXA-AS4
ASHGA5P015895 noncoding NR_047517 HOTAIR
ASHGA5P023235 noncoding ENST00000575202 CTD-2377D24.8
ASHGA5P053004 noncoding ENST00000517635 HOXA-AS2
ASHGA5P020372 noncoding ENST00000512427 HOXC-AS1
ASHGA5P055441 noncoding ENST00000509870 HOXC-AS3
ASHGA5P048470 noncoding TCONS_00013751 XLOC_006390
ASHGA5P027319 noncoding ENST00000567780 HOXC-AS3
ASHGA5P053012 noncoding NR_002795 HOXA11-AS
ASHGA5P049725 noncoding ENST00000504972 HOXB-AS1
ASHGA5P033186 noncoding ENST00000478824 CTD-2377D24.6
ASHGA5P015972 noncoding ENST00000425358 HOTAIRM1
ASHGA5P043566 noncoding ENST00000517641 HOXA-AS2
ASHGA5P015897 noncoding uc009zne.3 HOTAIR
ASHGA5P022204 noncoding ENST00000552156 HOXD-AS1
ASHGA5P019948 noncoding ENST00000505700 HOXC-AS1
ASHGA5P043570 noncoding ENST00000524304 HOXA-AS3
ASHGA5P015991 noncoding ENST00000425595 HOTAIR
ASHGA5P035445 noncoding NR_038435 HOXD-AS2
ASHGA5P043574 noncoding ENST00000520395 HOXA11-AS
ASHGA5P020493 noncoding ENST00000514702 HOXC-AS3
ASHGA5P050711 noncoding ENST00000447538 HOXD-AS1
ASHGA5P019075 noncoding NR_033201 HOXB-AS3
ASHGA5P036267 noncoding ENST00000426615 AC009336.24
ASHGA5P053010 noncoding ENST00000522863 HOXA11-AS
ASHGA5P016594 noncoding ENST00000432056 HOXB-AS5
ASHGA5P050710 noncoding uc002uku.3 LOC401022
ASHGA5P043576 noncoding uc022aat.1 AF071167
ASHGA5P018724 noncoding ENST00000456876 HOXD-AS1
ASHGA5P020414 noncoding ENST00000513165 HOXC-AS3
ASHGA5P033178 noncoding ENST00000435312 HOXB-AS1
ASHGA5P020875 noncoding ENST00000521231 HOXA-AS3
ASHGA5P028035 noncoding ENST00000562848 AC012531.25
ASHGA5P016768 noncoding NR_038367 HOTAIRM1
ASHGA5P019549 noncoding ENST00000491264 HOXB-AS3
ASHGA5P016351 noncoding NR_038366 HOTAIRM1
ASHGA5P043573 noncoding ENST00000519935 HOXA-AS4
ASHGA5P050712 noncoding ENST00000417086 HOXD-AS1
ASHGA5P015937 noncoding ENST00000425005 HOXD-AS1
ASHGA5P033181 noncoding ENST00000466037 HOXB-AS3
ASHGA5P043562 noncoding ENST00000428939 HOTAIRM1
ASHGA5P053005 noncoding uc003syl.3 BC035889
ASHGA5P019766 noncoding ENST00000502764 HOXB-AS1
LncRNA profiles in paired doxorubicin-resistant and sensitive osteosarcoma cell line
Table S2. The 31 pathways that corresponded to under-regulated transcripts
Pathway
ID Definition Fisher-P value FDR ment_Score
Enrich-hsa00480 Glutathione metabolism-Homo sapiens (human) 0.001081854 0.2988957 2.965831 hsa04151 PI3K-Akt signaling pathway-Homo sapiens (human) 0.003193819 0.2988957 2.49569 hsa04512 ECM-receptor interaction-Homo sapiens (human) 0.004178322 0.2988957 2.378998 hsa03320 PPAR signaling pathway-Homo sapiens (human) 0.004496584 0.2988957 2.347117 hsa00120 Primary bile acid biosynthesis-Homo sapiens (human) 0.00655458 0.2988957 2.183455 hsa00980 Metabolism of xenobiotics by cytochrome P450-Homo sapiens (human) 0.007978069 0.2988957 2.098102 hsa04270 Vascular smooth muscle contraction-Homo sapiens (human) 0.008055417 0.2988957 2.093912 hsa05205 Proteoglycans in cancer-Homo sapiens (human) 0.008859225 0.2988957 2.052604 hsa04672 Intestinal immune network for IgA production-Homo sapiens (human) 0.01051194 0.2988957 1.978317 hsa00982 Drug metabolism-cytochrome P450-Homo sapiens (human) 0.01105685 0.2988957 1.956369
hsa04978 Mineral absorption-Homo sapiens (human) 0.01194941 0.2988957 1.922654
hsa04974 Protein digestion and absorption-Homo sapiens (human) 0.01276423 0.2988957 1.894005
hsa04015 Rap1 signaling pathway-Homo sapiens (human) 0.01498147 0.3238302 1.824446
hsa01040 Biosynthesis of unsaturated fatty acids-Homo sapiens (human) 0.01683499 0.3379022 1.773787
hsa05323 Rheumatoid arthritis-Homo sapiens (human) 0.01810872 0.3392366 1.742112
hsa00604 Glycosphingolipid biosynthesis-ganglio series-Homo sapiens (human) 0.02144133 0.3765634 1.668748 hsa05322 Systemic lupus erythematosus-Homo sapiens (human) 0.02519406 0.3824459 1.598702
hsa05034 Alcoholism-Homo sapiens (human) 0.02596149 0.3824459 1.58567
hsa00380 Tryptophan metabolism-Homo sapiens (human) 0.02646644 0.3824459 1.577304
hsa00640 Propanoate metabolism-Homo sapiens (human) 0.02849546 0.3824459 1.545224
hsa00730 Thiamine metabolism-Homo sapiens (human) 0.03003075 0.3824459 1.522434
hsa05146 Amoebiasis-Homo sapiens (human) 0.03085572 0.3824459 1.510664
hsa04510 Focal adhesion-Homo sapiens (human) 0.03218423 0.3824459 1.492357
hsa05204 Chemical carcinogenesis-Homo sapiens (human) 0.03393482 0.3824459 1.469354
hsa05416 Viral myocarditis-Homo sapiens (human) 0.03535065 0.3824459 1.451603
hsa05218 Melanoma-Homo sapiens (human) 0.03639635 0.3824459 1.438942
hsa04146 Peroxisome-Homo sapiens (human) 0.03674747 0.3824459 1.434773
hsa00360 Phenylalanine metabolism-Homo sapiens (human) 0.04027689 0.4042073 1.394944
hsa05161 Hepatitis B-Homo sapiens (human) 0.04294515 0.4161237 1.367086
Table S3. The 25 pathways that corresponded to over-regulated transcripts
Pathway ID Definition Fisher-P value FDR Enrichment_Score