Original Article
Analysis of microarray-identified genes and microRNAs
associated with drug resistance in ovarian cancer
Jing Zou1*, Fuqiang Yin2*, Qi Wang1, Wei Zhang1, Li Li1
1Department of Gynecologic Oncology, Affiliated Tumor Hospital of Guangxi Medical University, Nanning 530021,
Guangxi, P.R. China; 2Medical Scientific Research Centre, Guangxi Medical University, Nanning 530021, Guangxi,
P.R. China. *Equal contributors.
Received March 30, 2015; Accepted May 25, 2015; Epub June 1, 2015; Published June 15, 2015
Abstract: The aim of this study was to identify potential microRNAs and genes associated with drug resistance in ovarian cancer through web-available microarrays. The drug resistant-related microRNA microarray dataset GS54665 and mRNA dataset GSE33482, GSE28646, and GSE15372 were downloaded from the Gene Expression Omnibus database. Dysregulated microRNAs/genes were screened with GEO2R and were further identified in SKOV3 (SKOV3/DDP) and A2780 (A2780/DDP) cells by real-time quantitative PCR (qRT-PCR), and then their associations with drug resistance was analyzed by comprehensive bioinformatic analyses. Nine microRNAs (microRNA-199a-5p, microRNA-199a-3p, microRNA-199b-3p, microRNA-215, microRNA-335, microRNA-18b, microRNA-363, microR-NA-645 and microRNA-141) and 38 genes were identified to be differentially expressed in drug-resistant ovarian cancer cells, with seven genes (NHSL1, EPHA3, USP51, ZSCAN4, EPHA7, SNCA and PI15) exhibited exactly the same expression trends in all three microarrays. Biological process annotation and pathway enrichment analysis of the 9 microRNAs and 38 genes identified several drug resistant-related signaling pathways, and the microRNA-mRNA interaction revealed the existence of a targeted regulatory relationship between the 9 microRNAs and most of the 38 genes. The expression of 9 microRNAs and the 7 genes by qRT-PCR in SKOV3/DDP and A2780/DDP cells in -dicating a consistent expression profile with the microarrays. Among those, the expression of EPHA7 and PI15 were negatively correlated with that of microRNA-141, and they were also identified as potential targets of this microRNA via microRNA-mRNA interaction. We thus concluded that microRNA-141, EPHA7, and PI15 might jointly participate in the regulation of drug resistance in ovarian cancer and serve as potential targets in targeted therapies.
Keywords: Ovarian cancer, drug resistance, expression profiling microarray, gene, microRNA, bioinformatics
Introduction
Ovarian cancer (epithelial carcinoma) is one of the three major malignancies of the female reproductive system. The mortality rate of ovar-ian cancer is the highest among all gynecologi-cal malignancies, and the prognosis of ovarian cancer is generally poor [1]. Currently, surgery is the primary treatment for ovarian cancer, and this treatment is usually supplemented with chemotherapy to deliver a comprehensive therapy. Platinum-based combination chemo-therapy improves the overall response rate, the clinical remission rate, and the median survival rate in patients with ovarian cancer. However, primary and acquired multidrug resistance (MDR) remains the main obstacles to the suc-cess of chemotherapeutic treatment in clinical
practice [2]. Therefore, an understanding of the mechanisms underlying the development and reversal of drug resistance in ovarian cancer patients is of great clinical significance for enhancing the survival rates and improving the prognosis of these patients.
AKT1/2D) that are associated with drug resis -tance in ovarian cancer. In the present study, microarray data detailing the messenger RNA (mRNA) and microRNA expression profiles in drug-sensitive and drug-resistant ovarian can-cer cells were retrieved from the Gene Expression Omnibus (GEO) database [4] and were analyzed to identify differentially expressed genes and microRNAs. The correla-tion between differentially expressed genes and microRNAs in drug-resistant and drug-sen-sitive ovarian cancer was examined through comprehensive bioinformatics analysis includ-ing biological process annotation, biological pathway enrichment, protein/gene interaction analysis, and mRNA-microRNA interaction anal-ysis. In addition, text mining was conducted to obtain clues and ideas for further experimental research regarding the mechanisms underlying drug resistance in ovarian cancer.
Materials and methods
Acquisition and analysis of datasets
Microarray data published prior to December 2014 detailing ovarian cancer chemoresis-tance-related microRNA and mRNA expression profiles were retrieved and downloaded from the National Center for Biotechnology Information (NCBI) GEO database (http://www. ncbi.nlm Nih.gov/geo). Queries were performed using “ovarian cancer” as a keyword. The search was restricted to the following specific fields: study type, expression profiling by array, and species: Homo sapiens. We downloaded microRNA expression microarray datasets GSE54665 and mRNA expression microarray datasets GSE33482, GSE28646 [5] and GSE15372 [6].
Inclusion criteria for differentially expressed microRNAs and genes
Differentially expressed microRNAs and genes were screened using the GEO2R tool in the GEO database. GEO2R is an R programming lan-guage-based dataset analysis tool that was launched in 2012. This tool is based on a t-test or analysis of variance (ANOVA) and is useful for comparing two groups of samples under the same experimental conditions to identify differ-entially expressed genes or microRNAs [7]. In the present study, microRNAs and genes that were differentially expressed between
drug-resistant and drug-sensitive ovarian cancer cells were screened using an adjusted p-value (adj. P) of less than 0.05 and a fold change of at least 2 (> 2-fold change) as thresholds. MicroRNAs or genes that were common to at least two expression profile datasets were selected using the Bioinformatics & Research Computing website (http://jura.wi.mit.edu/ bioc/tools/compare.php). Bioinformatic analy-sis of differentially expressed genes and microRNAs. Pathway enrichment analysis of differentially expressed microRNAs was per-formed using the DIANA miRPath (http:// diana.imis.athenainnovation.gr/DianaTools/in- dex.php? r=mirpath/index) [8]. DAVID (http:// david.abcc.ncifcrf.gov/) was used to analyze the pathway enrichment of differentially expressed genes [9]. Biological process anno-tation of differentially expressed genes was performed using ToppGene (http://toppgene. cchmc.org/) [10]. Protein/gene interactions we- re analyzed using GeneMANIA (http://www. genem ania.org/) [11] and mRNA-microRNA interactions were analyzed using the miRanda (http://www.microrna. org/microrna/home.do) [12], miRBase (http://www.mirbase.org/) [13], TargetScan (http://www. targetscan.org/) [14], miRWalk (http://www.umm.uni-heidelberg.de/ apps/zmf/mirwalk) [15] and RNA22 (http://cbc-srv.watson.ibm.com/ma 22 .html) [16] tools. Cell culture
The human ovarian cancer cell lines SKOV3 and A2780 were generated in our lab, and A2780/DDP was established from A2780 as previously described A stable cisplatin-resis-tant cell line, SKOV3/DDP, was established from SKOV3 by continuous exposure of the cells to increasing concentrations of DDP [17], and routinely maintained in 1640 (CORNING, USA) supplemented with 10% fetal bovine serum (FBS) (CORNING, USA), 2 μmol/L L-glutamine, 100 U/ml penicillin, and 100 μg/ ml streptomycin (Gibco BRL, Grand Island, NY) at 37°C in a humidified atmosphere containing 5% CO2.
Real-time quantitative PCR
manufacturer’s instructions. Real-time quan- titative PCR (qRT-PCR) was completed with FastStart Universal SYBR Green PCR Master (ROX) in a total volume of 10 µL on an ABI 7500 (Applied Biosystems, USA). The conditions were as follows: 40 cycles of three-step PCR (95°C for 15 sec, 55°C for 30 sec, and 72°C for 30 sec) following an initial denaturation at 95°C for 10 min. The microRNA sequences were analyzed using miRBase (http://microrna. sanger.ac.uk/sequences/). Details regarding the primers used to measure gene expression are listed in Supplementary Table 1. All primers were supplied by BGI. The 2-ΔΔ CT method was
used for data analysis [18].
mRNA: Total RNA was isolated as described above. First-strand cDNA was synthesized from 1 µg of total RNA using the Transcriptor First Strand cDNA Synthesis kit (Roche, Germany) as instructed by the manufacturer. qRT-PCR reactions were performed on an ABI 7500 real-time PCR system (Applied Biosystems, USA) using the following procedure: 95°C for 10 min, followed by 40 cycles of 95°C for 30 sec and 60°C for 1 min. To create a qRT-PCR standard,
glyceraldehyde 3-phosphate dehydrogenase (GAPDH) was used as an internal control. The sequences of the PCR primers are listed in Supplementary Table 2. The 2-ΔΔ CT method
was used for data analysis [18].
Results
Microarray datasets that met the inclusion criteria
[image:3.612.90.521.97.168.2]In the present study, the microRNA expression profiling datasets were GSE54665, which was generated by the Erasmus University Medical Center using the GPL16851 platform. The sam-ples used to generate the GSE54665 dataset were cisplatin-resistant A2780 ovarian cancer cells and parental A2780 cells (three sets each). The mRNA expression profiling datasets studied were GSE33482, GSE28646, and GSE15372. GSE33482 was generated by Queen’s University using the GPL640 microar-ray platform. The data were derived from cispl-atin-resistant A2780 ovarian cancer cells (A2780-cis) and parental A278 cells (six repeats of each). GSE28646 was generated by
Table 1. microRNA and gene expression microarray datasets related to the chemotherapy response in epithelial ovarian cancer
Accession number
of the dataset Organization name Platforms Design
Response to chemotherapy Resistance Sensitive microRNA GSE54665 Erasmus University Medical Center GPL16851 A2780/DDP AND A27800 3 3
mRNA GSE33482 Queen’s University GPL6480 A2780/cis AND A2780 6 6
GSE28646 Imperial College London GPL570 A2780/CP70 AND A2780 3 3
GSE15372 Indiana University GPL570 A2780-DDP AND A2780 5 5
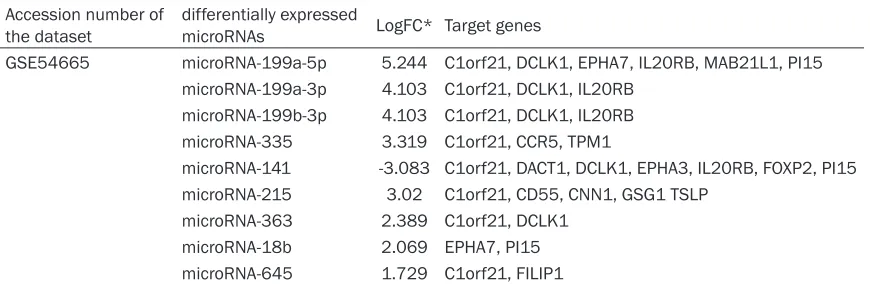
Table 2. Screening for differentially expressed microRNAs and their taget gens in the GSE54665 dataset
Accession number of
the dataset differentially expressed microRNAs LogFC* Target genes
GSE54665 microRNA-199a-5p 5.244 C1orf21, DCLK1, EPHA7, IL20RB, MAB21L1, PI15 microRNA-199a-3p 4.103 C1orf21, DCLK1, IL20RB
microRNA-199b-3p 4.103 C1orf21, DCLK1, IL20RB microRNA-335 3.319 C1orf21, CCR5, TPM1
microRNA-141 -3.083 C1orf21, DACT1, DCLK1, EPHA3, IL20RB, FOXP2, PI15 microRNA-215 3.02 C1orf21, CD55, CNN1, GSG1 TSLP
microRNA-363 2.389 C1orf21, DCLK1 microRNA-18b 2.069 EPHA7, PI15 microRNA-645 1.729 C1orf21, FILIP1
[image:3.612.90.525.215.357.2]the Imperial College of London using the GPL570 microarray platform. The data were derived from cisplatin-resistant A2780 ovarian cancer cells (A2780-CP70) and parental A2780 cells (three repeats of each). GSE15372 origi-nated from the Indiana University School of Medicine using the GPL570 microarray plat-form. The data were derived from cisplatin-resistant A2780 ovarian cancer cells (Round5- A2780) and parental A2780 cells (five repeats of each) (Table 1).
Differentially expressed microRNAs and path-way enrichment
The drug-resistant A2780 ovarian cancer cells and the parental A2780 cells used to generate
[image:5.612.87.530.85.241.2]199a-5p, microRNA199a-3p, microRNA199b- 3p, 645, 335, microRNA-18b, and microRNA-141 in SKOV3/DDP and A2780/DDP cells were in agreement with the results from the microRNA chip (Figure 1A, 1B). Among these differentially expressed microR-NAs, microRNA-335 [19] and microRNA-141 [20] have been proven to be associated with the regulation of drug resistance in ovarian can-cer. Pathway enrichment analysis was per-formed on these nine differentially expressed microRNAs using DIANA miRPath [8]. A total of 67 signaling pathways were identified (P < 0.05), and the 10 most significantly enriched pathways were selected according to their P values (Table 3).
Table 3. microRNAs and pathways related to drug resistance in ovarian cancer
Pathway Numbers of microRNAs P value Associations with drug resistance in ovarian cancer (Ref.)
microRNA199a-5p Focal adhesion 8 2.58E-13 YES [21]
microRNA199a-3p PI3K-Akt Signaling pathway 7 2.24E-12 YES [22] microRNA199b-3p Ubiquitin mediated proteolysis 7 4.76E-12 YES [23]
microRNA215 ErbB signaling pathway 9 1.78E-09 YES [24]
microRNA363 Regulation of actin cytoskeleton 8 2.74E-09
-microRNA335 Long-term potentiation 6 2.74E-09
-microRNA18b Gap junction 8 2.74E-09 YES [25]
microRNA141 Ascorbate and aldarate metabolism 3 9.60E-09 -microRNA-645 Calcium signaling pathway 8 9.60E-09 YES [26]
MAPK signaling pathway 9 4.30E-07 YES [27]
-indicates no reports or an inability to retrieve relevant reports.
Figure 2. Analysis of the differentially expressed genes in the three mRNA expression profiling datasets using the GEO2R tool. Note: Thresh -olds used in the GEO2R analysis: adj. P < 0.05, fold > 2.
[image:5.612.91.357.277.476.2]Screening for differentially expressed genes in three sets of mRNA microarrays and analysis of the correlation between differentially ex-pressed genes and drug resistance in ovarian cancer
In the present study, drug-resistant A2780 ovarian cancer cells and parental A2780 cells were used as the experimental group and the control group, respectively. The GSE33482, GSE28646, and GSE15372 datasets were screened using the GEO2R tool to identify genes that were differentially expressed between the experimental and control groups, and 1102, 761, and 927 differentially expressed genes were identified, respectively. A total of 38 genes were found to be significant -ly differential-ly expressed in all three microar-ray sets (Figure 2). (The list of the 38 diffe- rentially expressed genes is shown in Supplementary Table 3) Seven of the 38 genes, NHS-like 1 (NHSL1), ephrin type-A receptor 3 (EPHA3), ephrin type-A receptor 7 (EPHA7), peptidase inhibitor 15 (PI15), synuclein alp- ha (SNCA), ubiquitin-specific peptidase 51 (USP51), and zinc finger and SCAN domain-con -taining protein 4 (ZSCAN4), exhibited exactly the same expression trends in all three micro-array sets (Table 4), and qRT-PCR analysis showed that the expression of NHSL1, EPHA3, USP51, ZSCAN4, EPHA7, and PI15 in A2780/ DDP cells coincided with results from mRNA chips (these genes were not expressed in SKOV3/DDP or SKOV3 cells) (Figure 1C).
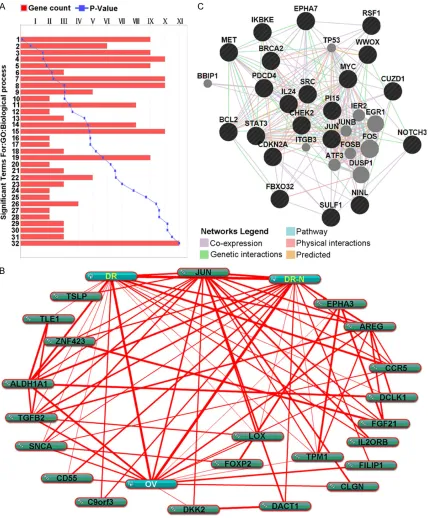
To reveal the biological significance of the com -monly differentially expressed genes in the regulation of ovarian cancer drug resistance at the unitary level, biological pathway
[image:6.612.92.524.96.214.2]enrich-ment and biological process annotation were performed on the above-described 38 genes using DAVID and ToppGene, respectively. DAVID-based signaling pathway enrichment analysis identified cytokine-cytokine receptor interaction pathways, whereas the ToppGene-based analysis identified a total of 32 biological processes that were significantly related to the 38 genes (P < 0.05). Among the 32 biological processes, cell adhesion and immunomodula-tory responses were found to be related to the regulation of drug resistance in ovarian cancer (Figure 3A). To further demonstrate the rela-tionship between the 38 commonly differen-tially expressed genes and the regulation of drug resistance in ovarian cancer, text mining was conducted using the COREMINE tool. Co-occurrence analysis of the literature was conducted using the gene names and “Ovarian Neoplasms”, “Drug Resistance”, and “Drug Resistance, Neoplasm” as keywords. The results revealed that 22 genes were present in the text-mining networks. Among these 22 genes, 13 genes were related to ovarian can-cer; 11 co-occurred with tumor drug resistance and multidrug resistance in the literature; and nine (aldehyde dehydrogenase 1 family, mem-ber A1 (ALDH1A1), JUN, C-C chemokine recep-tor type 5 (CCR5), SNCA, lysyl oxidase (LOX), cluster of differentiation 55 (CD55), tropomyo-sin 1 (TPM1), filamin A-interacting protein 1 (FILIP1), and transforming growth factor beta 2 (TGFB2)) were significantly related to ovarian cancer, multidrug resistance, and tumor drug resistance. In addition to significant correla -tions with “Ovarian Neoplasms”, “Drug Resistance”, and “Drug Resistance, Neoplasm”, the genes were also significantly related to each other, with the relationship between
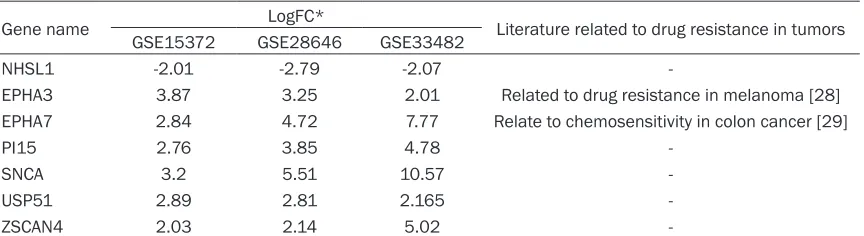
Table 4. The seven differentially expressed genes that exhibited exactly the same expression pattern trends in all three microarray datasets
Gene name LogFC* Literature related to drug resistance in tumors GSE15372 GSE28646 GSE33482
NHSL1 -2.01 -2.79 -2.07
-EPHA3 3.87 3.25 2.01 Related to drug resistance in melanoma [28] EPHA7 2.84 4.72 7.77 Relate to chemosensitivity in colon cancer [29]
PI15 2.76 3.85 4.78
-SNCA 3.2 5.51 10.57
-USP51 2.89 2.81 2.165
-ZSCAN4 2.03 2.14 5.02
ALDH1A1 and JUN presented as an example
Figure 3B.
Analysis of the correlation between tially expressed microRNAs and the differen-tially expressed genes associated with drug resistance in ovarian cancer
The correlation between the 9 dysregulated microRNAs (Table 2) and the 38 differentially expressed genes listed in Supplementary Table 3 was analyzed using five microRNA-mRNA interaction tools including miRanda, miRBase, TargetScan, miRWalk, and RNA22. Genes iden-tified by at least three prediction tools were selected as candidate targets, and the inter-sections of the candidate target genes with the 38 common differentially expressed genes in the three microarray datasets were deter-mined. As shown in Table 2, C1orf21 was pre-dicted as the target of the nine microRNAs, PI15 and interleukin 20 receptor beta (IL20RB) were predicted as the target of five microRNAs including 5p, microRNA199a-3p, microRNA199b-microRNA199a-3p, microRNA-141 and microRNA-363. In particular, EPHA7 and PI15 were identified as the potential target of microRNA-141, for which their expressions were negatively correlated in drug resistant ovarian cancer cells
Analysis of interactions between either EPHA7 or PI15 and the protein-coding genes associ-ated with drug resistance in ovarian cancer
The relationships between EPHA7 or PI15 and drug resistance-related oncogenes or tumor-suppressor genes in ovarian cancer were ana-lyzed using the GeneMANIA tool (http://www. genemania.org/). Among the 15 tumor sup-pressor genes [3] and 25 oncogenes [30] that have been reported to be related to the regula-tion of drug resistance in ovarian cancer, 19 were found to directly interact with PI15 and EPHA7 through co-expression, genetic interac-tion, physical interacinterac-tion, and joint participa-tion in signaling pathways (Figure 3C). Among the 19 directly interacting genes, 10 were found to directly interact with PI15, whereas nine directly interacted with EPHA7. The
onco-gene CUB and zona pellucida-like domain-con-taining protein 1 (CUZD1) were found to directly interact with both EPHA7 and PI15. In addition, in protein networks, tumor protein p53 (TP53) [31], early growth response 1 (EGR1) [32], FOS [33], and other genes were associated with the regulation of drug resistance in ovarian cancer.
Discussion
Ovarian cancer is a malignancy that poses a serious threat to women’s health. Ovarian can-cer has the highest degree of malignancy of all gynecological cancers [34]. Postoperative che-motherapy is the main approach employed for the treatment of ovarian cancer, and multidrug resistance is an important reason for the fail-ure of chemotherapy [2]. Previous studies have shown that multidrug resistance in ovarian can-cer is related to various factors, including dif-ferential expression of microRNAs, difdif-ferential expression of genes, and microRNA-controlled differential gene expression [35, 36]. Therefore, screening for and identifying microRNAs and genes that are differentially expressed between drug-resistant and drug-sensitive cells and investigating the correlations between differen-tially expressed microRNAs and genes may shed light on the molecular mechanisms under-lying drug resistance in ovarian cancer and may provide guidance for clinicians when choosing chemotherapy regimens and predicting pro- gnosis.
NA-18b, and microRNA-141 expression analy-sis in SKOV3/DDP and A2780/DDP cells agreed with the results obtained from the microRNA chip (Figure 1A, 1B). Among the top 10 signal-ing pathways regulated by the nine identified microRNAs, at least seven were related to the regulation of drug resistance in ovarian cancer, including the focal adhesion pathway [21], the phosphatidylinositol 3-kinase (PI3K-Akt) signal -ing pathway [22], the erythroblastosis onco-gene B (ErbB) signaling pathway [24], the mito-gen-activated protein kinase (MAPK) signaling pathway [27]. These findings indicate that the nine microRNAs that are differentially expressed in drug-resistant ovarian cancer cells may be associated with the regulation of drug resistance in ovarian cancer. Previous studies have shown that microRNA199a-3p promotes the sensitivity of hepatoma cells to doxorubicin by targeting mammalian target of rapamycin (mToR) and c-Met [36], microR-NA199a-5p is related to multidrug resistance in colon cancer [37] and cisplatin resistance in liver cancer [38]. MicroRNA-215 is related to chemoresistance and the loss of sensitivity to radiotherapy in colon cancer [39], and microR-NA-141 participates in the regulation of drug resistance in ovarian cancer by regulating Kelch-like ECH-associated protein 1 (KEAP1) [20].
Three sets of mRNA expression profiles were analyzed, and a total of 38 genes were identi-fied as differentially expressed in drug-resistant ovarian cancer cells. Enrichment analysis of biological processes and signaling pathways showed that the above-described 38 differen-tially expressed genes are significantly related to a series of biological processes such as cell adhesion, immunomodulation, and cytokine-cytokine receptor interactions. These process-es have been proven to be closely related to the regulation of drug resistance in ovarian cancer. A previous study has demonstrated that cell adhesion is a critical step leading to the occur-rence of peritoneal metastasis [40]. Peritoneal metastasis indicates that ovarian cancer is already at an advanced stage, which is fre-quently associated with a lack of sensitivity to chemotherapy. Cytokine-cytokine receptor interaction pathways are involved in cell growth, differentiation, and death as well as blood ves-sel formation, and further study had indicated that the involvement of cytokine-cytokine
receptor interactions in drug resistance would proceed via tumor-stroma communication [41]. These results reveal that the 38 genes that are significantly differentially expressed in all three drug-resistant ovarian cancer cell-derived gene expression profile datasets may be involved in the regulation of drug resistance in ovarian cancer through participating in processes such as cell adhesion, immunomodulatory respons-es, and cytokine-cytokine receptor intera- ctions.
Text mining was performed on the 38 genes using the COREMINE search and analysis tool. We discovered that ALDH1A1, JUN, CCR5, SNCA, LOX, CD55, TPM1, FILIP1, and TGFB2 are significantly correlated with ovarian cancer, drug resistance, and multidrug resistance in tumors. These results indicate that the above-mentioned genes may be involved in the regula-tion of drug resistance in ovarian cancer, which is consistent with the findings of previous stud -ies. Four of the nine genes described above, ALDH1A1, JUN, LOX, and CD55, have been shown to be related to drug resistance in ovar-ian cancer [42-45].
Epigenetic regulation of microRNAs plays an important role in the regulation of drug resis-tance in ovarian cancer. Aberrant gene expres-sion due to the action of microRNAs is an important mechanism underlying drug resis-tance in ovarian cancer. Therefore, in the pres-ent study, microRNA-mRNA interaction analysis was conducted using microRNA and mRNA expression profiles to obtain additional infor -mation related to the regulation of drug resis-tance in ovarian cancer. By analyzing interac-tions between differentially expressed microR-NAs and differentially expressed genes in drug-resistant and drug-sensitive ovarian cancer cells, we discovered that nine microRNAs may have regulatory effects on nearly half of the 38 identified genes. These findings indicate that the differentially expressed microRNAs and genes described above may act in concert to regulate drug resistance in ovarian cancer. MicroRNA-target relationships existed between C1orf21 and all nine microRNAs as well as between PI15 or IL20RB and three of the nine microRNAs.
can-cer, EPHA7 and PI15 might significantly corre -late with drug resistance in ovarian cancer. Firstly, only seven (NHSL1, EPHA3, EPHA7, PI15, SNCA, USP51, and ZSCAN4) of the 38 genes exhibited exactly the same expression trends in the three mRNA microarrays, from which the EPHA7 and PI15 were included. The expression of EPHA7 and PI15 was significantly downregulated in the three independent drug-resistant A2780 ovarian cancer cells (a fold change of at least 2.7 was noted in both genes), and our qRT-PCR data showed that the expres-sion of six genes, including NHSL1, EPHA3, USP51, ZSCAN4, EPHA7, and PI15, in A2780/ DDP cells was consistent with data from mRNA chips (these genes were not expressed in SKOV3/DDP or SKOV3 cells) (Figure 1C). Secondly, the negative regulatory relationships between microRNA-141 and the two genes were predicted. MicroRNA-141 was found to be highly expressed in drug-resistant A2780 ovar-ian cancer cells. MicroRNA-mRNA interaction analysis showed that EPHA7 and PI15 are potential target genes of microRNA-141. Additionally, a previous study showed that microRNA-141 is significantly related to the regulation of drug resistance in ovarian cancer [20]. Third, protein/gene interaction analysis showed that PI15 and EPHA7 directly interact with multiple genes related to drug resistance in ovarian cancer through genetic co-expres-sion, genetic interaction, physical interaction, and joint participation in signaling pathways. In a protein/gene interaction network composed of 31 genes, PI15 directly interacts with a total of 11 genes. Among these 11 genes, five are oncogenes (inhibitor of nuclear factor kappa-B kinase subunit epsilon (IKBKE), ninein-like pro -tein (NINL), neurogenic locus notch homolog protein 3 (NOTCH3), signal transducer and acti-vator of transcription 3 (STAT3), and CUZD1), and six are tumor-suppressor genes (cyclin-dependent kinase inhibitor 2A (CDKN2A), F-box protein 32 (FBXO32), interleukin 24 (IL24), pro-grammed cell death protein 4 (PDCD4), sulfa-tase 1 (SULF1), and WW domain-containing oxidoreductase (WWOX)). EPHA7 was found to directly interact with a total of nine genes, among which seven are oncogenes (B-cell lym-phoma 2 (BCL2), CUZD1, JUN, MET, MYC, remodeling and spacing factor 1 (RSF1), and SRC), and two are tumor-suppressor genes (breast cancer 2 early onset (BRCA2), and checkpoint kinase 2 (CHEK2)). The oncogene
CUZD1 was found to directly interact with both PI15 and EPHA7. The above-mentioned onco-genes and proto-oncoonco-genes have been proven to be related to the regulation of multidrug resistance in ovarian cancer [3, 30]. For exam-ple, the STAT3 gene is related to platinum and paclitaxel resistance in ovarian cancer [35]. These results indicate that PI15 and EPHA7, which are significantly correlated with the 22 drug resistance-related protein-coding genes in ovarian cancer, are also likely to be associated with the regulation of drug resistance in ovarian cancer. Fourth, through a query of signaling pathways in the Kyoto Encyclopedia of Genes and Genomes (KEGG), we found that EPHA7 is upstream of the MAPK pathway, which is a criti -cal signaling pathway that regulates drug resis-tance in ovarian cancer. In summary, PI15 and EPHA7 are important candidate protein-coding genes that may be involved in the regulation of drug resistance in ovarian cancer. The exact roles of PI15 and EPHA7 will require further in-depth study.
Disclosure of conflict of interest
None.
Address correspondence to: Dr. Li Li, Department of Gynecologic Oncology, Affiliated Tumor Hospital of Guangxi Medical University, 71 Hedi Road, Nanning 530021, Guangxi, P.R. China. E-mail: [email protected]. cn
References
[1] Siegel R, Naishadham D and Jemal A. Cancer statistics, 2013. CA Cancer J Clin 2013; 63: 11-30.
[2] Gou Q, Liu L, Wang C, Wu Q, Sun L, Yang X, Xie Y, Li P and Gong C. Polymeric nanoassemblies entrapping curcumin overcome multidrug re-sistance in ovarian cancer. Colloids Surf B Biointerfaces 2015; 126: 26-34.
[3] Yin F, Liu X, Li D, Wang Q, Zhang W and Li L. Tumor suppressor genes associated with drug resistance in ovarian cancer (review). Oncol Rep 2013; 30: 3-10.
[4] Davis S and Meltzer PS. GEOquery: a bridge between the Gene Expression Omnibus (GEO) and BioConductor. Bioinformatics 2007; 23: 1846-1847.
in ovarian cancer identified by methylome and expression profiling. Oncogene 2012; 31: 4567-4576.
[6] Li M, Balch C, Montgomery JS, Jeong M, Chung JH, Yan P, Huang TH, Kim S and Nephew KP. Integrated analysis of DNA methylation and gene expression reveals specific signaling pathways associated with platinum resistance in ovarian cancer. BMC Med Genomics 2009; 2: 34.
[7] Barrett T, Wilhite SE, Ledoux P, Evangelista C, Kim IF, Tomashevsky M, Marshall KA, Phillippy KH, Sherman PM, Holko M, Yefanov A, Lee H, Zhang N, Robertson CL, Serova N, Davis S and Soboleva A. NCBI GEO: archive for functional genomics data sets--update. Nucleic Acids Res 2013; 41: D991-995.
[8] Vlachos IS, Kostoulas N, Vergoulis T, Georgakilas G, Reczko M, Maragkakis M, Paraskevopoulou MD, Prionidis K, Dalamagas T and Hatzigeorgiou AG. DIANA miRPath v.2.0: investigating the combinatorial effect of mi-croRNAs in pathways. Nucleic Acids Res 2012; 40: W498-504.
[9] Huang da W, Sherman BT and Lempicki RA. Systematic and integrative analysis of large gene lists using DAVID bioinformatics resourc -es. Nat Protoc 2009; 4: 44-57.
[10] Chen J, Bardes EE, Aronow BJ and Jegga AG. ToppGene Suite for gene list enrichment analy-sis and candidate gene prioritization. Nucleic Acids Res 2009; 37: W305-311.
[11] Mostafavi S, Ray D, Warde-Farley D, Grouios C and Morris Q. GeneMANIA: a real-time multiple association network integration algorithm for predicting gene function. Genome Biol 2008; 9 Suppl 1: S4.
[12] John B, Enright AJ, Aravin A, Tuschl T, Sander C and Marks DS. Human MicroRNA targets. PLoS Biol 2004; 2: e363.
[13] Griffiths-Jones S, Saini HK, van Dongen S and Enright AJ. miRBase: tools for microRNA ge-nomics. Nucleic Acids Res 2008; 36: D154-158.
[14] Lewis BP, Burge CB and Bartel DP. Conserved seed pairing, often flanked by adenosines, in -dicates that thousands of human genes are microRNA targets. Cell 2005; 120: 15-20. [15] Dweep H, Gretz N and Sticht C. miRWalk
data-base for miRNA-target interactions. Methods Mol Biol 2014; 1182: 289-305.
[16] Loher P and Rigoutsos I. Interactive explora-tion of RNA22 microRNA target predicexplora-tions. Bioinformatics 2012; 28: 3322-3323.
[17] Li L, Luan Y, Wang G, Tang B, Li D, Zhang W, Li X, Zhao J, Ding H, Reed E and Li QQ. Development and characterization of five cell models for chemoresistance studies of human ovarian carcinoma. Int J Mol Med 2004; 14: 257-264.
[18] Rao X, Huang X, Zhou Z and Lin X. An improve-ment of the 2ˆ(-delta delta CT) method for quantitative real-time polymerase chain reac-tion data analysis. Biostat Bioinforma Biomath 2013; 3: 71-85.
[19] Sorrentino A, Liu CG, Addario A, Peschle C, Scambia G and Ferlini C. Role of microRNAs in drug-resistant ovarian cancer cells. Gynecol Oncol 2008; 111: 478-486.
[20] van Jaarsveld MT, Helleman J, Boersma AW, van Kuijk PF, van Ijcken WF, Despierre E, Vergote I, Mathijssen RH, Berns EM, Verweij J, Pothof J and Wiemer EA. miR-141 regulates KEAP1 and modulates cisplatin sensitivity in ovarian cancer cells. Oncogene 2013; 32: 4284-4293.
[21] Li J, Zhang Y, Gao Y, Cui Y, Liu H, Li M and Tian Y. Downregulation of HNF1 homeobox B is as-sociated with drug resistance in ovarian can-cer. Oncol Rep 2014; 32: 979-988.
[22] Cheaib B, Auguste A and Leary A. The PI3K/ Akt/mTOR pathway in ovarian cancer: thera-peutic opportunities and challenges. Chin J Cancer 2015; 34: 4-16.
[23] Su JL, Cheng X, Yamaguchi H, Chang YW, Hou CF, Lee DF, Ko HW, Hua KT, Wang YN, Hsiao M, Chen PB, Hsu JM, Bast RC Jr, Hortobagyi GN and Hung MC. FOXO3a-Dependent Mechanism of E1A-Induced Chemosensitization. Cancer Res 2011; 71: 6878-6887.
[24] Shen G, Huang H, Zhang A, Zhao T, Hu S, Cheng L, Liu J, Xiao W, Ling B, Wu Q, Song L and Wei W. In vivo activity of novel anti-ErbB2 antibody chA21 alone and with Paclitaxel or Trastuzumab in breast and ovarian cancer xe-nograft models. Cancer Immunol Immunother 2011; 60: 339-348.
[25] Barhoumi R, Bailey HR, Hutchinson RW, Bowen JA and Burghardt RC. Enhancement of mel-phalan toxicity by octanol in ovarian adenocar-cinoma cell lines: effects of altered cell-cell communication, glutathione levels, and plas-ma membrane fluidity. Fundam Appl Toxicol 1995; 25: 70-79.
[26] Al-Bahlani S, Fraser M, Wong AY, Sayan BS, Bergeron R, Melino G and Tsang BK. P73 regu -lates cisplatin-induced apoptosis in ovarian cancer cells via a calcium/calpain-dependent mechanism. Oncogene 2011; 30: 4219-4230. [27] Campbell RM, Anderson BD, Brooks NA,
Brooks HB, Chan EM, De Dios A, Gilmour R, Graff JR, Jambrina E, Mader M, McCann D, Na S, Parsons SH, Pratt SE, Shih C, Stancato LF, Starling JJ, Tate C, Velasco JA, Wang Y and Ye XS. Characterization of LY2228820 dimesyl-ate, a potent and selective inhibitor of p38 MAPK with antitumor activity. Mol Cancer Ther 2014; 13: 364-374.
Linette GP, McMichael JF, Sondak VK, Fields RC, Ley TJ, Mule JJ, Wilson PK and Weber JS. Clonal architectures and driver mutations in metastatic melanomas. PLoS One 2014; 9: e111153.
[29] Kim JC, Kim SY, Cho DH, Roh SA, Choi EY, Jo YK, Jung SH, Na YS, Kim TW and Kim YS. Genome-wide identification of chemosensitive single nucleotide polymorphism markers in colorectal cancers. Cancer Sci 2010; 101: 1007-1013.
[30] X Liu, Y Gao, Y Lu, J Zhang, L Li and F Yin. Oncogenes associated with drug resistance in ovarian cancer. J Cancer Res Clin Oncol 2015; 141: 381-395.
[31] Brachova P, Mueting SR, Carlson MJ, Goodheart MJ, Button AM, Mott SL, Dai D, Thiel KW, Devor EJ, Leslie KK. TP53 oncomor -phic mutations predict resistance to platinum and taxanebased standard chemotherapy in patients diagnosed with advanced serous ovarian carcinoma. Int J Oncol 2015; 46: 607-618.
[32] Lu M, Xiao L, Hu J, Deng S and Xu Y. Targeting of p38 mitogen-activated protein kinases to early growth response gene 1 (EGR-1) in the human paclitaxel-resistance ovarian carcino-ma cells. J Huazhong Univ Sci Technolog Med Sci 2008; 28: 451-455.
[33] Moorehead RA and Singh G. Influence of the proto-oncogene c-fos on cisplatin sensitivity. Biochem Pharmacol 2000; 59: 337-345. [34] Sharifian A, Pourhoseingholi MA, Norouzinia M
and Vahedi M. Ovarian cancer in Iranian wom -en, a trend analysis of mortality and incidence. Asian Pac J Cancer Prev 2014; 15: 10787-10790.
[35] Sheng WJ, Jiang H, Wu DL and Zheng JH. Early responses of the STAT3 pathway to platinum drugs are associated with cisplatin resistance in epithelial ovarian cancer. Braz J Med Biol Res 2013; 46: 650-658.
[36] Fornari F, Milazzo M, Chieco P, Negrini M, Calin GA, Grazi GL, Pollutri D, Croce CM, Bolondi L and Gramantieri L. MiR-199a-3p regulates mTOR and c-Met to influence the doxorubicin sensitivity of human hepatocarcinoma cells. Cancer Res 2010; 70: 5184-5193.
[37] Kong Y, Bai PS, Sun H, Nan KJ, Chen NZ and Qi XG. The deoxycholic acid targets miRNA-de-pendent CAC1 gene expression in multidrug resistance of human colorectal cancer. Int J Biochem Cell Biol 2012; 44: 2321-2332.
[38] Xu N, Zhang J, Shen C, Luo Y, Xia L, Xue F and Xia Q. Cisplatin-induced downregulation of miR-199a-5p increases drug resistance by ac-tivating autophagy in HCC cell. Biochem Biophys Res Commun 2012; 423: 826-831. [39] Svoboda M, Sana J, Fabian P, Kocakova I,
Gombosova J, Nekvindova J, Radova L, Vyzula R and Slaby O. MicroRNA expression profile as -sociated with response to neoadjuvant chemo-radiotherapy in locally advanced rectal cancer patients. Radiat Oncol 2012; 7: 195.
[40] Lis R, Touboul C, Halabi NM, Madduri AS, Querleu D, Mezey J, Malek JA, Suhre K and Rafii A. Mesenchymal cell interaction with ovar -ian cancer cells induces a background depen-dent pro-metastatic transcriptomic profile. J Transl Med 2014; 12: 59.
[41] Morales M, Planet E, Arnal-Estape A, Pavlovic M, Tarragona M and Gomis RR. Tumor-stroma interactions a trademark for metastasis. Breast 2011; 20 Suppl 3: S50-55.
[42] Meng E, Mitra A, Tripathi K, Finan MA, Scalici J, McClellan S, Madeira da Silva L, Reed E, Shevde LA, Palle K and Rocconi RP. ALDH1A1 maintains ovarian cancer stem cell-like proper-ties by altered regulation of cell cycle check-point and DNA repair network signaling. PLoS One 2014; 9: e107142.
[43] Amable L, Gavin E, Kudo K, Meng E, Rocconi RP, Shevde LA and Reed E. GLI1 upregulates C-JUN through a specific 130-kDa isoform. Int J Oncol 2014; 44: 655-661.
[44] Januchowski R, Zawierucha P, Rucinski M, Nowicki M and Zabe Ml. Extracellular matrix proteins expression profiling in chemoresistant variants of the A2780 ovarian cancer cell line. Biomed Res Int 2014; 2014: 365867.
Supplementary Table 1. Primer list 1
Primer sequences (5’- > 3’)
microRNA-141-5p TCCAACACTGTACTGGAAGATG
microRNA-141-3p CCATCTTTACCAGACAGTGTTAGC
microRNA-199a-5p GAAACAGGTAGTCTGAACACTGGG
microRNA-199a-3p CTAACCAATGTGCAGACTACTGT
microRNA-199b-3p TAACCAATGTGCAGACTACTGT
microRNA-335-5p ACATTTTTCGTTATTGCTCTTGAGC
microRNA-335-3p GGTCAGGAGCAATAATGAAAAAGC
microRNA-215-5p GTCTGTCAATTCATAGGTCATGC
microRNA-215-3p TATTGGCCTAAAGAAATGACAGAGC
microRNA-363-5p GAATTGCATCGTGATCCACCCG
microRNA-363-3p TACAGATGGATACCGTGCAATTGC
microRNA-18b-5p CTAACTGCACTAGATGCACCTTAG
microRNA-18b-3p AGAAGGGGCATTTAGGGCAG
microRNA-645 TCAGCAGTACCAGCCTAGAG
U6 CAAGGATGACACGCAAATTCG
Supplementary Table 2. Primer list 2
Primer sequences (5’- > 3’)
GAPDH Forward primer GTCAAGGCTGAGAACGGGA
Reverse primer AAATGAGCCCCAGCCTTCTC
NHSL1 Forward primer TGAGGGAATGCGATAAGTTGC
Reverse primer TGGTCCAGTTCGTCTGAGTATT
EPHA3 Forward primer AGCTGGGCTGGATCTCTTATC
Reverse primer GGTAAGTCCTGATGGGTGTGT
SNCA Forward primer TGGTGAGCGAAACAGAAGCC
Reverse primer CCATAGCAACCTGCGTAATGAA
USP51 Forward primer CCAGGTTCGAGAAACTTCTTTGC
Reverse primer TCACGCTCTTGTAATGGCTCC
ZSCAN4 Forward primer TTTCAGTGTGAACCATCCGAG
Reverse primer AGCACCATTCTTGAGAACTCAG
EPHA7 Forward primer AGAACTATACCCCGATACGAACA
Reverse primer TGGAAATCCAGTTAGTCCGCA
PI15 Forward primer CAAGTACCGTCGTCCTACTCA
Supplementary Table 3. 38 differentially expressed genes
Gene name Gene ID Gene name Gene ID
ALDH1A1 216 JUN 3725
AREG 374 LOX 4015
ASXL3 80816 MAB21L1 4081
C1orf21 81563 OLFM3 118427
81563 84909 OTUD1 220213
CCDC178 374864 PDK3 5165
CCR5 1234 RTN1 6252
CD55 1604 TGFB2 7042
CLGN 1047 TLE1 7088
CNN1 1264 TPM1 7168
DACT1 51339 TSLP 85480
DCLK1 9201 NHSL1 57224
DKK2 27123 PI15 51050
FGF21 26291 SNCA 6622
FILIP1 27145 USP51 158880
FOXP2 93986 EPHA3 2042
GSG1 83445 EPHA7 2045
IL20RB 53833 ZNF423 23090