Original Article
Neutrophil-lymphocyte ratio and platelet-lymphocyte
ratio in evaluation of the development of
polycystic kidney disease
Qing-Quan Liu1, Zhi-Gang He2, Qing Xu1, Wen-Hui Qiu1, Hong-Bing Xiang2, Yong-Man Lv1
Departments of 1Nephrology, 2Anesthesiology and Pain Medicine, Tongji Hospital of Tongji Medical College,
Huazhong University of Science & Technology, Wuhan, Hubei, PR China
Received January 20, 2016; Accepted April 18, 2016; Epub June 1, 2016; Published June 15, 2016
Abstract: Background: It is well known that the neutrophil-lymphocyte ratio (NLR) and platelet-lymphocyte ratio
(PLR) are available markers of systemic inflammation, and increased inflammation is along with progress of chronic kidney disease (CKD). The inflammation is risk factors for increased morbidity and mortality in autosomal dominant
polycystic kidney disease (ADPKD). Therefore, we evaluate the association between the NLR and PLR level and unfavorable prognosis in ADPKD patients. Methods: A total of 65 ADPKD patients with preserved renal function, 50 ADPKD patients with end-stage renal disease (ESRD) need dialysis and 32 healthy volunteers were included. The level of NLR and PLR were recorded in different stages of ADPKD patients, and investigated if NLR and PLR could
predict development of ADPKD. We also examined the expression of inflammation marker in renal interstitium of
ADPKD patients. Results: The level of NLR (5.22 ± 2.91 vs 3.38 ± 2.03, P < 0.001) and PLR (203.8 ± 121 vs 152.2
± 70.9, P < 0.001) were significantly higher in ADPKD patients with dialysis than ADPKD patients without dialysis,
and the level of NLR (3.38 ± 2.03 vs 1.42 ± 0.58, P < 0.0001) and PLR (152.2 ± 70.9 vs 92.7 ± 26.9, P < 0.0001)
were significantly higher in ADPKD patients without dialysis than in controls. Increased NLR over 4.3 and PLR over
174 were related to increase the events of dialysis. A cutoff value for NLR > 2.65 and PLR > 130.2 could predict
development of renal function deficit (RFD) with the sensitivity 74.7%, 66.7% and specificity 96.9%, 96.9%, respec
-tively. In addition, the CD45 staining significantly increased in ADPKD groups. Conclusions: We conclude that NLR
and PLR are significantly higher in ADPKD patients with RFD and increase across worsening CKD stages. Our data
suggest that lower NLR and PLR level may be potential and novel preventive and therapeutic options for ADPKD patients.
Keywords: Neutrophil-lymphocyte ratio, platelet-lymphocyte ratio, polycystic kidney disease, chronic kidney dis-ease, prognosis
Introduction
The leading cause of mortality in autosomal dominant polycystic kidney disease (ADPKD) is cardiovascular disease [1, 2]. Menon et al. demonstrated ADPKD patients with higher plasma level of CRP and interleukin (IL)-6, and the levels of inflammation markers were pro-nounced with worse kidney disease [3]. Although the CRP and IL-6 are recognized inflammation markers, however, detecting of CRP is still not as a routine examination in nephrology clinics worldwide [4]. Higher levels of inflammatory markers were reported to be associated with faster progression of chronic kidney disease (CKD) in patients, while total
marker to determine inflammation in cardiac and end-stage renal disease (ESRD) [10, 11]. Although Turkmen reported that the ADPKD patients had higher levels of NLR compared with normal group [12], and platelet to lympho- cyte ratio (PLR) was reported to be a simple and valuable prognostic marker for acute coro-nary syndrome in a few studies [13], limited data are available regarding assessment of NLR and PLR in relation to renal diseases, namely in ADPKD patients, The cause-and-effect relationship between ADPKD and NLR, PLR is still no clear. Therefore, the present study was designed to evaluate the NLR and PLR in relation to the progress of ADPKD patients.
Materials and methods
Study population
A total of 115 ADPKD patients [mean (SD) age 50 (10.4) years, 55.7% were females], including 43.5% with end-stage renal disease (ESRD) and 56.5% with preserved renal function, and 32 healthy volunteers [mean (SD) age 47 (9.5) years, 56.3% were females] were included in this cross-sectional study. Exclusion criteria also included acute infections, cancer, steroid use, WBC > 103/mm3, Platelet count < 1000
mL.The study protocol was approved by the Medical Ethics Committee of Huazhong Scien- ce and Technology University. Written informed consent was obtained from all subjects includ-ed in the study. The diagnosis of ADPKD was defined by the ultrasonographic criteria de- scribed by Ravine et al. [14].
Study parameters
Data on patient demographics, BMI (kg/m2),
Systolic blood pressure ≥ 140 mmHg and/or diastolic blood pressure ≥ 90 mmHg in mea-surements, or being on antihypertensive medi-cations were defined as arterial hypertension, complete blood count, blood biochemistry including uric acid (mg/dL), and lipid parame-ters including total cholesterol (mg/dL), LDL cholesterol (LDL-c; mg/dL) and triglyceride (mg/ dL). ADPKD patients with preserved renal func-tion were classified according to the level of glo-merular filtration rate which was estimated according to the Modification of Diet in Renal Disease (MDRD) equation: eGFR (ml·min-1·1.73
m-2) = 186 × plasma Cr (mg/dl)-1.154 × age
(years)-0.203 (× 0.742, if female subjects), where
the Cr indicates serum creatinine [15]. The renal function deficit (RFD) was defined as a eGFR ≤ 89 mL/min/1.73 m2 and classified as
follows: eGFR ≥ 90 ml·min-1·1.73 m-2 with stage
1; eGRF = 60-89.9 ml·min-1·1.73 m-2 with stage
2; eGRF = 30-59.9 ml·min-1·1.73 m-2 with stage
3; eGRF = 15-29.9 ml·min-1·1.73 m-2 with stage
4; eGRF < 15 ml·min-1·1.73 m-2 with stage 5.
Patients in stages 2, 3, and 4 were considered as having RFD. Patients in stage 1 were consid-ered as not having renal function deficit [16]. Complete blood count and definition of NLR, PLR
Whole blood cell counts were determined by using automated hematological analyzer Pentra 120 Retic (ABX, Montpellier, France). NLR was calculated as the ratio of the neutro-phil and lymphocytes, PLR as the ratio of the platelet and lymphocyte according to the parameters of peripheral blood sample which were obtained at the time of patient’s admis-sion and before 24 hours next hemodialy- sis. ADPKD patients were separated into two groups according to mean value of NLR (group 1: PLR < 4.3, and group 2: NLR ≥ 4.3), or the mean value of PLR (group 1: PLR < 174, and group 2: PLR ≥ 174).
Immunohistochemistry analysis
A total of 6 polycystic kidney tissues from ADPKD patients performed windowing decom-pression in Tongji Hospital; control tissue was obtained from 6 patients who underwent nephrectomy for renal neoplasms. Paraffin-embedded formalin-fixed tissue was used to perform immunohistochemistry for CD45, which was one of the most abundant molecules expressed on the white blood cell surface. The primary antibody is the Rabbit polyclonal to CD45 (1:100 dilution, Abcam, ab10558). After washing in phosphate-buffered saline, the slides were incubated with goat anti-rabbit IgG antibody conjugated to horseradish peroxidase (DAKO, Tokyo, Japan) for 30 min at room tem-perature. The signal reaction was visualized with diamino-benzidine, and the slides were then counter-stained with hematoxylin stains. Statistical analyses
Abnormally distributed variables were express- ed as median (range) and normally distributed variables were as mean ± SD. Differences were considered significant when P values were less than 0.05. The normality of distribution of all variables was tested using the Kolmogorov-Smirnov test. Dichotomous variables were compared using the Chi-square test. Statistical differences between parametric data of two groups were analyzed using the Student’s t-test. The Mann Whitney U-test was used to compare nonparametric data. Linear associa-tions between continuous parametric variables were assessed using the Pearson correlation test, while the Spearman correlation test was used to assess the correlation between non-parametric continuous and categorical vari-ables. A receiver operator characteristics curve (ROC curve) analysis was performed to identify the sensitivity and specificity of NLR, PLR cut of value in prediction of RFD.
Results
Demographics, clinical characteristics and laboratory findings in study groups
[image:3.612.96.521.84.294.2]Demographic and clinical characteristics of patient and control groups were summarized in Table 1. 65 ADPKD patients with preserved renal function without dialysis and 50 ADPKD
patients need conventional dialysis. Age, sex, body mass index, uric acid, total cholesterol, HDL cholesterol, and LDL cholesterol were similar between ADPKD patients and healthy subjects.
In patients with ADPKD, incidence of hyperten-sion, neutrophil counts, NLR and PLR were sig-nificantly higher, while white blood cell count, lymphocyte count and platelet count were sig-nificantly lower compared to that in healthy subjects (Table 1).
Evaluation of the relation between NLR, PLR and dialysis
ADPKD patients without dialysis had a mean NLR of 3.38 ± 2.03, which was significantly lower than the ADPKD patients with dialysis had a mean NLR of 5.22 ± 2.91, both of the NLR significantly higher than normal group (Figure 1A). As far as the PLR, ADPKD patients with dialysis had an obvious high level of PLR (203.8 ± 121 vs 152.2 ± 70.9, P < 0.001), and whether the ADPKD patients with dialysis or not, the level of PLR significantly higher than normal group (Figure 1B). Furthermore, accord-ing to the mean of NLR, the ADPKD patients were separated into two groups (group 1: NLR < 4.3, and group 2: NLR ≥ 4.3), there were no statistically significant difference between two Table 1. Demographics, clinical characteristics and laboratory findings in study groups
Parameter (n = 32)Control ADPKD without dialysis (n = 65) ADPKD with dialysis (n = 50) P value
Age (years) 47 (22-60) 49.5 (22-72) 51 (23-69) 0.84
Gender (M/F) 18/14 35/30 26/24 0.68
BMI (kg/m2) 24.2 ± 2.5 23.7 ± 2.3 22.5 ± 2.7 0.54
Hypertension (n) 0 28 27 P < 0.0001
Uric acid (mg/dL) 3.8 (2.9-4.5) 4.0 (3.0-4.8) 4.0 (2.8-4.5) 0.75
Total cholesterol (mg/dL) 203 (160-250) 207 (169-255) 208 (160-248) 0.35
LDL cholesterol (mg/dL) 122.0 (95-140) 118.0 (85-142) 115 (84-139) 0.62
HDL cholesterol (mg/dL) 44.5 (32-58) 44.0 (30-56) 42.7 (29-55) 0.37
WBC count (103/mm3) 5.94 ± 1.26 5.16 ± 1.73 5.08 ± 1.56 0.016
Neutrophil count (103/mm3) 2.97 ± 0.86 3.43 ± 1.37 3.71 ± 1.40 0.069
Lymphocyte count (103/mm3) 2.25 ± 0.60 1.22 ± 0.58 0.87 ± 0.30 P < 0.001
Platelet count (103/mm3) 198.3 ± 47.9 167.6 ± 78.1 155.2 ± 81.6 0.039
NLR 1.42 ± 0.58 3.38 ± 2.03 5.22 ± 2.91 P < 0.0001
PLR 92.7 ± 26.9 152.2 ± 70.9 203.8 ± 121 P < 0.0001
groups in terms of hypertension, uric acid, tri-glyceride, total cholesterol and Platelet count. However, ADPKD patients with NLR ≥ 4.3 had significantly higher WBC count, neutrophil count, PLR (130 ± 54.3 vs 256.1 ± 135.1, P < 0.0001), especially the incidence rate of dialy-sis (37.9% vs 59.2%, P = 0.024) when com-pared to patients with NLR < 4.3, while the lym-phocyte count was lower (Table 2). As well, the
[image:4.612.90.522.71.310.2]ADPKD patients were separated into PLR < 174 and PLR ≥ 174, except the same of characteris-tics, however, patients with PLR ≥ 174 had high-er neutrophil count, platelet count, NLR (3.15 ± 1.76 vs 5.71 ± 2.79, P < 0.0001), but the lym-phocyte count was lower compared with pati- ents with PLR < 174, and the incidence rate of dialysis had no significant difference (44.4% vs 51.1%, P = 0.49) (Table 2).
Figure 1. A. NLR, neutrophil-to-lymphocyte ratio; B. PLR, platelet-to-lymphocyte ratio between groups, ADPKD, auto-somal dominant polycystic kidney disease, *P < 0.05; **P < 0.001; ***P < 0.0001.
Table 2. Demographic, clinic and laboratory features of ADPKD patients according to NLR and PLR groups
Parameter All ADPKD (n = 115) NLR < 4.3 (n = 66) NLR ≥ 4.3 (n = 49) P value PLR < 174 (n = 65) PLR ≥ 174 (n = 50) P value
Age (years) 50 (22-72) 48.5 (22-72) 52 (25-67) 0.43 50.5 (22-72) 50 (25-64) 0.25
Gender (M/F) 64/51 36/30 28/21 0.78 32/33 26/24 0.77
BMI (kg/m2) 22.7 ± 3.5 23.8 ± 4.3 21.5 ± 2.0 0.57 22.3 ± 4.5 20.8 ± 3.9 0.32
Hypertension (n) 55 30 25 0.55 27 28 0.085
Uric acid (mg/dL) 4.0 (2.8-4.8) 3.9 (2.8-4.6) 4.1 (2.9-4.8) 0.39 3.8 (2.8-4.7) 4.1 (2.8-4.8) 0.26 Totalcholesterol (mg/dL) 207.3 (160-255) 207 (169-255) 208 (160-248) 0.35 209 (160-239) 310 (165-255) 0.15 LDL cholesterol (mg/dL) 123 (84-142) 118 (85-142) 115 (84-139) 0.62 120 (87-142) 114 (84-140) 0.33 WBC count (103/mm3) 5.3 ± 2.0 4.9 ± 1.57 6.0 ± 2.4 0.019 5.05 ± 1.59 5.42 ± 1.90 0.49
Neutrophil count (103/mm3) 3.6 ± 1.4 3.1 ± 1.1 4.7 ± 2.1 < 0.0001 3.31 ± 1.20 4.07 ± 1.70 0.04
Lymphocyte count (103/mm3) 1.1 ± 0.5 1.3 ± 0.49 0.68 ± 0.22 < 0.0001 1.23 ± 0.52 0.79 ± 0.33 < 0.0001
Platelet count (103/mm3) 160.3 ± 78.8 157.9 ± 76.6 164.2 ± 83.1 0.85 133.3 ± 58.1 201.3 ± 89 < 0.0001
PLR/NLR 179.2 ± 112.4 130 ± 54.3 256.1 ± 135.1 < 0.0001 3.15 ± 1.76 5.71 ± 2.79 < 0.0001
ADPKD with dialysis 43.5% 37.9% 59.2% 0.024 44.4% 51.1% 0.49
ADPKD, autosomal dominant polycystic kidney disease; BMI, body mass index; LDL, low-density lipoprotein; HDL, high-density lipoprotein; WBC, white blood cell; NLR, neutrophil-to-lymphocyteratio; PLR, platelet-to-lymphocyte ratio. Differences assessed by Chi-square test for categorical variables, and by Kruskal-Wallis test. Statistically
[image:4.612.94.520.390.562.2]Relationship between NLR, PLR and different RFD stages
In order to explore the relationship between NLR, PLR and different RFD stages, and elimi-nate the effects of dialysis on blood parame-ters blood, we only analyzed the stage 1, 2, 3, 4. Notably, we found NLR, PLR significantly increased across worsening CKD stages, the NLR and PLR of stage 2, 3, 4 significantly increased compared with control group and stage 1, and there was no significant difference between whether NLR or PLR of stage 1 and control group (P > 0.05) (Figure 2). Therefore, we candraw a conclusion that the level of NLR
and PLR were trend to increase when ADPKD patients developed RFD stage.
Correlation analysis
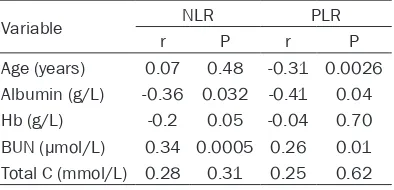
In the bivariate correlation analysis, NLR, PLR were positively correlated with blood urea nitro-gen (BUN) (r = 0.34, P = 0.0005, r = 0.26, P = 0.01, respectively), but were negatively with albumin (r = -0.36, P = 0.032, r = -0.41, P = 0.04, respectively) and the NLR was negatively with hemoglobin (r = -0.2, P = 0.05), however, PLR had no correlation with hemoglobin (r = -0.04, P = 0.7) (Table 3).
Receiver operator characteristics analysis
[image:5.612.92.523.73.237.2]A receiver operator characteristics curve analy-sis showed that the plot of the NLR and PLR levels yielded significant specificity and sensi-tivity for predicting the risk of RFD events in patients with ADPKD. When an ROC analysis was completed for the relationship between NLR and RFD events in patients with ADPKD, the results were AUC: 0.96, P < 0.0001; cut-off value 2.65, confidence interval 83.8%-99.1%. A cutoff value for NLR of 2.65 could predict development of RFD events with 74.7% sensi-tivity and 96.9% specificity (Figure 3A), and analyzed for the relationship between PLR and RFD events in patients with ADPKD, the results Figure 2. A. ***Control vs ADPKD-CS, Control vs ADPKD-DS, Control vs ADPKD-RFS, ***P < 0.0001, respectively. #ADPKD-normal vs ADPKD-CS, P < 0.05; ##ADPKD-normal vs ADPKD-DS, P < 0.01; ###ADPKD-normal vs ADPKD-RFS,
P < 0.0001. &ADPKD-DS vs ADPKD-RFS, P < 0.05. B. **Control vs ADPKD-normal, Control vs ADPKD-CS, Control vs
ADPKD-DS, **P < 0.01, respectively. ***Control vs ADPKD-RFS, P < 0.0001. #normal vs CS,
ADPKD-normal vs ADPKD-RFS, P < 0.05, respectively. &ADPKD-DS vs ADPKD-RFS, P < 0.05. ADPKD, autosomal dominant
polycystic kidney disease; NLR, neutrophil-to-lymphocyte ratio; PLR, platelet-to-lymphocyte ratio; ADPKD-CS, auto-somal dominant polycystic kidney disease-compensated stage; ADPKD-DS, autoauto-somal dominant polycystic kidney
disease- decompensated period; ADPKD-RFS, autosomal dominant polycystic kidney disease-renal failure stage.
Table 3. Bivariate correlation analysis of NLR and PLR to other parameters
Variable NLR PLR
r P r P
Age (years) 0.07 0.48 -0.31 0.0026
Albumin (g/L) -0.36 0.032 -0.41 0.04
Hb (g/L) -0.2 0.05 -0.04 0.70
BUN (μmol/L) 0.34 0.0005 0.26 0.01
Total C (mmol/L) 0.28 0.31 0.25 0.62
[image:5.612.92.289.375.470.2]were AUC: 0.82, P < 0.0001; cut-off value 130.2, confidence interval 78.6%-85.8%. A cut-off value for PLR of 130.2 could predict devel-opment of RFD events with 66.7% sensitivity and 96.9% specificity (Figure 3B).
Immunohistochemical analysis
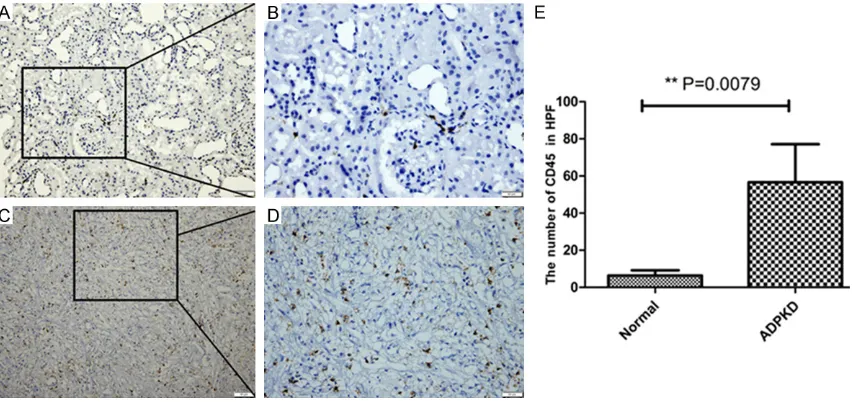
Furthermore, we analyzed the inflammato-rycharacteristic of ADPKD tissue by immuno-histochemical means. CD45 known as
leuko-cyte common antigen (LCA), which was one of inflammatory cell markers [17]. We found that the ADPKD patients with CD45 positive cells were obviously higher than the control group (6.4 ± 2.8 vs 56.6 ± 20.6, P = 0.0079) (Figure 4).
Discussion
[image:6.612.95.521.74.224.2]In the present study, we found that the level of neutrophil to lymphocyte ratio (NLR) and plate-let to lymphocyte ratio (PLR) in ADPKD patients Figure 3. A. Receiver operator curve (ROC) plot showing the sensitivity and specificity of NLR in ADPKD (AUC: 0.96, P < 0.0001; a best cut-off value of 2.65 for NLR gave 74.7% sensitivity and 96.9% specificity). B. ROC plot showing the sensitivity and specificity of PLR in ADPKD (AUC: 0.82, a best cut-off value of 130.2 for PLR gave 66.7% sensitiv
-ity and 96.9% specific-ity P < 0.0001). ADPKD, autosomal dominant polycystic kidney disease; NLR,
Neutrophil-to-lymphocyte ratio; PLR, platelet-to-Neutrophil-to-lymphocyte ratio.
Figure 4. Positive expression of CD45 in normal renal tissue and ADPKD tissue. Representative immunohistochem-istry images for the expression of CD45 are presented. A and B. Section is from the normal renal tissue. C and D.
Section comes from the ADPKD tissue. E. Quantitative analysis of the positive CD45 in high power filed, data are mean ± SD of 10 non-overlapping fields from 6 normal renal tissue and 6 ADPKD patients, Normal vs ADPKD, *P =
[image:6.612.94.520.309.510.2]were related to poor prognosis. The main find-ings of this study were: (1) NLR and PLR were significantly increased in the ADPKD patients with dialysis or not; (2) NLR and PLR significant-ly increased across worsening RFD stages 2-4; (3) NLR and PLR could predict the occurrence of RFD events, and showed a significant posi-tive correlation with blood urea nitrogen, while a significant negative with albumin; (4) the inflammatory cell marker CD45 significantly expressed on the ADPKD capsule wall tissue. Several studies found that the level of NLR or PLR was increased in patients with chronic kid-ney disease or end-stage renal disease (ESRD) [11, 18, 19]. However, whether the level of NLR was boosted in ADPKD patients, it was remain controversy at present. Turkmen et al. [12] reported that the ADPKD patients had higher levels of NLR than healthy group, but Gul et al. revealed that the NLR level had no signifi-cant differences compared with healthy volun-teers [20]. We found higher NLR levels in ADPKD patients than that in controls which were in conformity with the Turkmen study cor-responding data [19], and our also found that the PLR level also increased in ADPKD patients as compared with control. Especially, both NLR and PLR were steadily increased whatever the ADPKD patients without dialysis or with dialy-sis, and the ADPKD patients with dialysis had higher NLR and PLR than without dialysis patients, which agreement with the corre-sponding data in the literature [19].
The most important finding of this study was that NLR ≥ 4.3 was associated with a 1.5-fold increased risk of dialysis, and when PLR ≥ 174, the rate of dialysis increased significantly. Pre- vious studies had shown NLR and PLR utility in predicting unfavorable progression and prog-nosis [21]. Furthermore, previous studies had been suggested that higher levels of inflamma-tory markers were associated with faster pro-gression of chronic kidney disease (CKD) in patients [5, 22, 23]. Thereby, NLR may be con-sidered as a marker for evaluating the systemic inflammation [24].
This study indicated that white blood cell count, absolute neutrophil count and NLR, PLR were significantly higher, but absolute lymphocyte count and absolute platelet count were signifi-cantly lower in patients with ADPKD compared to healthy subjects. These data were in
accor-dance with previous reports suggesting incre- ased inflammatory markers in ADPKD [3, 12, 25]. It is known that lymphocytopenia is a com-mon finding in chronic inflammatory conditions and lymphocyte count reduction may be an early marker of physiologic stress and syste- mic inflammation response [26]. Moreover, we found the NLR, PLR level of ADPKD patients with RFD were significant higher than healthy objects and ADPKD patients with normal glo-merular filtration rate, and even ADPKD pati- ents with CKD stage 4 had higher NLR, PLR level than the CKD stage 3. Menon et al. [3] showed that ADPKD eGFR of 25 to 60 group had higher levels of C-reactive protein and IL-6 than controls, normotensive ADPKD with eGFR of > 60, and hypertensive ADPKD with eGFR of > 60. Inflammation was evident early in ADPKD even with preserved kidney function [3, 27]. The NLR and PLR have emerged as simple, inexpensive and useful markers of inflamma-tion related to vari ous renal diseases, inflam-matory and cardiovascular [11, 19, 28]. Pre- vious studies have demonstrated that an asso-ciation between the NLR and PLR and worsen-ing renal function in diabetic patients or hyper-tensive patients [21, 29, 30]. In the present study, we found that ADPKD patients with NLR val ues greater than 2.65 were found to be associated with renal function deficit with a higher sensitivity and specificity (74.7%, 96.9%, respectively), and ADPKD patients with PLR val-ues greater than 130.2 were more feasible to predict renal function deficit (66.7%, 96.9%, respectively).
to promote cyst cell proliferation, cyst growth, and fibrosis [34, 35]. Therefore, interruption macrophages and other inflammatory cells of homing and proliferative signals could alleviate the disadvantageous progression of the ADPKD.
The present study has several limitations. First, this study has a retrospective cross-sectional design with a single-center data. Due to the ret-rospective retrieval of the patient data, we could not execute the statistical significance concerning the correlation NLR, PLR and others inflammatory markers (i.e., erythrocyte sedi-mentation rate, IL-6 and C-reactive protein). Second, the cross-sectional design made it impossible to establish any causes and effect relationships. Third, using NLR, PLR in a single preoperative blood sample does not allow for assessing the stability of this variable over time. Finally, the cyst tissue from ADPKD patients is relatively small, which limits us to analyze the correlation between the inflamma-tory score and clinical parameters. Neverthe- less, despite these certain limitations, given the paucity of the solid information available on this area, our findings represent a valuable con-tribution to the literature.
In conclusion, this study demonstrated that NLR and PLR were significantly higher in ADPKD patients with renal insufficiency, and we found that NLR and PLR significantly increased across worsening CKD stages. Higher level of NLR, PLR was easier to develop hemodialysis. The positive inflammatory markers in cyst tissue from ADPKD patients significantly increased compare to healthy adults. Herein, as NLR, PLR are readily available in routine blood count analysis, they may be used as a cost-effective predictor association with ADPKD poor pro-gression. Our data suggested that lower NLR and PLR level in circulation, might be potential and novel preventive and therapeutic options for patients with ADPKD.
Disclosure of conflict of interest
None.
Address correspondence to: Dr. Yong-Man Lv, Department of Nephrology, Tongji Hospital, Tongji Medical College, Huazhong University of Science & Technology, Wuhan 430030, PR China. Tel:
0086-15827327879; Fax: 0086-27-83662853; E-mail:
lvyongman@126.com
References
[1] Heffernan KS, Kuvin JT, Sarnak MJ, Perrone RD, Miskulin DC, Rudym D, Chandra P, Karas RH and Menon V. Peripheral augmentation
in-dex and vascular inflammation in autosomal
dominant polycystic kidney disease. Nephrol Dial Transplant 2011; 26: 2515-2521.
[2] Ecder T and Schrier RW. Cardiovascular abnor-malities in autosomal-dominant polycystic kid-ney disease. Nat Rev Nephrol 2009; 5: 221-228.
[3] Menon V, Rudym D, Chandra P, Miskulin D,
Perrone R and Sarnak M. Inflammation, oxida -tive stress, and insulin resistance in polycystic kidney disease. Clin J Am Soc Nephrol 2011; 6: 7-13.
[4] Meuwese CL, Stenvinkel P, Dekker FW and Carrero JJ. Monitoring of inflammation in pa -tients on dialysis: forewarned is forearmed. Nat Rev Nephrol 2011; 7: 166-176.
[5] Tonelli M, Sacks F, Pfeffer M, Jhangri GS and Curhan G. Biomarkers of inflammation and
progression of chronic kidney disease. Kidney Int 2005; 68: 237-245.
[6] Sari I, Sunbul M, Mammadov C, Durmus E,
Bozbay M, Kivrak T and Gerin F. Relation of
neutrophil to lymphocyte and platelet to lym-phocyte ratio with coronary artery disease se-verity in patients undergoing coronary angiog-raphy. Kardiol Pol 2015; 73: 1310-6.
[7] Yu XY, Li XS, Li Y, Liu T and Wang RT. Neutrophil-lymphocyte ratio is associated with arterial stiffness in postmenopausal women with os-teoporosis. Arch Gerontol Geriatr 2015; 61: 76-80.
[8] Balta S, Celik T, Mikhailidis DP, Ozturk C,
Demirkol S, Aparci M and Iyisoy A. The Relation Between Atherosclerosis and the Neutrophil-Lymphocyte Ratio. Clin Appl Thromb Hemost 2016; 22: 405-11.
[9] Arruda-Olson AM, Reeder GS, Bell MR, Weston
SA and Roger VL. Neutrophilia predicts death and heart failure after myocardial infarction: a community-based study. Circ Cardiovasc Qual
Outcomes 2009; 2: 656-662.
[10] Tamhane UU, Aneja S, Montgomery D, Rogers EK, Eagle KA and Gurm HS. Association be-tween admission neutrophil to lymphocyte ra-tio and outcomes in patients with acute coro-nary syndrome. Am J Cardiol 2008; 102: 653-657.
[11] Ahbap E, Sakaci T, Kara E, Sahutoglu T, Koc Y,
Basturk T, Sevinc M, Akgol C, Kayalar AO, Ucar ZA, Bayraktar F and Unsal A.
Neutrophil-to-lymphocyte ratio and platelet-toNeutrophil-to-lymphocyte
ra-tio in evaluara-tion of inflammara-tion in end-stage
[12] Turkmen K, Tufan F, Selcuk E, Akpinar T, Oflaz
H and Ecder T. Neutrophil-to-lymphocyte ratio, insulin resistance, and endothelial dysfunction in patients with autosomal dominant polycystic kidney disease. Indian J Nephrol 2013; 23: 34-40.
[13] Akkaya E, Gul M and Ugur M. Platelet to lym-phocyte ratio: a simple and valuable prognos-tic marker for acute coronary syndrome. Int J Cardiol 2014; 177: 597-598.
[14] Ravine D, Gibson RN, Walker RG, Sheffield LJ,
Kincaid-Smith P and Danks DM. Evaluation of ultrasonographic diagnostic criteria for autoso-mal dominant polycystic kidney disease 1. Lancet 1994; 343: 824-827.
[15] Levey AS, Coresh J, Greene T, Stevens LA, Zhang YL, Hendriksen S, Kusek JW and Van
Lente F. Using standardized serum creatinine values in the modification of diet in renal dis -ease study equation for estimating glomerular
filtration rate. Ann Intern Med 2006; 145:
247-254.
[16] National Kidney Foundation. K/DOQI clinical
practice guidelines for chronic kidney disease:
evaluation, classification, and stratification.
Am J Kidney Dis 2002; 39: S1-266.
[17] Torkko KC, Wilson RS, Smith EE, Kusek JW, van Bokhoven A and Lucia MS. Prostate Biopsy
Markers of Inflammation are Associated with
Risk of Clinical Progression of Benign Prostatic
Hyperplasia: Findings from the MTOPS Study. J
Urol 2015; 194: 454-461.
[18] Solak Y, Yilmaz MI, Sonmez A, Saglam M, Cakir
E, Unal HU, Gok M, Caglar K, Oguz Y, Yenicesu
M, Karaman M, Ay SA, Gaipov A, Turk S, Vural A and Carrero JJ. Neutrophil to lymphocyte ratio independently predicts cardiovascular events in patients with chronic kidney disease. Clin Exp Nephrol 2013; 17: 532-540.
[19] Turkmen K, Erdur FM, Ozcicek F, Ozcicek A, Akbas EM, Ozbicer A, Demirtas L, Turk S and
Tonbul HZ. Platelet-to-lymphocyte ratio better
predicts inflammation than neutrophil-to-lym -phocyte ratio in end-stage renal disease pa-tients. Hemodial Int 2013; 17: 391-396. [20] Gul CB, Yildiz A, Ersoy A, Kahvecioglu S, Asiltas
B, Yildirim F, Ermurat S, Sag S, Oruc A, Gullulu
S and Gullulu M. Correlation between arterial
stiffness and inflammatory markers in autoso -mal dominant polycystic kidney disease pa-tients with preserved renal function. Int Urol Nephrol 2015; 47: 1187-1194.
[21] Akbas EM, Demirtas L, Ozcicek A, Timuroglu A, Bakirci EM, Hamur H, Ozcicek F and Turkmen
K. Association of epicardial adipose tissue, neutrophil-to-lymphocyte ratio and platelet-to-lymphocyte ratio with diabetic nephropathy. Int J Clin Exp Med 2014; 7: 1794-1801.
[22] Rees AJ. The role of infiltrating leukocytes in
progressive renal disease: implications for therapy. Nat Clin Pract Nephrol 2006; 2: 348-349.
[23] Turkmen K. Platelet-to-Lymphocyte Ratio: One
of the novel and valuable platelet indices in he-modialysis patients. Hemodial Int 2013; 17: 670.
[24] Bhat T, Teli S, Rijal J, Bhat H, Raza M, Khoueiry G, Meghani M, Akhtar M and Costantino T. Neutrophil to lymphocyte ratio and cardiovas-cular diseases: a review. Expert Rev Cardiovasc Ther 2013; 11: 55-59.
[25] Chen L, Zhou X, Fan LX, Yao Y, Swenson-Fields
KI, Gadjeva M, Wallace DP, Peters DJ, Yu A, Grantham JJ and Li X. Macrophage migration inhibitory factor promotes cyst growth in poly-cystic kidney disease. J Clin Invest 2015; 125: 2399-2412.
[26] Ommen SR, Gibbons RJ, Hodge DO and
Thomson SP. Usefulness of the lymphocyte concentration as a prognostic marker in coro-nary artery disease. Am J Cardiol 1997; 79: 812-814.
[27] Kocyigit I, Eroglu E, Orscelik O, Unal A, Gungor O, Ozturk F, Karakukcu C, Imamoglu H, Sipahioglu MH, Tokgoz B and Oymak O. Pentraxin 3 as a novel bio-marker of inflamma -tion and endothelial dysfunc-tion in autosomal dominant polycystic kidney disease. J Nephrol 2014; 27: 181-186.
[28] Ergelen M, Uyarel H, Altay S, Kul S, Ayhan E,
Isik T, Kemaloglu T, Gul M, Sonmez O, Erdogan
E and Turfan M. Predictive value of elevated neutrophil to lymphocyte ratio in patients un-dergoing primary angioplasty for ST-segment elevation myocardial infarction. Clin Appl Thromb Hemost 2014; 20: 427-432.
[29] Azab B, Daoud J, Naeem FB, Nasr R, Ross J,
Ghimire P, Siddiqui A, Azzi N, Rihana N, Abdallah M, Azzi N, Patel P, Kleiner M and El-Sayegh S. Neutrophil-to-lymphocyte ratio as a predictor of worsening renal function in
dia-betic patients (3-year follow-up study). Ren Fail
2012; 34: 571-576.
[30] Braga FL, Arruda IK, Diniz Ada S, Cabral PC,
Lemos Mda C, Braga MD and Chaves Hde C Jr.
Renal dysfunction and inflammatory markers
in hypertensive patients seen in a university hospital. Arq Bras Cardiol 2013; 100: 538-545.
[31] Karihaloo A, Koraishy F, Huen SC, Lee Y,
Merrick D, Caplan MJ, Somlo S and Cantley LG. Macrophages promote cyst growth in polycys-tic kidney disease. J Am Soc Nephrol 2011; 22: 1809-1814.
[32] Grantham JJ, Mulamalla S and Swenson-Fields
polycystic kidney disease. Nat Rev Nephrol 2011; 7: 556-566.
[33] Ibrahim S. Increased apoptosis and prolifera-tive capacity are early events in cyst formation in autosomal-dominant, polycystic kidney
dis-ease. ScientificWorldJournal 2007; 7:
1757-1767.
[34] Swenson-Fields KI, Vivian CJ, Salah SM, Peda
JD, Davis BM, van Rooijen N, Wallace DP and
Fields TA. Macrophages promote polycystic
kidney disease progression. Kidney Int 2013; 83: 855-864.
[35] Ta MH, Harris DC and Rangan GK. Role of
in-terstitial inflammation in the pathogenesis of