Major advances in the study of neural control (Arbas et al. 1995), isolated muscle function (Delcomyn, 1982; Josephson, 1993; Full, 1995) and biomechanics (Full, 1993) illustrate the advantages of investigating arthropod systems. However, integration of locomotor mechanics, neural control and muscle function remains elusive. This integration has been prevented largely because of the complexity of the musculo-skeletal system. The number of variables in even a simple multiple-muscle system is enormous. Muscular and skeletal parameters can depend on three-dimensional geometry, which further adds to the complexity of this system.
We contend that at least two complementary approaches are required to address the complexity of the musculo-skeletal system. Direct measurements of selected musculo-skeletal parameters are essential and irreplaceable. Equally as important, however, is the creation of a musculo-skeletal model. The model can serve several purposes. It can operate as a hypothesis generator for direct experimentation.
Moreover, it can guide direct experimentation by the use of sensitivity analyses to identify the parameters that are most likely to have the greatest effect on performance. Finally, the model can allow estimation of parameter values that are simply too difficult to measure directly.
By presenting a three-dimensional musculo-skeletal model of an insect leg, the present study represents a first step towards integrating information on the mechanics, neural control and musculo-skeletal function in arthropod terrestrial locomotion. We modeled the hind (metathoracic) leg of the death-head cockroach Blaberus discoidalis. We selected this species because more information exists on its biomechanics (Blickhan and Full, 1993; Ting et al. 1994; Full and Tu, 1990; Full et al. 1991; R. Kram, B. Wong and R. J. Full, in preparation) and energetics (Full and Tullis, 1990; Herreid II and Full, 1984) than on any other terrestrial arthropod. We modeled entire musculo-apodeme complexes (MACs; the apodeme is the arthropod equivalent of the tendon) rather than muscles alone
As a first step towards the integration of information on neural control, biomechanics and isolated muscle function, we constructed a three-dimensional musculo-skeletal model of the hind leg of the death-head cockroach Blaberus
discoidalis. We tested the model by measuring the
maximum force generated in vivo by the hind leg of the cockroach, the coxa–femur joint angle and the position of this leg during a behavior, wedging, that was likely to require maximum torque or moment production. The product of the maximum force of the leg and its moment arm yielded a measured coxa–femur joint moment for wedging behavior. The maximum musculo-apodeme moment predicted by summing all extensor muscle moments in the model was adequate to explain the magnitude of the coxa–femur joint moment produced in
vivo by the cockroach and occurred at the same joint angle
measured during wedging. Active isometric muscle forces predicted from our model varied by 3.5-fold among muscles and by as much as 70 % with joint angle. Sums of
active and passive forces varied by less than 3.5 % over the entire range of possible joint angles (0–125 ˚). Maximum musculo-apodeme moment arms varied nearly twofold among muscles. Moment arm lengths decreased to zero and switched to the opposite side of the center of rotation at joint angles within the normal range of motion. At large joint angles (>100 ˚), extensors acted as flexors. The effective mechanical advantage (musculo-apodeme moment arm/leg moment arm = 0.10) resulted in the six femoral extensor muscles of the model developing a summed force (1.4 N) equal to over 50 times the body weight. The model’s three major force-producing extensor muscles attained 95 % of their maximum force, moment arm and moment at the joint angle used by the animal during wedging.
Key words: locomotion, mechanics, force, arthropods, computer model.
Summary
STATIC FORCES AND MOMENTS GENERATED IN THE INSECT LEG:
COMPARISON OF A THREE-DIMENSIONAL MUSCULO-SKELETAL COMPUTER
MODEL WITH EXPERIMENTAL MEASUREMENTS
R. J. FULL ANDA. N. AHN
Department of Integrative Biology, University of California at Berkeley, Berkeley, CA 94720-3140, USA
Accepted 3 February 1995
because musculo-skeletal complex performance has been shown to be affected by series elasticity (Lieber et al. 1992; Zajac, 1989). Our model included direct measurements and estimates of muscle and apodeme parameters for six femoral extensor muscles, the three-dimensional positions of the origins and insertions of these muscles, joint type and range of joint motion (Fig. 1). These structural and functional components allowed us to predict isometric musculo-apodeme complex force (FMAC), the MAC moment arm (r) and the
MAC moment (MMAC) or turning force produced at a range of
joint angles where:
MMAC = FMACr . (1)
We tested our model by examining a near-static behavior, wedging, during which femoral extensor muscles develop isometric force to push the cockroach. We measured the force produced by the hind leg (FLeg), the leg moment arm (R) and
coxa–femur joint angle of an animal wedging through a slot.
We compared the maximum coxa–femur joint moment during wedging (MLeg) and the coxa–femur joint angle at maximum
moment to that predicted by our musculo-skeletal model at that angle (Fig. 2). Since total musculo-apodeme moment (MTMAC,
predicted) should equal the leg moment (MLeg, measured), we
hypothesize that:
FTMACr- = FLegR (2)
MTMAC= MLeg (3)
where FTMACis the total MAC force and r- is the mean MAC
moment arm.
[image:2.609.271.561.311.742.2]Subsequently, we used our model to test hypotheses concerning maximum moment production by MACs and the joint angles at which maximum moment is attained. There is evidence suggesting that musculo-tendon function (Haffajee et al. 1972), joint kinematics (Sale et al. 1982) or both (Lieber and Boakes, 1988) are the major determinants of joint moment. Some studies support the possibility of an optimal joint angle
where force production, moment arm and moment are maximized (Ismail and Ranatunga, 1978; Knapik et al. 1983), whereas others find that maximum force production is outside the range of normal motion (Lieber and Boakes, 1988; Sale et al. 1982; Andriacchi et al. 1984). Still other studies point to the utility of a broad distribution of moment as a function of joint angle, which can result when force production and moment arm are each maximized at different joint angles (Hoy et al. 1990).
Using our model for each of six extensor MACs operating the coxa–femur joint, we tested two hypotheses. First, for each MAC, we determined whether maximum MMAC, maximum
FMAC and maximum r occur at the same joint angle.
Alternatively, MACs could have broad moment distributions. Second, we determined whether the joint angle at the predicted, maximum MMACfor each MAC equals the actual joint angle
measured at maximum moment production in the animal during wedging. Alternatively, MACs could be constructed to generate maximum moments at various joint angles.
Materials and methods Animals
We used adult death-head cockroaches Blaberus discoidalis (Serville) of both sexes. Cockroaches were housed in plastic containers and given food and water ad libitum. Animals used for morphometric measurements were killed in a jar saturated with ethyl acetate vapor. All dissections and preparations were performed at room temperature (24 ˚C).
Wedging measurements Kinetics
[image:3.609.121.527.343.682.2]Vertical, horizontal and lateral components of the ground reaction forces were measured for cockroaches during wedging by using a miniature force plate (Full and Tu, 1990). We constructed a platform around the force plate, allowing the measurement of forces produced by the hind (metathoracic) leg only (Fig. 2). Animals wedged through a small hole into a darkened box. A sandpaper floor provided the animals with sufficient traction to prevent slippage. We analyzed trials
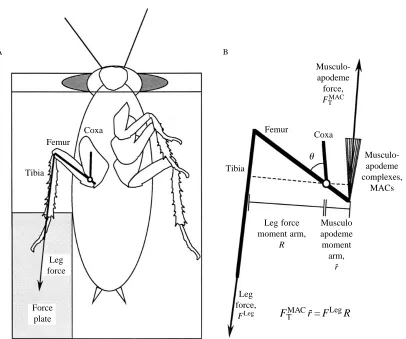
Fig. 2. Schematic diagram of leg function during wedging behavior. (A) Ventral view of cockroach on a platform with its metathoracic leg pushing on the force plate (light shaded area). The animal wedged through a slot (heavy shaded area). Leg force on the force plate is represented by a vector (arrow). The bold straight lines represent leg segments and the open circle shows the center of rotation. (B) Equilibrium conditions in the cockroach leg during wedging behavior. Musculo-apodeme complex moment MMAC(F
TMACr-) is assumed to equal the leg moment MLeg
(FLegR). The coxa–femur angle is represented by u.
FTMACr- = FLegR
Musculo-apodeme complexes,
MACs
Musculo apodeme moment
arm, r-Leg force
moment arm, R
Leg force,
FLeg
Leg force
Force plate
Musculo-apodeme force,
FTMAC
Tibia Tibia
Coxa
Femur Coxa
Femur
B A
during which the animal pushed for at least 500 ms and did not slip.
The force plate was constructed of model airplane plywood and mounted on four brass beams which had 24 semi-conductor strain gauges bonded to spring blades (Full and Tu, 1990). Force signals were sampled at a frequency of 1000 samples s21. Signals from the force platform were
amplified (Vishay, Measurements Group) and collected by an analog-to-digital converter (C-100, Cyborg) interfaced with a computer (IBM PC/AT). Data acquisition and analysis software (Discovery, Cyborg) were used to collect the signals, to filter the data digitally (185 Hz Butterworth filter with zero phase shift) and to make baseline corrections. Loads in the range 0.0001–0.5 N produced a linear response with a maximum variation across the platform of less than 7 %. Data were corrected for crosstalk between directions.
Kinematics
We videotaped cockroaches wedging through a small hole into a darkened box. To visualize the joint of interest (coxa–femur joint) clearly, we positioned the cameras below the Plexiglas surface. Sandpaper covered the surface in the area of leg contact to prevent slippage, but did not obstruct the camera views of the coxa–femur joint. The coxa and femur segments and the coxa–femur joint were marked with white epoxy paint (Duro Appliance) for digitizing. Two views of the animal were videotaped simultaneously at 1000 frames s21
using high-speed video cameras (Kodak Ektrapro 1000) placed at 90 ˚ relative to one another. Direct linear transformation of the data captured in the two views provided the three-dimensional coordinates for the coxa–femur angle of the metathoracic leg (Biewener and Full, 1992; 3D version, Peak Performance Technologies, Inc.).
Musculo-skeletal reconstruction
The computer model of the insect leg was implemented within a computer program (called SIMM, Software for Interactive Musculoskeletal Modeling; MusculoGraphics, Inc.; Delp et al. 1990; Delp and Loan, 1995). Within the program, a computer model of jointed framework musculo-skeletal structures can be defined by describing the skeletal geometry, joint motions, muscle lines of action and muscle force-generating parameters. The mean body mass of animals used for reconstruction was 2.70±0.56 g (S.D.; N=13).
Exoskeleton
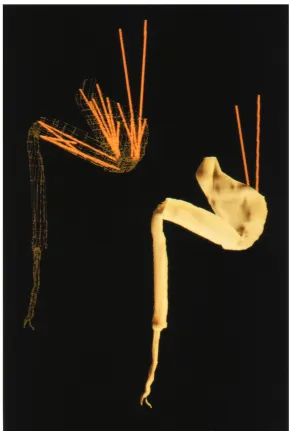
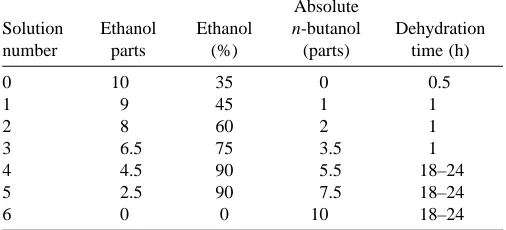
Histology. Serial reconstruction of sections of the leg segment provided a quantitative description of the exoskeleton. Hind legs were dissected from the body. Leg segments (coxa, trochanter and femur, tibia, tarsus) were separated by cutting the two points of articulation which connect the segments. Subsequently, segments were fixed individually in Bouin’s fluid (Humason, 1979) for 18–24 h. Injection of fixative into each segment ensured complete infiltration and removal of residual air bubbles. Dehydration of the segments was carried out using the n-butanol dehydration sequence shown in Table 1
(R. L. Pipa, personal communication). Each segment was placed in the appropriate alcohol mixture and injected with the solution to ensure complete dehydration.
We embedded segments in paraffin with reference hairs on either side that ran the entire length of the segments. Trimmed tissue blocks were sliced into 80mm sections using a sledge microtome (AO Spencer Sliding Microtome).
Computer imaging. We videotaped the leg segment sections using a video-microscope [Javelin CCTV (chromochip II) video camera; Wild Heerbrugg M7 5 microscope] with a background grid, which served as a calibration scale during image analysis. Image-grabbing hardware (Image Grabber, Neotech Ltd) was used to capture the video images of the sections. The two-dimensional (x,y) coordinates of each section were determined using an image analysis program (Image 1.14u, NIH). Reference hairs that ran parallel to the length of the leg allowed alignment of the sections in the x,y plane. z-axis coordinates were determined by the thickness of the sections (80mm) and number of sections. Each (x,y,z) coordinate generated a vertex.
We constructed polygons representing the exoskeletal surface by connecting the vertices between consecutive sections (Fig. 1). Not all the sections were incorporated into the model. We used a larger number of sections in areas of muscle attachment than for straighter regions that lacked muscular attachment.
Joint definition
[image:4.609.309.562.92.207.2]Each segment was contained within its own reference frame. The segments were assumed to be articulated by frictionless joints with single degrees of freedom. Cockroach leg segments are mostly connected by simple hinge or pin joints, each with a single axis of rotation. The coxa–trochanter and femur–tibia joints each articulate at only two hinge points. The trochanter–femur joint is also a simple hinge joint (Dresden and Nijenhuis, 1953), but was not included in the model. We assumed that the trochanter–femur joint was unimportant because there was no measurable change in this joint angle. We combined the trochanter and femur segments into a single rigid segment referred to as the ‘femur’. Although the tibia–tarsus joint is complex, having more degrees of freedom, this joint has a very small range of motion. The present study focuses on extension of the femur at the coxa–femur joint and Table 1. Dehydration sequence for exoskeletal reconstruction
Absolute
Solution Ethanol Ethanol n-butanol Dehydration
number parts (%) (parts) time (h)
0 10 35 0 0.5
1 9 45 1 1
2 8 60 2 1
3 6.5 75 3.5 1
4 4.5 90 5.5 18–24
5 2.5 90 7.5 18–24
examines only those joint angles within the normal range of motion in the animal.
Muscle line of action
We obtained the three-dimensional coordinates of the muscle attachment points by video microscopy of muscle dissections. Animals were fixed and dehydrated with Kahle’s fluid (Borror and DeLong, 1971) for 4–7 days, after which the metathoracic legs were removed. The origin and insertion points of each MAC were identified on the exoskeleton during dissections. Preparations were moistened with 70 % ethanol, as required, to prevent desiccation of the muscles. Muscle attachment points were videotaped at three known viewing angles (20 ˚, 0 ˚, 220 ˚) using a rotating micromanipulator. Although a 90 ˚ angle between the video cameras is optimal, all necessary reference and attachment points were not simultaneously visible at larger angles because of the shape of the segments. Direct linear transformation of the data captured in the three views provided the three-dimensional coordinates of the muscle attachment points (Biewener and Full, 1992). An acrylic box (6.78 mm36.78 mm37.08 mm) served to calibrate the image analysis system (Peak Performance Technologies, Inc.).
Using three predetermined reference points and several anatomical landmarks on the exoskeleton, we rotated and translated the muscle coordinates to match the exoskeletal coordinates. For the current model, we identified 21 musculo-apodeme actuators (notation of Carbonell, 1947). In the present study, we focus on the six femoral extensors relevant to force production during wedging (Fig. 3; Table 2). Although the number of discrete muscles in a cockroach leg is controversial (Alsop, 1978; Becht, 1959; Stokes et al. 1975), we believe our choice represents the major functional groups. In the future, however, actuators may be further differentiated in the model according to other distinguishing features, such as muscle fiber type.
Moment arm length
Total musculo-apodeme length (lMA) was determined by
summing the length vectors from the origin to the insertion
(Delp et al. 1990; Hoy et al. 1990). Musculo-apodeme complexes in the present study required only a single vector because their paths followed only one direction. However, this
177a
177e 177c
178
179 177d
Coxal segment
[image:5.609.332.560.125.443.2]Femoral extensor muscles
Fig. 3. Three-dimensional musculo-skeletal model of the coxal segment of the metathoracic leg of Blaberus discoidalis. Ventral view with left side rotated into the paper relative to Fig. 1. Thin grey interconnecting lines make up the polygons which represent the coxal segment. Heavy black lines represent the lines of action of the muscles. Muscles are numbered following Carbonell (1947). The computer model was created using SIMM (MusculoGraphics Inc., Evanston, IL, USA).
Table 2. Femoral extensor musculo-apodeme parameters used in cockroach metathoracic leg model
Maximum Optimal fiber Apodeme Pennation Normalized loMto lSAto
isometric length, slack length, angle, apodeme moment arm moment arm
Extensor force, FoM loM lSA a slack length, length ratio, length ratio,
muscle (N) (mm) (mm) (degrees) lSA/loM loM/r lSA/r
177a 0.28 8.3 4.4 0.0 0.53 10.4 5.5
177c 0.46 10.3 4.4 0.0 0.42 13.6 5.8
177d 0.14 3.2 0.6 16.0 0.19 3.5 0.65
177e 0.14 4.3 0.3 13.0 0.07 5.3 0.37
178 0.25 2.5 1.3 0.0 0.50 3.3 1.6
179 0.14 3.3 0.7 0.0 0.20 6.1 1.2
Muscles are numbered following Carbonell (1947).
Optimal muscle fiber length is the fiber length at maximum isometric force production.
[image:5.609.50.567.569.691.2]approach will become important in our future studies of other MACs whose paths are constrained. Musculo-apodeme moment arm length (r) was calculated by the ‘partial velocity’ method, which yields the same results for hinge joints as the cross-product between the vector connecting the joint center to the origin and the unit vector connecting the origin to the insertion (Delp and Loan, 1995).
Musculo-skeletal model
Numerous models of whole muscle function exist (Hatze, 1973; Zajac, 1989; Lieber et al. 1992; van Leeuwen, 1992). We used a Hill-type model of muscle function which incorporated apodeme properties (Zajac, 1989). Each musculo-apodeme actuator was represented by (1) an active contractile element, (2) an elastic element parallel to the contractile element and (3) a passive elastic element in series with the contractile and parallel elastic elements (Delp and Loan, 1995). The force–length properties of each musculo-apodeme actuator were determined by scaling a dimensionless model. All forces were normalized to maximum isometric force (FoM). All
lengths were normalized to optimal muscle fiber length (loM)
where loM is the muscle length at which maximum active,
isometric force is produced. Normalized isometric muscle force (F˜M) equalled muscle force (FM) divided by maximum
isometric force (FoM). Normalized muscle fiber length (l˜M)
equalled muscle fiber length (lM) divided by optimal muscle
fiber length (loM). The parallel elastic element was set to
develop force at loM and to increase exponentially to a value of
F˜M=2 at 1.6l
oM(Hoy et al. 1990).
Apodemes were represented by elastic elements that operated in the linear region of their stress–strain curve. Apodeme cross-sectional area was assumed to be proportional to muscle cross-sectional area and FoM for each actuator (Zajac,
1989, p. 376). Normalized apodeme force (F˜A) equalled
apodeme force divided by FoM. Normalized apodeme length
(l˜A) equalled apodeme length (lA) divided by l o M.
Normalized apodeme force (F˜A) is a function of l˜Mand F˜M
of muscle fibers adjusted for pennation angle (a), where ais the angle between the line of action of the muscle and the direction of the muscle fibers. F˜A is also a function of
normalized apodeme stiffness (k˜A) and l˜A. Because l˜A is a
function of l˜M (l˜A= l˜MA2l˜Mcosa), F˜A could be calculated
iteratively at each value of l˜A by finding a value of l˜M that
satisfies the relationship between F˜A and muscle length and
force, as well as the relationship to its own stiffness and length (see equations 5 and 6 in Hoy et al. 1990).
Results from the model were obtained using an interactive computer program (SIMM) on a computer workstation (Silicon Graphics, Personal Iris, 4D25 Super Turbo).
Musculo-skeletal parameters Muscles
Maximum isometric force (FoM) for each femoral extensor
was estimated by multiplying the maximum isometric stress value of 15 N cm22 measured directly from experiments on
muscle 179 (tetanizing stimulation at 100–200 Hz and two times threshold for the motor axon for 300 ms, R. K. Josephson and D. R. Stokes, unpublished) by our estimates of the physiological cross-sectional area (PCSA) of a muscle (Biewener and Full, 1992). The PCSA for each femoral extensor muscle was determined from the muscle mass, length and density (assuming density of muscle to be 1.056 g cm23;
Mendez and Keys, 1960). To determine muscle mass, the muscles were dissected and weighed on a microbalance. The muscle tissue was moistened with iso-osmotic insect Ringer’s solution, when necessary, and blotted dry just prior to weighing. We measured the joint angle at resting tension in live animals to determine the optimal muscle fiber length (loM)
of each muscle. The fiber length at this resting joint angle was used as the muscle fiber reference length (lref). The optimal
muscle fiber length was assumed to be 97 % of lrefon the basis
of measurements from the bifunctional muscle of the locust (metathoracic second tergocoxal muscle; Malamud, 1989). Reference fiber lengths were measured with an electronic digital caliper from the origin on the exoskeleton to the insertion on the apodeme. We used a normalized force–length curve which gave 50 % FoM at 0.6loMand 1.3loM (Gordon et al.
1966; Malamud, 1989). Pennation angle (a) of the muscle fibers was measured with an ocular goniometer mounted on a microscope. Total force of the actuator was the sum of the active force of a muscle and the passive force of the MAC. Muscles were assumed to be fully activated at each joint angle for comparison with maximum isometric contractions used during wedging.
Apodeme
We estimated apodeme slack length (the apodeme length beyond which the apodeme just beings to develop force; lSA)
by measuring the length of the apodeme to which the muscles attached. We used a value of 13 GPa for the apodeme’s elastic modulus (EAfrom grasshoppers; Ker, 1977) and 8.6 MPa for
its stress (soA; determined from our estimates of maximum
isometric force and apodeme PCSA). These values gave us the following apodeme stiffness (k˜A) normalized to l
o M and F
oM (see
Zajac, 1989, p. 377, Fig. 9 for derivation): k˜A = (EA/s
oA)(1/l˜SA) , (4)
k˜A = (13 GPa/8.6 MPa)(1/l˜
SA) , (5)
k˜A= 1500/l˜
SA, (6)
where l˜SA represents the normalized apodeme slack length
(l˜SA=lSA/loM). The value of EA was 10 times that of vertebrate
tendon values, whereas soAwas one-quarter of the tendon value
(see Hoy et al. 1990). The resulting k˜A was 40-fold stiffer than
tendon. We suspect that the value of EAmay be too high for
the cockroach, since the resulting safety factor is so large. However, to our knowledge, the only value available for EAis
from a specialized jumper, the grasshopper. Fortunately, even when we reduced k˜A by half (6.5 GPa; 20-fold stiffer than
Results
Hind leg function during wedging Force production
While attempting to escape, cockroaches (mean body mass 3.15±0.75 g, S.D.; N=5) pushed, or wedged, through a small slot
by the alternate thrusting of the hind (metathoracic) legs. Ground reaction forces generated in the horizontal direction (i.e. along the long body axis of the animal) were greatest in magnitude (Fig. 4). The combination of horizontal and vertical forces directed the resultant force vector along the long axis of the leg when viewed in a lateral projection. Lateral forces were variable, but tended to direct the ground reaction force vector along the tibia through the femur–tibia joint and towards the body axis [8±3 ˚(S.E.M.) relative to the body axis; Fig. 2]. A
plateau in the resultant ground reaction force pattern was
observed that lasted 100 ms or longer and varied by less than ±10 % of the mean value (Fig. 4). The resultant steady-state ground reaction force equal to the magnitude of FLeg was
0.10±0.013 N (S.E.M.; N=5 animals; Table 3). Peak resultant
ground reaction forces produced for less than 100 ms were 1.2 times that of steady-state values (Table 3).
Moment arm and moment
The leg or ground reaction force moment arm of the coxa–femur joint (R) was approximately 8 mm (Table 3). The product of the leg moment arm (R) and the leg force (FLeg)
yielded the maximum coxa–femur joint moment (MLeg). The
maximum coxa–femur joint moment (MLeg) ranged from 0.80
[image:7.609.194.564.276.537.2]to 0.96 N mm for steady-state and peak forces, respectively (Table 3).
−0.05 0 0.05 0.1 0.15 0.2
Force (N)
0 200 300 400 500 600 700
Time (ms)
Resultant Lateral Horizontal Vertical Steady-state
resultant force
Peak force
Table 3. Comparison of coxa–femur joint properties at maximum moment derived from the femoral extensor musculo-apodeme model with direct measurements from leg ground reaction forces during wedging
Effective Coxa–femur
Force moment arm Moment angle
Source (N) (mm) (N mm) (degrees)
Animal in vivo leg FLeg R MLeg
measurements
Steady-state force 0.10±0.013 8.0±1.82 0.80 45±4.9
(N=5) (N=5) (N=6)
Peak force 0.12±0.019 8.0±1.82 0.96 45±4.9
(N=5) (N=5) (N=6)
Model FTMAC r- MTMAC
Musculo-apodeme 1.4 0.86 1.20 43–47
[image:7.609.50.569.579.736.2]Values are means ± 1 S.E.M.
Fig. 4. Ground reaction forces of the metathoracic leg during wedging. Forces for three components are shown along with their resultant over time. The steady-state resultant force is shown in the shaded column. The calculation of maximum leg moment (MLeg) incorporated the leg force
(FLeg) which equals the magnitude of
Joint angle
The coxa–femur joint angle of the metathoracic leg during wedging was 45±4.9 ˚ (S.E.M.; N=6; Table 3).
Musculo-apodeme model Musculo-apodeme complex parameters
Maximum isometric force (FoM) estimates for the six
extensor muscles ranged from 0.14 to 0.46 N (3.5-fold variation; mean 0.24±0.13 N, S.D.; Table 2). Optimal muscle fiber lengths (loM) for the six extensors varied by fourfold (mean
5.3±3.2 mm, S.D.). By far the longest fibers were those of the
bifunctional muscles 177a and 177c. Apodeme slack length (lSA) varied 15-fold (mean 1.95±1.93 mm, S.D.) among
extensors. Only muscles 177d and 177e had significant pennation angles (Table 2).
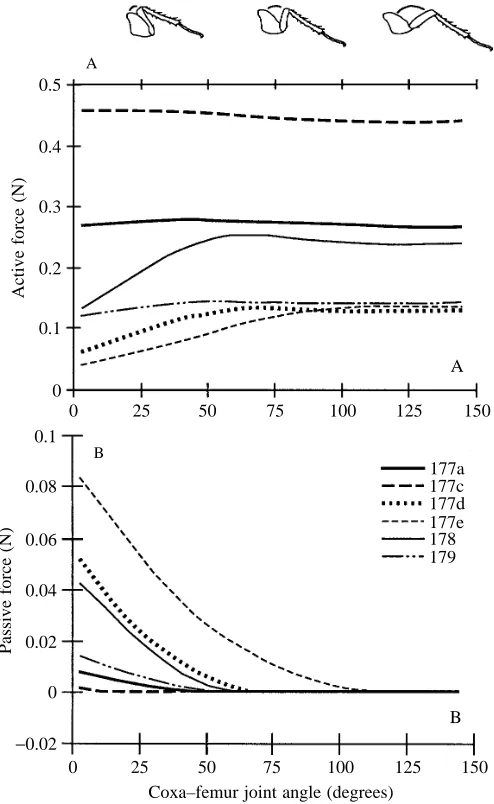
Active muscle force
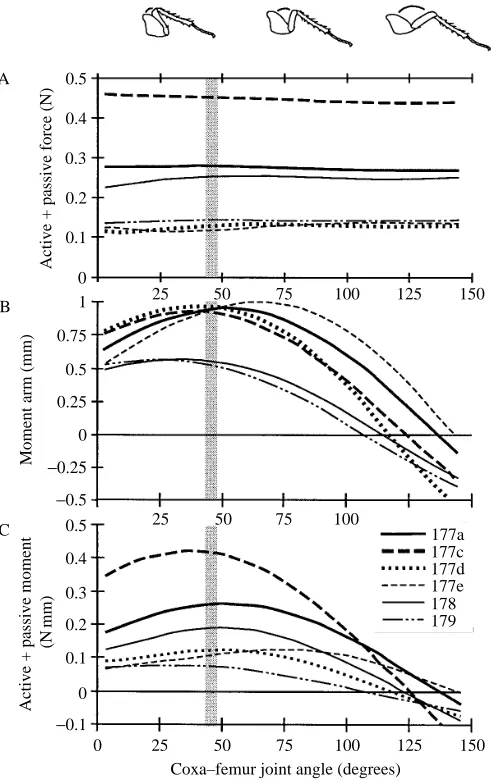
Active isometric muscle force varied significantly among muscles (Fig. 5A). Maximum isometric force was attained for all muscles at coxa–femur joint angles greater than 75 ˚. At joint angles less than 75 ˚, active force declined from 16 to 70 % for four of the six muscles. The two longest muscles (177a, 177c) showed no reduction in force as the joint angle decreased.
Passive muscle force
Musculo-apodeme complex passive force varied among muscles and as a function of joint angle (Fig. 5B). Passive force increased for all muscles at joint angles less than 50 ˚. Passive force was small for muscles 177a, 177c and 179. Muscle 177e made the largest passive contribution; two-thirds of its total force was passive at a 3 ˚ joint angle. Passive force of muscles 178 and 177d supplied 15 and 20 % of their total force at a joint angle of 25 ˚, respectively. At small joint angles (<50 ˚), passive force contributed approximately 3–18 % of the total MAC force from all muscles.
Musculo-apodeme complex isometric force
Musculo-apodeme complex isometric force (FMAC) varied
significantly among MACs (Fig. 6A). When active and passive forces are summed, near-maximal isometric force was attained for all MACs over most of the range of coxa–femur joint angles investigated (see Table 2; Fig. 6A). The maximum decrease in active plus passive force (FMAC) ranged from 4 to 15.5 % for
individual muscles and was only 3.5 % for the summed force of all MACs.
Musculo-apodeme complex moment arm
Maximum MAC moment arm varied among MACs (0.57–1.00 mm; mean 0.86±0.17 mm, S.D., N=6), but to a far
lesser extent than force production (Fig. 6B). Most of the variation in moment arm was explained by joint angle. The mean joint angle at which MACs attained maximum moment arm was 44±13.5 ˚ (S.D.). Moment arm decreased by 7–46 % at
the smallest joint angle (3 ˚). Large joint angles, associated
with extension of the femur, produced substantial decreases in moment arm for all MACs. At joint angles greater than 100 ˚, moment arm decreased to below zero and changed to the opposite side of the center of rotation.
Musculo-apodeme complex moment
Musculo-apodeme complex moment varied substantially among muscles and as a function of joint angle (Fig. 6C). The mean joint angle at which muscles attained maximum moment was 48.5±15.1 ˚ (S.D.). For individual muscles, moment
decreased by 15–50 % at the smallest joint angle (3 ˚) and by 18 to over 80 % at 100 ˚. At angles greater than 100 ˚, moment was negative, producing flexion rather than extension.
The maximum summed moment from all muscles collectively (MTMAC) was 1.2 N mm at a joint angle of 45 ˚
(Table 3; Fig. 7).
0.5
0.4
0.3
0.2
0.1
0
0.1
0.08
0.06
0.02
0
−0.02
Active force (N)
Passive force (N)
0 25 50 75 100 125 150
0 25 50 75 100 125 150
Coxa–femur joint angle (degrees)
B A
0.04
[image:8.609.312.559.72.474.2]177a 177c 177d 177e 178 179
Fig. 5. Extensor musculo-apodeme isometric force production as a function of joint angle. (A) Active isometric force production varied among muscles and with joint angle. Muscles are numbered according to Carbonell (1947) and are assumed to be fully activated. (B) Passive force varied among MACs and with joint angle. Note that passive forces are much smaller than active forces.
Discussion Wedging
The resultant ground reaction force of the cockroach hind (metathoracic) leg during wedging was nearly 10-fold greater than that measured for the same leg during rapid running (0.013 N; Full et al. 1991). We suspect that this represents maximum force and moment production because these forces are comparable to those that B. discoidalis generates during an emergency behavior, righting, where it must turn over after being flipped onto its dorsal surface (Full et al. 1995).
The ground reaction force of the cockroach leg during wedging was more than fourfold greater than body weight
(0.0319±0.0088 N, S.D., N=5). Alexander (1985) found that force production ranged from 3.7 to 147 times body weight for animals with the mass of cockroaches. He noted that insects fell at the lower end of this distribution and hypothesized a disadvantage for force generation as a result of small muscle moment arms constrained by a narrow, tubular exoskeleton. In the present study, we found that the extensor MACs must generate about ten times as much force (FTMAC) as the animal
achieves at the distal end of the leg (FLeg; Fig. 2). This
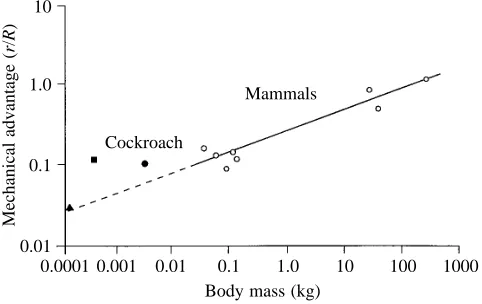
difference resulted from the leg force moment arm (R) being ten times as long as the musculo-apodeme moment arm (r-; Table 3). MAC moment arms are short in insects, but are also quite short in small mammals compared with large mammals. The moment arm ratio, or mechanical advantage (r/R), of a mouse is only about one-tenth that of a horse (Biewener, 1989). Extrapolation of the scaling of mammalian mechanical advantage (Biewener, 1989) to an animal the size of a cockroach gives a predicted mechanical advantage of 0.05 (Fig. 8). At least for the death-head cockroach B. discoidalis, the moment arm ratio of 0.1, albeit small, is actually larger than predicted for an animal of its mass. Mechanical advantage calculated for slow, strong dung beetles ranges from 0.06 to 0.13 (Evans and Forsythe, 1984). Fast-running tiger beetles have lower ratios of approximately 0.03. Overall, insect exoskeletons may not necessarily constrain the musculo-apodeme moment arm length.
Death-head cockroaches do not appear to be exceptionally strong pushers or wedgers, at least compared with other insects, such as beetles (Forsythe, 1983). B. discoidalis can be characterized as a moderately strong force producer (force ratio = 2.4–4.8, where force ratio is maximum force/mass0.33) and a
relatively fast runner (velocity ratio = 2, where velocity ratio is maximum velocity/mass0.33; Evans and Forsythe, 1984; Full
and Tu, 1990; Forsythe, 1991; Evans, 1977). This cockroach species may fall into the force/speed specialist category used 0.5
0.4
0.3
0.2
0.1
0
0.5
0.4
0.3
0.1
0
−0.1
Active + passive force (N)
Moment arm (mm)
Active + passive moment
(N
mm)
0 25 50 75 100 125 150
25 50 75 100 125 150
25 50 75 100
Coxa–femur joint angle (degrees) B
C A
0.2 1
0.75
0.5
0
−0.25 −0.5 0.25
177a 177c 177d 177e 178 179
Fig. 6. Total force, moment arm and total moment of femoral extensors as a function of joint angle. (A) Isometric musculo-apodeme force production. The sum of the active and passive forces shown in Fig. 5 resulted in little variation in force as a function of joint angle. (B) Musculo-apodeme moment arm. A negative moment arm (r) represents a shift of r to the opposite side of the center of joint rotation. (C) Musculo-apodeme moment. Muscles are numbered according to Carbonell (1947). The shaded column represents the ranges of joint angles actually used by the animal during wedging. A negative r represents a flexor-like moment and function.
0 25 50 75 100 125 150
Coxa–femur joint angle (degrees)
Moment (N mm)
−0.5 0 0.5 1.0 1.5
[image:9.609.320.562.49.241.2]0 25 50 75 100 125 150
Fig. 7. Total moment (FTMAC) predicted by the model for six extensor
[image:9.609.51.297.71.462.2]to categorize beetles rather than being more specialized for either force- or velocity-dependent activities alone (Evans and Forsythe, 1984).
Musculo-apodeme complex force production
The magnitude of active isometric muscle force predicted from our model varied significantly among muscles due to variation in physiological cross-sectional area (Fig. 5A). We used a muscle stress of 15 N cm22 measured directly from
muscle 179 (R. K. Josephson and D. R. Stokes, unpublished). This value is within the range of maximum isometric stresses reported for other invertebrate species (2–140 N cm22; Full,
1995; Ruegg, 1968; Alexander, 1985), amphibians and lizards (7.1–39.6 N cm22; Josephson, 1993) and mammals
(13.2–29.4 N cm22; Josephson, 1993; Powell et al. 1984; Close,
1972). Nonetheless, our muscle stress value for the larger, slower, death-head cockroach is approximately twice that found in the smaller, faster American cockroach Periplaneta americana (6.8–8.3 N cm22for four of six muscles; Smit et al.
1967; Jahromi and Atwood, 1969). Stress may even vary among extensor muscles, since sarcomere length has been shown to vary by twofold in the American cockroach (Stokes, 1987; Fourtner, 1978) and longer sarcomeres with longer myosin filaments will be capable of generating greater stress. Moreover, measurement of maximum isometric force using neural activation could be complicated by facilitation and defacilitation of synaptic effects as well as by circulating hormones. Active isometric force measurements obviously deserve more attention in the future.
Active isometric force varied as a function of joint angle in our model (Fig. 5A). Over most joint angles, the two longest muscles (177a, 177c) operated over the plateau of their force–length curve. These bifunctional muscles, which participate in running and flying, showed only a small decrease
in active force production at angles greater than 30–60 ˚ because they began to function on the ascending region of the force–length curve. By contrast, the other muscles (177d, 177e, 178, 179) operated on the plateau of the force–length curve at joint angles greater than 75 ˚. Active force decreased considerably at small joint angles (<75 ˚), because these extensor muscles functioned on the descending portion of the force–length curve as they became stretched. The ratio of loM/r
can be an excellent predictor of the range of joint angles over which muscles will develop active force (Hoy et al. 1990; Delp et al. 1990; Zajac, 1989). Large loM/r ratios, such as in muscles
177a and 177c, resulted in the actuators developing active force over a greater range of joint angles compared with those with smaller ratios, such as muscle 178 (Table 2; Fig. 5A). Muscle length was not matched to its potential excursion determined by r (Lieber and Brown, 1992). Muscle fiber strain over the whole range of joint angles varied among muscles from 0.14 (177c, loM/r=13.6) to 0.48 (178, loM/r=3.3).
Passive force contributed 3–18 % of the total force at joint angles less than 50 ˚ (Fig. 5B). At small coxa–femur joint angles, muscles operated on the descending region of the force–length curve. In this region, passive forces increased and offset the decline in active force. For cockroach femoral extensors, the sum of active and passive force resulted in a total musculo-apodeme force that varied by less than 3.5 % over the entire range of possible joint angles (Fig. 6A). Although the maximum FMACwas not produced at the joint angle used by
the animal during wedging for any single MAC, the range of angles over which 95 % of the maximum force was generated did include the angle measured in vivo for five of a possible six muscles, including the three muscles producing the greatest force (177a, 177c and 178; Fig. 9).
Estimates of passive force contribution were based on a number of assumptions. First, we estimated that the Young’s modulus (EA) of a cockroach apodeme was comparable to that
measured in the locust, and that the complex was functioning over the linear portion of the apodeme stress–strain curve. Lieber et al. (1991) found that frog semitendinosus muscle can operate in the ‘toe’ region of the stress–strain curve where stiffness increases with load. Moreover, the elastic modulus of the frog tendon was one-tenth of that of most mammalian tendons, reinforcing our concern regarding variability in apodeme/tendon properties. To limit the number of variables in the model, we assumed that apodeme cross-sectional area was proportional to muscle PCSA or to FoM(Hoy et al. 1990). Our
[image:10.609.47.288.74.226.2]preliminary estimates supported this assumption, although cases where muscles attach to the same apodeme need to be examined more extensively. Second, we assumed that the passive, parallel elastic element had a normalized force–length relationship similar to that found in locust flight muscle and frog muscle (Malamud, 1989). With this assumption, we may have overestimated our small passive force contribution, because we did not consider heterogeneous fiber lengths that would produce smaller changes in normalized force with a relative length change. We also did not include an adjustment for the transient changes in the tension of stretched or shortened muscle (i.e.
Fig. 8. Effective mechanical advantage as a function of body mass. Effective mechanical advantage is the ratio of the moment arm length of the muscle (r) to the leg or ground reaction force moment arm length (R). Blaberus discoidalis is represented by the filled circle. The filled square represents the strong dung beetle Geotrupes stercorarius, whereas the filled triangle is for the fast tiger beetle Cicindela campestris (Evans and Forsythe, 1984). Mammalian data are taken from Biewener (1989).
10
1.0
0.1
0.01
Mechanical advantage (
r/
R
)
0.0001 0.001 0.01 0.1 1.0 10 100 1000 Cockroach
Mammals
stress relaxation) that have been demonstrated in locust flight muscle (Malamud, 1989) as well as in vertebrate muscle (Buchthal et al. 1944). At present we cannot evaluate the relevance of stress relaxation, other than to say that it has a long time constant and that the largest absolute changes in force occur after relatively large changes in length (e.g. 29 %; Malamud, 1989). Finally, for simplicity, the model did not include a muscle elastic or damping component in series with the contractile element, since its inclusion can decouple the relationship between sarcomere length and fiber length (Zajac, 1989). To test the significance of these assumptions, we have begun sensitivity analyses of the effects of changing optimal muscle fiber length, apodeme slack length, Young’s modulus and the parallel elastic component on maximum force, moment and the joint angle at which they are attained (Ahn et al. 1992). The variation in active isometric force production with joint angle is dependent on the optimal muscle fiber length, apodeme slack length and the shape of the normalized force–length curve. The width of the force–length curve is known to vary substantially among invertebrates (Full, 1995). Flight muscle in insects operates over a very narrow strain range (50 % maximum isometric force at ±3 % strain), whereas the muscles of hydrostatic animals can have a very broad range (50 % maximum isometric force at ±50 % strain). Our force–length curve fell between these two extremes (50 % maximum isometric force at ±30–35 % strain), but obtaining force–length curves for cockroach extensors should be a priority in the near future. Alteration in the MAC force–length relationship is best characterized by the ratio of apodeme slack length to optimal muscle fiber length (lS
A
/loM). Compliant
musculo-tendon actuators have ratios greater than 1, which
widen the ascending region of the force–length curve as well as increase the relative muscle length at which maximum force is attained (Zajac, 1989; Hoy et al. 1990). Values of lSA/loM
range from 0.01 (gluteus maximus) to 11.3 (soleus) in humans (Hoy et al. 1990), and from 1 (semitendinosus) to 6 (plantarflexors) in cats (Zajac, 1989). The lSA/loM ratio of the
semitendinosus muscle of frogs is 1.5 (Lieber et al. 1991). By comparison, cockroach extensor musculo-apodeme actuators appear relatively stiff (lSA/loM=0.07–0.53; Table 2), so that
changes in active force should result largely from shifts on the muscle fiber force–length curve.
Musculo-apodeme complex moment arm
Maximum moment arm varied by nearly twofold among muscles, but was far more sensitive to joint angle (Fig. 6B). The model’s predictions of joint moment are striking because moment decreased to zero and switched to the opposite side of the center of rotation at joint angles within the normal range of motion. Certainly, the effect of the action of the muscle on leg function cannot be assessed without exoskeletal morphological data, even if the musculo-apodeme force is known. MAC moment arms resulted in the extensor muscles of the metathoracic leg developing a total force equivalent to over 50 times body weight to generate the leg ground reaction force measured. The force summed from all the MACs in the cockroach hind leg coxa was approximately 10 times greater than the force output at the leg due to the moment arm ratio (r/R). These estimates are only for the case where moment arm is maximal. The summed MAC force would have to double to 100-fold the body weight to exert the same leg ground reaction force if the joint angle was increased from 45 to 100 ˚.
179
0 50 100 150
178
0 50 100 150
177c
0 50 100 150
177e
0 50 100 150
177a
0 50 100 150
Force Moment
Moment arm
177d
0 50 100 150
Force Moment
Moment arm
Coxa–femur angle (degrees) *
*
*
*
*
* *
*
*
* *
* *
* *
*
* *
(22 %) (35 %) (16 %)
(6 %) (9 %)
[image:11.609.95.518.70.287.2](11 %)
All moment arm lengths were within 5 % of the maximum at the in vivo joint angle used by the animal during wedging (Fig. 9). In particular, the joint angles at which maximum moment arm was produced for the three major moment-generating muscles (177c, 177a and 178) were remarkably close to the joint angle used during wedging behavior. Musculo-apodeme complex moment
The total MAC moment (MTMAC) predicted by the model
adequately explained the joint moment measured in a wedging cockroach (MLeg). The data lend support to the parameter
values used in the model because predicted musculo-apodeme moment (MTMAC) was similar to the measured leg moment
(MLeg). M T
MAC was only 30–50 % greater than the value
determined from ground reaction force data (Table 3). Note that the moment determined from the ground reaction force (MLeg) is a net moment (extensor 2 flexor), whereas the
model-generated moment was based solely on the extensor muscle moment production. Therefore, any flexor contribution to the moment would tend to make the moment values of the model closer to that measured during wedging. Moreover, all extensor muscles may not be fully active in the animal during wedging.
MAC moment was determined by both musculo-apodeme force production and joint kinematics. Musculo-apodeme force, and to a lesser extent moment arm, set the magnitude of the maximum moment. The variation in moment with joint angle resulted almost exclusively from the variation in moment arm (Fig. 6). MACs with large moment arms can generate larger moments. However, large moment arms cause MACs to go through greater excursions with changes in joint angle, thereby limiting the range of joint angles over which moment is developed (Delp and Zajac, 1992). The moment arm length of muscle 179 was three-fifths of that of muscle 177d. Correspondingly, the maximum active moment produced by muscle 179 was three-fifths of that of muscle 177d. However, muscle 179 developed 80 % of its maximum active moment over a 10 ˚ wider range of joint angles than muscle 177d because of its smaller excursions with changes in joint angle. These results further support the conclusion that isolated muscle function alone simply cannot predict joint and leg function. Perhaps the most extreme example occurred at coxa–femur angles greater than 100 ˚, where so-called ‘extensors’ acted as flexors to rotate the leg away from its maximum extension (Fig. 6C).
The angle at maximum moment for each individual muscle differed from the joint angle used by the animal during wedging (Fig. 9). Likewise, the joint angles at maximum moment, moment arm and force production did not coincide exactly. Upon first examination, these results appear consistent with the conclusions from studies of human (Hoy et al. 1990) and frog (Lieber and Boakes, 1988) leg muscles, where variation in the joint angle of maximum moment arm and force production led to moment production over a broader range of angles. However, the total, maximum MAC moment predicted (MTMAC) by the present model did occur at the same joint angle
(45 ˚) measured in the animal during wedging (Table 3). Furthermore, all musculo-apodeme moments at the in vivo joint angle were within 15 % of the maximum and five out of the six muscles were within 5 %. In particular, the joint angles at maximum moment for all three major moment-generating muscles (177c, 177a and 178) were remarkably close to the joint angle used by the animal during wedging (Fig. 9). With the single exception of muscle 177e, the joint angle ranges representing 95 % of maximum values for moment arm length and force production overlapped with each other, with the joint angle range representing 95 % of maximum moment and with the angle used in vivo during wedging.
The present musculo-skeletal model supports design hypotheses that favor maximum moment production by leg muscles as opposed to the development of smaller moments over a broad range of joint angles. We were surprised that the angle at maximum force, moment arm and moment for the cockroach extensor musculo-apodeme complexes fell, in most cases, within 5 % of the maximum, given the estimations made and the assumptions of the model. We are encouraged by the concordance of the model’s predictions and the in vivo measurements on the animal. Sensitivity analyses using the present model with this and other closely related species, in concert with direct measurements, will allow us to answer mechanistic questions of musculo-skeletal function as well as to begin to explore evolutionary hypotheses.
List of symbols
soA optimal apodeme stress
a pennation angle or the angle between the line of action of the muscle and the direction of the muscle fiber
EA elastic or Young’s modulus of apodeme
FA apodeme force
F˜A normalized apodeme force (F˜A=FA/F oM)
FLeg resultant, steady-state force by hind leg measured
during wedging FM muscle force
F˜M normalized isometric muscle force (F˜M=FM/F oM)
FMAC musculo-apodeme complex force
FTMAC total musculo-apodeme complex force summed for
all muscles
FoM maximum isometric force
k˜A normalized apodeme stiffness
lA apodeme length
l˜A normalized apodeme length (l˜A=lA/l o
M=l˜MA−l˜Mcosa)
lSA apodeme slack length or the apodeme length beyond
which the apodeme just begins to develop force l˜SA normalized apodeme slack length (l˜SA=lSA/loM).
lM muscle fiber length
l˜M normalized muscle fiber length (l˜M=lM/l o M)
loM optimal muscle fiber length or the muscle length at
lMA musculo-apodeme length
l˜MA normalized muscle-apodeme length (l˜MA=lMA/l oM)
llref muscle fiber reference length
MAC musculo-apodeme complex
MLeg maximum coxa–femur joint moment measured
during wedging
MMAC musculo-apodeme complex moment
MTMAC total musculo-apodeme complex moment summed
for all MACs
PCSA physiological cross-sectional area
R leg or ground reaction force moment arm of the coxa–femur joint
r musculo-apodeme moment arm length r- mean MAC moment arm length
r/R moment arm ratio or mechanical advantage SIMM Software for Interactive Musculoskeletal
Modeling, MusculoGraphics, Inc.
We thank Scott Delp, Peter Loan, Marvalee Wake, Rudy Pipa, Chris Eckel, Kay Earls, Randi Weinstein, Darrell Stokes, Ben Wong, Rodger Kram, Liz Queathem, Claire Farley and Paul-Henri Arnaud. This work was supported by NSF PYI Grant DCB 90-58138 to R.J.F.
References
AHN, A., FULL, R. J. AND EARLS, K. (1992). Partitioning of joint
moment among muscles in an insect leg. Am. Zool. 32, 31A. ALEXANDER, R. MCN. (1985). The maximum forces exerted by
animals. J. exp. Biol. 115, 231–238.
ALSOP, D. M. (1978). Comparative analysis of the intrinsic leg
musculature of the american cockroach, Periplaneta americana (L.). J. Morph. 58, 199–242.
ANDRIACCHI, T. P., ANDERSON, R., ORTENGREN, R. ANDMIKOSZ, R. P. (1984). A study of factors influencing muscle activity about the knee joint. J. orthop. Res. 1, 266–275.
ARBAS, E., LEVINE, R. AND STRAUSFELD, N. (1995). Invertebrate
systems from a comparative viewpoint: Nervous system. In Handbook of Comparative Physiology (ed. W. Dantzler). Oxford: Oxford University Press. (in press).
BECHT, G. (1959). Studies on insect muscles. Bijdr. Dierk. 29, 1–40.
BIEWENER, A. A. (1989). Scaling body support in mammals: Limb posture and muscle mechanics. Science 245, 45–48.
BIEWENER, A. A. AND FULL, R. J. (1992). Force platform and kinematic analysis. In Biomechanics – Structures and Systems (ed. A. A. Biewener), pp. 45–73. New York: Oxford University Press. BLICKHAN, R. AND FULL, R. J. (1993). Similarity in multilegged
locomotion: Bouncing like a monopode. J. comp. Physiol. 173, 509–517.
BORROR, D. J. AND DELONG, D. M. (1971). An Introduction to the Study of Insects, 3rd edn. New York: Holt, Reinhart and Winston. BUCHTHAL, F., KAISER, E. ANDKNAPPEIS, G. G. (1944). Elasticity, viscosity and plasticity in the cross striated muscle fibre. Acta physiol. scand. 8, 16–37.
CARBONELL, C. S. (1947). The thoracic muscles of the cockroach,
Periplaneta americana. Smithson. misc. Collns. 107, 1–23. CLOSE, R. I. (1972). Dynamic properties of mammalian skeletal
muscles. Physiol. Rev. 52, 129–197.
DELCOMYN, F. (1982). Muscles and muscular activity. In The
American Cockroach (ed. W. J. Bell and K. G. Adiyodi), pp. 275–304. New York: Chapman and Hall.
DELP, S. L. ANDLOAN, J. P. (1995). A software system to develop and analyze models of musculoskeletal structures. Computers Biol. Med. (in press).
DELP, S. L., LOAN, J. P., HOY, M. G., ZAJAC, F. E., TOPP, E. L. AND
ROSEN, J. M. (1990). An interactive graphics-based model of the lower extremity to study orthopaedic surgical procedures. IEEE Trans. Biomed. Eng. 37, 757–767.
DELP, S. L. ANDZAJAC, F. E. (1992). Force- and moment-generating capacity of lower-extremity muscles before and after tendon lengthening. Clin. Orthop. 284, 247–259.
DRESDEN, D. AND NIJENHUIS, E. D. (1953). On the anatomy and mechanism of motion of the mesothoracic leg of Periplaneta americana (L.) Proc. Kon. Ned. Akad. Wetensch. Ser. C56, 39–47. EVANS, M. E. G. (1977). Locomotion in the Coleoptera Adephaga,
especially Carabidae. J. Zool., Lond. 181, 189–226.
EVANS, M. E. G. AND FORSYTHE, T. G. (1984). A comparison of adaptations to running, pushing and burrowing in some adult Coleoptera: especially Carabidae. J. Zool., Lond. 202, 513–534. FORSYTHE, T. G. (1983). Locomotion in ground beetles (Coleoptera
carabidae): An interpretation of leg structure in functional terms. J. Zool., Lond. 200, 493–507.
FORSYTHE, T. G. (1991). Feeding and locomotory functions in relation to body form in five species of ground beetles (Coleoptera: Carabidae). J. Zool., Lond. 223, 233–263.
FOURTNER, C. R. (1978). The ultrastructure of the metathoracic
femoral extensors of the cockroach, Periplaneta americana. J. Morph. 156, 127–140.
FULL, R. J. (1993). Integration of individual leg dynamics with whole body movement in arthropod locomotion. In Biological Neural Networks in Invertebrate Neuroethology and Robotics (ed. R. Beer, R. Ritzman and T. McKenna), pp. 3–20. New York: Academic Press. FULL, R. J. (1995). Invertebrate systems from a comparative viewpoint: Locomotor system. In Handbook of Comparative Physiology (ed. W. Dantzler). Oxford: Oxford University Press. (in press).
FULL, R. J., BLICKHAN, R. AND TING, L. H. (1991). Leg design in
hexapedal runners. J. exp. Biol. 158, 369–390.
FULL, R. J. AND TU, M. S. (1990). The mechanics of six-legged
runners. J. exp. Biol. 148, 129–146.
FULL, R. J. ANDTULLIS, A. (1990). Capacity for sustained terrestrial
locomotion in an insect: Energetics, thermal dependence and kinematics. J. comp. Physiol. B 160, 573–581.
FULL, R. J., YAMAUCHI, A. ANDJINDRICH, D. (1995). Maximum single-leg force production: cockroaches righting on photoelastic gelatin. J. exp. Biol. (in press).
GORDON, A. M., HUXLEY, A. F. ANDJULIAN, F. J. (1966). The variation in isometric tension with sarcomere length in vertebrate muscle fibres. J. Physiol., Lond. 184, 170–192.
HAFFAJEE, D., MORITZ, U. AND SVANTESSON, G. (1972). Isometric knee extension strength as a function of joint angle, muscle length and motor unit activity. Acta orthop. scand. 43, 138–147. HATZE, H. (1973). A myocybernetic control model of skeletal muscle.
Biol. Cybernetics 25, 103–119.
HERREIDII, C. F. ANDFULL, R. J. (1984). Cockroaches on a treadmill: aerobic running. J. Insect Physiol. 30, 395–403.
relationship of muculotendon actuators at the hip, knee and ankle. J. Biomech. 23, 157–169.
HUMASON, G. L. (1979). Animal Tissue Techniques, 4th edn. San
Francisco: W. H. Freeman and Co.
ISMAIL, H. M. AND RANATUNGA, K. W. (1978). Isometric tension
development in a human skeletal muscle in relation to its working range of movement: the length–tension relation of biceps brachii muscle. Exp. Neurol. 62, 595–604.
JAHROMI, S. S. AND ATWOOD, H. L. (1969). Structural features of
muscle fibres in the cockroach leg. J. Insect. Physiol. 15, 2255–2262.
JOSEPHSON, R. K. (1993). Contraction dynamics and power output of skeletal muscle. A. Rev. Physiol. 55, 527–546.
KER, R. F. (1977). Some structural and mechanical properties of locust and beetle cuticle. PhD thesis, University of Oxford. KNAPIK, J. J., WRIGHT, J. E., MAWDSLEY, R. H. ANDBRAUN, J. (1983).
Isometric, isotonic and isokinetic torque variations in four muscle groups through a range of joint motion. Physiol. Ther. 63, 938–947. LIEBER, R. L. ANDBOAKES, J. L. (1988). Sarcomere length and joint
kinematics during torque production in frog hindlimb. Am. J. Physiol. 254, C759–C768.
LIEBER, R. L. AND BROWN, C. G. (1992). Sarcomere length–joint angle relationships of 7 frog hindlimb muscles. Acta anat. 145, 289–295.
LIEBER, R. L., BROWN, C. G. ANDTRESTIK, C. L. (1992). Model of
muscle–tendon interaction during frog semitendinosus fixed-end contractions. J. Biomech. 25, 421–428.
LIEBER, R. L., LEONARD, M. E., BROWN, C. G. ANDTRESTIK, C. L. (1991). Frog semitendinosus tendon load–strain and stress–strain properties during passive loading. Am. J. Physiol. 261, C86–C92.
MALAMUD, J. G. (1989). The tension in a locust flight muscle at varied
muscle lengths. J. exp. Biol. 144, 479–494.
MENDEZ, J. AND KEYS, A. (1960). Density and composition of
mammalian muscle. Metabolism 9, 184–188.
POWELL, P. L., ROY, R. R., KANIM, P., BELLO, M. A. ANDEDGERTON,
V. R. (1984). Predictability of skeletal muscle tension from architectural determinations in guinea pig hindlimbs. J. appl. Physiol. 57, R1715–R1721.
RUEGG, J. C. (1968). Dependence of cardiac contractility on
myofibrillar calcium sensitivity. News physiol. Sci. 2, 179–812. SALE, D., QUINLAN, J., MARSH, E., MCCOMAS, A. J. ANDBELANGER,
A. Y. (1982). Influence of joint position on ankle plantarflexion in humans. J. appl. Physiol. 52, R1636–R1642.
SMIT, W. A., BECHT, B. AND BEENAKKERS, A. M. TH. (1967). Structure, fatigue and enzyme activities in ‘fast’ insect muscles. Insect Physiol. 13, 1857–1868.
STOKES, D. R. (1987). Insect muscles innervated by single
motoneurons: Structural and biochemical features. Am. Zool. 27, 1001–1010.
STOKES, D. R., JOSEPHSON, R. K. ANDPRICE, R. B. (1975). Structural and functional heterogeneity in an insect muscle. J. exp. Biol. 194, 379–408.
TING, L. H., BLICKHAN, R. ANDFULL, R. J. (1994). Dynamic and static
stability in hexapedal runners. J. exp. Biol. 197, 251–269.
VAN LEEUWEN, J. L. (1992). Muscle function in locomotion. In
Mechanics of Animal Locomotion, vol. 11 (ed. R. McN. Alexander), pp. 191–249. New York: Springer-Verlag.