Diffusion-Weighted MR of Acute Cerebral
Infarction: Comparison of Data
Processing Methods
June Chong, Dongfeng Lu, Fatima Aragao, Michael B. Singer, Wouter J. Schonewille, Adam Silvers, Stanley Tuhrim, and Scott W. Atlas
BACKGROUND AND PURPOSE: Some investigators have proposed that either calculated diffusion trace images or apparent diffusion coefficient (ADC) maps, which require imaging with multiple diffusion sensitivities and/or postacquisition image processing, are essential for the accurate interpretation of diffusion-weighted images in acute stroke because of the possible pitfalls of regional diffusion anisotropy, magnetic susceptibility artifacts, and confounding T2 effects, all of which alter signal on diffusion-weighted MR images. The purpose of our study was to compare the sensitivity, specificity, and accuracy of simple, orthogonal-axis diffusion-weighted imaging for the diagnosis of early cerebral infarction with three other sets of postacquisition-processed images: isotropic diffusion-weighted, diffusion trace-weighted, and diffusion trace images.
METHODS:Twenty-six consecutive adult patients with signs and symptoms consistent with a clinical diagnosis of early cortical and/or subcortical cerebral infarction and 17 control subjects were studied with multisection, single-shot, spin-echo echo-planar diffusion-weighted imaging at 1.5 T to generate a set of three orthogonal-axis diffusion-weighted images. Isotropic diffusion-weighted, diffusion trace-weighted, and diffusion trace (mean ADC) images were then generated off-line and all four sets of images were interpreted blindly by two neuroradiologists.
RESULTS:The average sensitivity, specificity, and accuracy for the orthogonal-axis diffusion-weighted images were 98.1%, 97.1%, and 97.7%, respectively. The average sensitivity, specificity, and accuracy for isotropic diffusion-weighted images were 88.5%, 100%, and 93% respectively. The average sensitivity, specificity, and accuracy for diffusion trace-weighted images were 82.7%, 73.6%, and 79.1%, respectively. The average sensitivity, specificity, and accuracy for diffusion trace images were 50.0%, 85.3%, and 64.0%, respectively.
CONCLUSION: Orthogonal-axis diffusion-weighted images have the highest sensitivity and accuracy and very high specificity for early cerebral infarction. Our data contradict the contention that quantitative diffusion maps, requiring imaging with multiple diffusion sensi-tivities and/or subsequent image processing, are necessary for clinical stroke imaging.
Preliminary studies have shown that diffusion-weighted imaging has high sensitivity and specificity for early cerebral infarction and is more sensitive than conventional T2-weighted MR imaging. Regions of early cerebral infarction have decreased apparent dif-fusion coefficient (ADC) and high signal intensity on diffusion-weighted MR images, reflecting restricted
diffusion relative to normal brain (1–4). However, the relative signal intensities on diffusion-weighted MR images can show regional variation in normal brain tissue as well. In normal brain tissue, diffusion may be relatively more restricted in one direction than in another owing to the organization of cellular struc-tures, cell membranes, or pattern of myelination, termed diffusion anisotropy (5–7). Theoretically, the relative orientation of the diffusion gradient and the fiber tract could lead to obscuration or overestima-tion of acute infarcoverestima-tion. The signal intensity on diffu-sion-weighted MR images can also be affected by magnetic susceptibility artifacts and confounding T2 effects, since diffusion-weighted MR images show contrast signal due to both diffusion changes and T2 differences.
Received February 9, 1998; accepted after revision June 23. From the Departments of Radiology (J.C., D.L., F.A., M.B.S., A.S., S.W.A.) and Neurology (W.J.S., S.T.), Mount Sinai School of Medicine, New York, NY.
Address reprint requests to Scott W. Atlas, MD, Department of Radiology, Stanford University Medical Center, 300 Pasteur Dr, Stanford CA 94035.
©American Society of Neuroradiology
Because of these possible pitfalls, many studies that use diffusion MR imaging have relied on images that have been generated by processing simple diffusion-weighted images. Some investigators have further proposed that either calculated diffusion trace images or ADC maps, which require imaging with multiple diffusion sensitivities and/or postacquisition image pro-cessing, are “absolutely essential for the accurate inter-pretation of diffusion-weighted imaging in stroke” (8).
The purpose of our study was to compare the sen-sitivity, specificity, and accuracy of diffusion-weighted imaging for the delineation of early cerebral infarc-tion using a set of orthogonal-axis diffusion-weighted images with that of three other sets of postacquisition processed images; namely, isotropic diffusion-weighted, diffusion trace-weighted, and diffusion trace images.
Methods Subjects
Forty-three adult subjects constituted the study group, in-cluding 26 consecutive adult patients (12 men and 14 women) with signs and symptoms consistent with a clinical diagnosis of acute cortical and/or subcortical cerebral infarction. The time interval between onset of ictus and imaging ranged from 7 hours to 4 days (mean, 1.9 days). Of these 26 patients, five were imaged 12 hours or less after onset of clinical symptoms, 13 were imaged between 24 and 48 hours, and eight were imaged between 48 and 96 hours. Time of onset was based on the clinical history of when the patient was last noticed to be symptom free. If the patient awoke with symptoms, time of onset was considered to be the time he or she went to sleep. Control subjects included 17 adult patients in whom cerebral infarction was not suspected but who had nonfocal neurologic symptoms and who underwent the identical imaging protocol.
Image Acquisition
All MR studies were performed on one of two 1.5-T MR systems modified with hardware for echo-planar imaging. Both conventional fast spin-echo (FSE) and diffusion-weighted MR images were obtained for all patients, including the control subjects, during the same imaging session and at the same section locations. Conventional imaging consisted of sagittal T1-weighted (TR/TE 5 600/8) SE sequences; axial proton density–weighted (TR/TEeff52000/30) FSE sequences; axial
T2-weighted (TR/TEeff53600/95) FSE sequences; and axial
T1-weighted (TR/TE5600/8) SE sequences. In all images, the field of view (FOV) was 24324 cm, and the section thickness was 5 mm with 2.5-mm spacing.
Multisection single-shot SE echo-planar diffusion-weighted imaging sequences were obtained with two square diffusion gradient pulses applied before and after the 180° pulse (d531, D 536.6, TR/TE510,000/99). The FOV was 24324 cm and the section thickness was 5 mm with 2.5-mm spacing. The matrix size was 1283128 in most studies. A typical study had 18 sections with an acquisition time of 25 seconds. The pulse sequence first acquired a set of axial T2-weighted images (10) without the diffusion gradients. The diffusion gradients were then applied sequentially in three orthogonal axes in the direc-tions of the section-select, phase-encoding, and readout gradi-ents, to generate a set of three orthogonal-axis diffusion-weighted echo-planar images (Iz, Iy, and Ix) as
Ix5I0exp~2Dxzb!
1) Iy5I0exp~2Dyzb! Iz5I0exp~2Dzzb!
where Dx, Dy, and Dz are apparent diffusion constants
mea-sured with diffusion gradients applied in the direction of the section-select, phase-encoding, and readout gradients, and b is the diffusion sensitivity that, neglecting the contribution of imaging gradients, was 1000 s/mm2.
Image Processing
The diffusion echo-planar images were transferred to a Sun-based workstation (GE, Milwaukee, WI) for off-line postpro-cessing using software developed by IDL Research Systems (Boulder, CO). Isotropic diffusion-weighted, diffusion trace-weighted, and diffusion trace images were generated from the three orthogonal-axis diffusion-weighted images, defined as follows:
The isotropic diffusion-weighted image (Iiso) was defined as
2) Iiso5
Î
3IxzIyzIz5I0zexp
F
2~Dx1Dy1Dz!zb
3
G
The diffusion trace image (Itrace) was calculated as
3) Itrace52@log~Ix!1log~Iy!1log~Iz!23zlog~I0!#
5~Dx1Dy1Dz!zb
where log is the natural logarithm.
The diffusion trace-weighted image (Itw) was
4) Itw5
IxzIyzIz I02
5I0zexp@2~Dx1Dy1Dz!zb#
From these equations, one notes that the image intensity of the isotropic diffusion-weighted image, Iiso, has both T2
weight-ing and diffusion trace weightweight-ing, where the diffusion trace is the average of the ADCs in the three orthogonal axes. The image intensity of the diffusion trace-weighted image, Itw, also
has T2 weighting and diffusion trace weighting. The difference between Itwand Iisois that Itwhas three times as much diffusion
weighting (b value) as does Iiso. On the other hand, Itraceis
determined only by diffusion trace weighting and is not affected by T2 weighting, representing a trace of the diffusion tensor (7). All equations assume that the diffusion process can be modeled as a single exponential decay.
Image Interpretation
Four separate sets of images were presented for interpreta-tion to the two readers: orthogonal-axis diffusion-weighted images, isotropic diffusion-weighted images, diffusion trace-weighted images, and diffusion trace maps. Each MR image set was interpreted separately and independently in different ses-sions by each of two experienced neuroradiologists blinded to the interpretation of all other images and to clinical findings except for the notation “rule out acute infarction.” We inverted the contrast on the diffusion trace images so that CSF and other areas with high diffusion appeared as low signal intensity and areas of abnormally low diffusion appeared as high signal intensity. This gray scale inversion was performed to ensure that all image sets were consistent in their depiction of tissues with high diffusion as hypointense and those with restricted diffusion as hyperintense. In this way, we tried to eliminate any confounding effect of difference in conspicuity between black lesions on white background versus white lesions on black background, since we wanted to test the contrast characteristics of diffusion-related quantities rather than issues related to visual physiology.
high intensity, based on prior literature (1–4); location in the basal ganglia, deep and/or subcortical white matter, brain stem, or cortical arterial distribution; location or configuration not thought by the reader to represent normal anisotropy of diffu-sion (using features like asymmetry and knowledge of normal white matter tract location); and location or configuration not thought to represent a magnetic susceptibility artifact (ie, typ-ically near interfaces between brain and air-filled paranasal sinuses). On the orthogonal-axis diffusion-weighted images, the lesion did not necessarily have to be present on more than one of the three single-axis diffusion-weighted images to be inter-preted as an infarction (ie, obscuration of stroke-related hy-perintensity situated within hyperintense signal in a normal internal capsule on one diffusion axis might be eliminated by changing the direction of diffusion sensitivity) (Fig 1). There-fore, a high signal focus could be interpreted as positive for acute infarction even when seen in only one of the three orthogonal-axis diffusion-weighted images if that focus met the other criteria listed above. In all cases, the precise neuroana-tomic location of such lesions was noted. These lesions were subsequently evaluated, in consultation with an experienced stroke neurologist (who had personally examined each patient before the MR study), to determine if the location of high
intensity on diffusion-weighted MR images correlated with all or part of the patient’s symptoms. The proof of the diagnosis was therefore based on clinical findings.
Results
Twenty-six patients were found to have early cere-bral infarction: 14 infarctions were subcortical, five cortical, and seven mixed with subcortical and cortical components.
The results are summarized in Table 1, andP val-ues for the comparisons are given in Table 2. The average sensitivity, specificity, and accuracy of the two interpreters for the three orthogonal-axis diffusion-weighted sequences were 98.1%, 97.1%, and 97.7%, respectively. The average sensitivity, specificity, and accuracy for isotropic diffusion-weighted imaging were 88.5%, 100%, and 93.0%, respectively. The av-erage sensitivity, specificity, and accuracy for diffu-sion trace-weighted imaging were 82.7%, 73.6%, and
FIG 1. Acute left thalamus and internal capsule infarction.
Top row, Three single axial orthogonal-axis diffusion-weighted images of patient with acute left internal capsular infarction (left,
diffusion sensitivity in section-select direction;center, diffusion sensitivity in left-right direction;right, diffusion sensitivity in
anteropos-terior direction).
Bottom row,Isotropic diffusion-weighted image (left), trace-weighted image (center), diffusion trace image (right).
The small focus of hyperintensity is identifiable on all three single-axis diffusion-weighted images, but it is not as easy to identify on
the image in which diffusion sensitivity is in the anteroposterior direction (top right), owing to high intensity from normal diffusion
anisotropy in internal capsule. While the lesion is also seen on isotropic diffusion-weighted image (bottom left) and trace-weighted
image (bottom center), the diffusion trace image was interpreted as normal by blinded readers.Arrowinbottom rightimage indicates
79.1%, respectively. The average sensitivity, specific-ity, and accuracy for diffusion trace imaging were 50.0%, 85.3%, and 64.0%, respectively.
The results of Table 1 show certain differences between sensitivities, specificities, and accuracies, some of which are trends and some of which reach statistical significance (see Table 2). Sensitivities for the orthogonal-axis diffusion-weighted images, isotro-pic diffusion-weighted images, and trace-weighted images all are superior to the sensitivity of the diffu-sion trace images (P values ranging from .0001 to .0271). Although orthogonal-axis diffusion-weighted images were more sensitive than either isotropic fusion-weighted or trace-weighted images, these dif-ferences were not statistically significant. Difdif-ferences in specificities of the different images were generally not statistically significant, with the exception of the orthogonal-axis diffusion-weighted and isotropic dif-fusion-weighted images, which had higher specificity than the trace-weighted images (P 5 .0445). Data again showed the trend of highest accuracy for the orthogonal-axis diffusion-weighted images as com-pared with all the alternative images. However, the differences with the highest statistical significance were found in comparisons of the orthogonal-axis
weighted images or isotropic diffusion-weighted images with the diffusion trace images (P values ranging from .0001 to .0016). Less significant was the superior accuracy of the orthogonal-axis dif-fusion-weighted images as compared with the trace-weighted images.
From the data establishing that calculated diffusion trace images, the only images based on diffusion dif-ferences without contributions from T2 difdif-ferences, were less accurate than diffusion-weighted images (Fig 1), we inferred that hyperintensity on T2-weighted images actually contributed to lesion visibil-ity on diffusion-weighted images. Therefore, we ret-rospectively evaluated the appearance of diffusion-weighted imaging–documented and clinically proved acute infarctions on the corresponding T2-weighted images. This side-by-side analysis was performed in an attempt to determine how many of the infarctions were also hyperintense on T2-weighted images, which would then clarify the implications from our blinded reader data as described above. Of the 26 diffusion-weighted MR–delineated acute infarctions, 22 (85%) showed at least some hyperintensity within the same lesion on T2-weighted images, while four (15%) were normal, even in retrospect (many of these lesions were extremely subtle on T2-weighted MR images, so it is possible that they were not detected in a blinded reader setting). In addition, 15 (58%) of 26 diffusion-weighted MR-delineated acute infarctions showed additional focal infarctions on T2-weighted images that also met standard criteria for acute infarctions (ie, were not distinguishable on T2-weighted MR im-ages from the single proved acute infarction, even though they were not acute by either clinical or dif-fusion-weighted MR criteria).
Discussion
[image:4.587.54.534.75.153.2]In proton MR imaging, the signal intensity depends on T1 and T2 relaxation times, proton density, pulsa-tile flow, and the random molecular motion of water. With conventional MR imaging, the signal contrib-uted by the random diffusion of water molecules (Brownian motion) is extremely small. By incorporat-ing strong magnetic field gradient pulses within the imaging pulse sequence, diffusion-weighted imaging can be performed. A pair of diffusion-sensitizing gra-dient pulses is applied to dephase and then rephase the protons in water molecules. Any net translational movement of the water molecules results in a loss of signal; the greater the net diffusion, the lower the signal.
TABLE 1: Comparison of sensitivity, specificity, and accuracy for the diagnosis of acute cerebral infarction (percentages)
Image Type (Reader 1/Reader 2) Average
Sensitivity Specificity Accuracy Orthogonal-axis diffusion-weighted (100/96.2) 98.1 (94.1/100) 97.1 (97.7/97.7) 97.7 Isotropic diffusion-weighted (92.3/84.6) 88.5 (100/100) 100 (95.3/90.7) 93.0 Trace-weighted (88.5/76.9) 82.7 (76.5/70.6) 73.5 (83.7/74.4) 79.1 Trace (53.8/46.2) 50.0 (88.2/82.4) 85.3 (67.4/60.5) 64.0
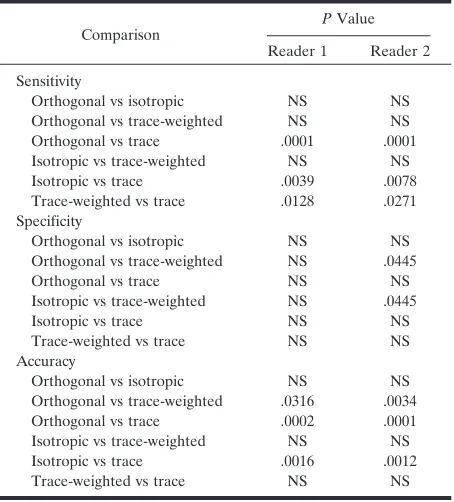
TABLE 2: Statistical significance of comparisons by Fisher’s exact test
Comparison PValue Reader 1 Reader 2 Sensitivity
Orthogonal vs isotropic NS NS Orthogonal vs trace-weighted NS NS Orthogonal vs trace .0001 .0001 Isotropic vs trace-weighted NS NS Isotropic vs trace .0039 .0078 Trace-weighted vs trace .0128 .0271 Specificity
Orthogonal vs isotropic NS NS Orthogonal vs trace-weighted NS .0445 Orthogonal vs trace NS NS Isotropic vs trace-weighted NS .0445 Isotropic vs trace NS NS Trace-weighted vs trace NS NS Accuracy
Orthogonal vs isotropic NS NS Orthogonal vs trace-weighted .0316 .0034 Orthogonal vs trace .0002 .0001 Isotropic vs trace-weighted NS NS Isotropic vs trace .0016 .0012 Trace-weighted vs trace NS NS
[image:4.587.56.283.479.730.2]Preliminary studies using diffusion-weighted MR imaging have indicated that early infarction is seen as regional high signal intensity relative to background tissue (3, 4), which allows high sensitivity for early infarction as well as clear distinction of acute from nonacute infarctions, even when all lesions are visible on conventional MR images (9). This relative hyper-intensity at least partially reflects restriction of tissue water movement in the area of infarction, although the precise pathophysiological events underlying the change in water diffusion are unclear. It is thought that the loss of normal homeostasis and cell mem-brane function within ischemic cells leads to in-creased cell membrane permeability. The secondary shift of water from the extracellular space to the intracellular compartment, so that there would be a more restricted environment for water movement in the new extracellular environment, is postulated by many investigators as the cellular event correspond-ing to the change on MR images (10–13).
In normal tissues, diffusion may also be more re-stricted in one direction than another owing to the organization of cellular structures, cell membranes, or pattern of myelination. The diffusion coefficient is lower across barriers, with resultant higher signal on diffusion-weighted images. This is termed diffusion anisotropy, a property of certain tissues or media in which the translational movements of water depend on the orientation of the medium in which the water resides (7). This diffusion anisotropy is seen in nor-mal brain parenchyma, especially in the white matter tracts and the corpus callosum (5, 14, 15), and could theoretically lead to inaccurate delineation or mask-ing of early cerebral infarcts. In the subcortical white matter, for example, the ADC along the direction of the white matter tract can be as high as 10 times that in the direction perpendicular to it (16–19).
One potential solution to the “problem” of diffu-sion anisotropy is to derive an image of the diffudiffu-sion trace, which equals the average of diffusion coeffi-cients of three orthogonal directions; hence, the dif-fusion trace is rotationally invariant. Another poten-tial way of compensating for diffusion anisotropy would be to generate an isotropic diffusion-weighted image. Indeed, previous studies have shown that trace-weighted or isotropic diffusion-weighted images can eliminate the directional dependence of diffusion images in the deep white matter and splenium of the corpus callosum in stroke patients (2), suggesting that isotropic diffusion-weighted images may be necessary in acute stroke diagnosis.
In our study, we processed data from the set of three orthogonal-axis diffusion-weighted images to compensate for diffusion anisotropy and potentially confounding T2 differences and compared blinded reader interpretations of postprocessed images to simple orthogonal-axis diffusion-weighted images in the diagnosis of acute cerebral infarction. Our data indicate that the sensitivity, specificity, and accuracy of diffusion-weighted imaging for early cerebral in-farction are greatly influenced by the choice of images generated for interpretation. The set of
orthogonal-axis diffusion-weighted images had the highest sensi-tivity and highest accuracy, with very high specificity. Data from isotropic diffusion-weighted images were nearly equivalent. Calculated diffusion trace (mean ADC) images were significantly less sensitive and significantly less accurate for delineating these lesions (Figs 1 and 2).
Since T2 effects are known to contribute to the signal differences on orthogonal-axis diffusion-weighted, isotropic diffusion-diffusion-weighted, and trace-weighted images, it could be inferred from our data that T2 effects are of some benefit in the diagnosis of acute infarctions on diffusion-weighted MR images. Our retrospective analysis supported that hypothesis, in that 85% of lesions also showed at least some hyperintensity in the infarction on T2-weighted im-ages. That does not mean, however, that T2-weighted MR imaging would have been adequate to make the diagnosis of acute infarction, because in the majority of our cases, the T2-weighted images showed addi-tional lesions consistent with acute infarctions, indis-tinguishable from the proved acute infarction. These data underscore the value of diffusion-weighted MR imaging in the search for acute cerebral infarction, even when the lesion may actually be visible (at least in retrospect) on conventional T2-weighted images.
In addition to the likelihood that T2 effects were helpful in depicting acute infarctions on diffusion-weighted MR images (which would explain the infe-riority of diffusion trace images), there are several possible contributing factors to help explain the result that trace-weighted images, isotropic diffusion-weighted images, and diffusion trace maps were all less sensitive than the set of three simple orthogonal-axis diffusion-weighted images in our blinded-reader study. This discrepancy may be partly explained by the fact that the deep white matter tracts are most hypointense on the diffusion-weighted image in which the diffusion gradient is parallel with the tracts. On this diffusion-weighted image, the contrast of a hy-perintense lesion in the deep white matter might conceivably be higher than that on the single calcu-lated isotropic diffusion-weighted or trace-weighted diffusion image, which represents the averaged diffu-sion weighting. This hypothesis is supported by the fact that all the infarctions undetectable on the post-processed images were in fact subcortical.
In addition to the difference in diffusion weighting, a secondary difference between the trace-weighted and isotropic diffusion images may result from the partial volume averaging of CSF (21). Because CSF has a significantly higher diffusion coefficient than does brain tissue, the diffusion process of a voxel that has CSF partial volume is not a single exponential decay as described in Equations 1 through 4 (22). In such a voxel, both the brain tissue and CSF, which has a long T2, contribute to the T2-weighted image, but only the brain tissue contributes to the three diffu-sion-weighted images because of the high diffusion coefficient of CSF. As a result, the trace-weighted image may underestimate the signal of brain tissue diffusion because it uses the T2-weighted image as a denominator in its calculation. On the other hand, the isotropic diffusion image is calculated with only the diffusion-weighted images and will reflect the true brain tissue diffusion.
We recognize certain limitations of our study. Al-though our patients had acute infarction by conven-tional definition, we recognize that few of our pa-tients were imaged within the putative “therapeutic window” time frame of 6 hours. This might have skewed our data to include lesions that were already hyperintense on T2-weighted images, which would have theoretically added to the sensitivity of
diffu-sion-weighted images and not to diffusion trace im-ages. However, prior studies have documented that diffusion remains restricted for many days after the acute infarction, so the diffusion trace images still should have been abnormal on the basis of restricted diffusion. Technically, we did not use eddy current compensation (it was unavailable at the time of this study), so that postacquisition image processing might theoretically be suboptimal when combining imaging data from different diffusion axes. We also recognize that we may have increased the yield of the set of orthogonal-axis diffusion-weighted images by pre-senting the reader with all three images with diffusion sensitivity at each section location as a set, thereby giving the interpreter three chances to detect a given lesion.
Furthermore, our study design did not lend itself to answer potentially important questions about diffu-sion-weighted MR interpretation. For instance, be-cause our blinded readers viewed all three single axis diffusion-weighted images as a set, we cannot test the hypothesis that only a single direction of diffusion sensitivity may be adequate to detect these lesions. Similarly, we cannot determine how many or what percentage of infarctions were detectable by using only one or only two directions of diffusion sensitivity. Moreover, we cannot answer the question about
FIG 2. Acute right internal capsule
infarc-tion. Focal high intensity abnormality is seen on orthogonal-axis diffusion-weighted im-age with diffusion sensitivity in section-se-lect direction (upper left), isotropic
diffusion-weighted image (upper right), and
trace-weighted image (lower left), but it is only
which single diffusion direction is the most sensitive for producing the highest yield for this type of imag-ing. These limitations and questions represent inter-esting studies that should be performed in the future. Regardless of these limitations and additional ques-tions, it seems reasonable to conclude that data show-ing 98.1% sensitivity, 97.1% specificity, and 97.7% accuracy for simple orthogonal-axis diffusion-weighted images for early cerebral infarction would be difficult to improve upon with any image-processing scheme.
Conclusion
The sensitivity, specificity, and accuracy of diffu-sion-weighted imaging for early cerebral infarction are greatly influenced by the choice of images gener-ated for interpretation. The set of orthogonal-axis diffusion-weighted images had the highest sensitivity and highest accuracy, with very high specificity. Data from isotropic diffusion-weighted images were nearly equivalent, while to some extent diffusion trace-weighted images and in particular diffusion trace, or mean ADC, images were not as effective in delineat-ing these lesions. Although we concur with the idea expressed by Ulug et al (23) that quantitative ADC maps may be useful in research protocols in which quantitation may be necessary, our data contradict the contention (8) that calculated or quantitative dif-fusion maps, requiring imaging with multiple diffu-sion sensitivities and subsequent image processing, are necessary for clinical stroke imaging. These data indicate that the theoretical concerns about the pit-falls of orthogonal-axis diffusion-weighted imaging may be unfounded in the clinical setting of diagnosing early stroke.
References
1. Moseley ME, Kucharczyk J, Mintorovitch J, et al. Diffusion-weighted MR imaging of acute stroke: correlation with T2-Diffusion-weighted and magnetic susceptibility-enhanced MR imaging in cats.AJNR Am J Neuroradiol1990;11:423–429
2. Warach S, Chien D, Li W, Ronthal M, Edelman R.Fast magnetic resonance diffusion weighted imaging of acute human stroke. Neu-rology1992;42:1717–1723
3. Warach S, Gaa D, Siewert B, Wiepolski P, Edelman R. Acute human stroke studied by whole brain echoplanar diffusion weighted magnetic resonance imaging.Neurology1995;37:231–241
4. Sorenson A, Buananno F, Gonzalez R, et al.Hyperacute stroke: evaluation with combined multisection diffusion weighted and he-modynamically weighted echoplanar imaging.Radiology1996;199: 391–401
5. Moseley ME, Cohen Y, Kucharczyk J, et al.Diffusion-weighted MR imaging of anisotropic water diffusion in cat central nervous sys-tem.Radiology1990;176:439–445
6. Buxton R, Kwong K, Brady T, Rosen B.Diffusion imaging of the human brain.J Comput Assist Tomogr1990;14:514–520
7. Basser PJ.New histological and physiological stains derived from diffusion-tensor MR images.Ann N Y Acad Sci1997;820:123–138 8. Warach S, Boska M, Welch K.Pitfalls and potential of clinical diffusion weighted MR imaging in acute stroke.Stroke 1997;28: 481–482
9. Singer M, Chong J, Lu D, Schonewille W, Tuhrim S, Atlas S.
Diffusion weighted MRI in acute subcortical infarction. Stroke
1998;29:133–136
10. Beneviste H, Hedlund L, Johnson G.Mechanism of detection of acute cerebral ischaemia in rats by diffusion-weighted magnetic resonance microscopy.Stroke1992;23:746–754
11. Latour L, Svoboda K, Mitra P.Time dependent diffusion of water in a biological model system.Proc Natl Acad Sci U S A1994;91: 1229–1233
12. Anderson A, Zhong J, Petroff A, Szafer A.Effects of osmotically driven cell volume changes on diffusion-weighted imaging of rat optic nerve.Magn Reson Med1996;35:162–167
13. van der Torn A, Sykova E, Dijkhuizen R, et al.Dynamic changes in water ADC, energy metabolism, extracellular space volume, and tortuosity in neonatal rat brain during global ischaemia.Magn Reson Med1996;36:52–60
14. Hajnal J, Doran M, Hall A, et al.MR imaging of anisotropically restricted diffusion of water in the nervous system: technical, an-atomic, and pathologic considerations. J Comput Assist Tomogr
1991;15:1–18
15. Doran M, Hajnal J, Van Bruggen N, King M, Young I, Bydder G.
Normal and abnormal white matter tracts shown by MR imaging using directional diffusion weighted sequences.J Comput Assist Tomogr1990;14:865–873
16. Pierpaoli C, Jezzard P, Basser PJ, Barnett A, Di Chiro G.Diffusion tensor MR imaging of the human brain.Radiology1996;201:637– 648
17. Pierpaoli C, Basser P.Toward a quantitative assessment of diffu-sion anisotropy.Magn Reson Med1996;36:893–906
18. van Gelderen P, DesPres D, van Zijl PC, Moonen CT.Evaluation of restricted diffusion in cylinders: phosphocreatine in rabbit leg muscle.J Magn Reson B1994;103:255–260
19. van Gelderen P, de Vleeschouwer M, DesPres D, Pekar J, van Zijl PC, Moonen CT.Water diffusion and acute stroke.Magn Reson Med1994;31:154–163
20. Sorensen A, Weiskoff R, Reese T, Rosen B. Optimization of diffusion-weighted MR imaging for evaluation of acute stroke.In:
Book of Abstracts.International Society of Magnetic Resonance in Medicine; 1995;1383
21. Michaelis T, Merboldt K, Bruhn H, Hanicke W, Frahm J.Absolute concentrations of metabolites in the adult human brain in vivo: quantification of localized proton MR spectra.Radiology1993;187: 219–227
22. Le Bihan D.Molecular diffusion nuclear magnetic resonance im-aging.Magn Reson Q1991;7:1–30