F. Glen Seidel
1 •2Richard Towbin
1.3Robert A
.
Kaufman
1.3This article appears in the September/Octo-ber 1985 issue of AJNR and the DecemSeptember/Octo-ber 1985 issue of AJR.
Received October 8, 1984; accepted after revi-sion March 12, 1985.
Presented at the annual meeting of the Society for Pediatric Radiology, Las Vegas, April 1984.
, Division of Radiology, Children's Hospital Med -ical Center, Eiland and Bethesda Aves., Cincinnati, OH 45229. Address reprint requests to R. Towbin. 2 Present address: Department of Radiology, Children's Hospital of Buffalo, Buffalo, NY 14222.
3 Departments of Radiology and Pediatrics, Uni -versity of Cincinnati College of Medicine, Cincinnati, OH 45267.
AJNR 6:733-738, September/October 1985 0195-6108/85/0605-0733
© American Roentgen Ray Society
733
Normal Pituitary Stalk Size in
Children:
CT Study
A retrospective study was undertaken of 1005 normal contrast-enhanced head com-puted tomographic (CT) scans in children to determine normal standards for pituitary stalk diameter, basilar artery diameter, and their ratio for age and gender. The pituitary _stalk enlarges with age, and girls have larger stalks than do boys after age 8. The pitUitary stalk-to-basilar artery ratio is easily estimated visually. Ratios greater than or
equal to I are unusual In normal children. A ratio greater than or equal to 1 should
prompt direct measurement of thi> italk and comparison with age-matched normal
values, If the stalk measurement is greater than 2 SO above the age-matched mean, it
is presumably abnormal and deserves further evaluation for numerous possible
patho-logic conditions including histiocytosis X, pituitary adenoma, hypothalamic lesions,
Rathke cleft cysts, metastases, sarcoidosis, hypothyroidism, and infection.
The normal pituitary stalk (PS) is a readily recognized structure on routine contrast-enhanced head computed tomography (CT). In the pediatric population, with relatively frequent endocrine problems and central nervous system (CNS) neoplasia, early recognition of an abnormal stalk is especially important. Unfortu-nately, no data are available in children that define normal stalk dimensions, although normal values were recently published for adults [1].
This lack of data was important for one of our early CT patients (fig. 1). A 16-year-old girl presented with growth failure. At that time, the scan was interpreted by several observers as normal. Unfortunately, 3 years later, the patient returned with headaches and blurred vision. A follow-up scan demonstrated a large supra-sellar dysgerminoma. Could this apparent false-negative scan have been avoided? We and others [2-6] have noted that there are variations in the size of the PS and pituitary gland with age. In particular, normal adolescent girls seem to have larger stalks and glands than do boys. To help us better distinguish a normal stalk from abnormal enlargement, we hypothesized that the normal PS diameter rarely equals and should not exceed the diameter of the basilar artery (BA). In other words, the ratio of the PS diameter to the BA diameter should be less than or equal to 1 (fig. 2). To test this hypothesis and to develop standards for the diameter of the PS and BA, as well as their ratio, for age and gender, we undertook this retrospective study.
Materials and Methods
We reviewed all contrast-enhanced head CT scans interpreted as normal from November
1981 through February 1984. Several scans from the same patient were included if separated by at least 1 year.
734 SEIDEL ET AL. AJNR:6, Sept/Oct 1985
midstalk in the suprasellar cistern. However, slight changes in scan angle and level, particularly in young children, could easily result in the inclusion of the dorsum sellae on the scan, even if the stalk was
well demonstrated. Therefore, notation was made of cases where the measurements were thought to be high near the tuber cinereum
or low near the dorsum sellae, but inclusion of the posterior clinoids did not disqualify the scan from the study (fig. 3). No estimate of the position of the optic chiasm (pre-or postfixed) was made. While this position may change the angle of the PS in the anterior or posterior direction, such angulation should not influence its transverse meas-urement. Since the BA can appear wide if it is coursing obliquely on
the scan, it was measured in a plane perpendicular to its course to
provide a more accurate cross-sectional measurement (fig. 4). The
BA measurement was usually made on the same slice as the stalk
measurement, but occasionally it was made on a lower slice. Finally,
the 5 cm index grid that appears on each scan was measured as a reference standard for conversion of these measurements to milli
-meters. All measurements in this study were made at routine window
Fig. 1.-16-year-old girl with growth failure. A, Is this PS abnormal (PS/SA > 1.0)? S, 3 years later after 2 weeks of headache and blurred vision. Large,
enhancing suprasellar mass (dysgerminoma).
Fig. 2.-Normal PS with PS/BA ratio less than 1.0. PS diameter (open arrows): BA diameter (closed arrows).
Fig. 3.-ldealized (B), high (A), and low (C) scanning planes through pituitary
and level settings-usually at a level of about 40 and a window of
80-150 H.
Initially, a small population of scans was measured with both the hand micrometer on film and with the electronic cursor on the CT console. The cursor measurement is limited by pixel size, which ranges from 0.6 to 0.8 mm on routine scans. The micrometer meas -urement is visually limited by the magnification of the individual pixel
element, but should be equal, or perhaps even greater, in accuracy. Since no difference in the measurements was observed, only microm-eter measurements were used for this study.
The data were then tabulated and analyzed by computer. The absolute PS and BA diameters as well as the ratio of the PS diameter to the BA diameter were calculated. This was done for two popula-tions. The first consisted of the total group of 1005 scans including
all slice thicknesses and levels as well as poorly demonstrated stalks. The second was a "pure" group consisting of 659 10-mm-thick midstalk-Ievel scans. Curves for the PS diameter, BA diameter, and PS diameter to BA diameter ratio for both groups were then
calcu-lated. Intergroup comparisons were made using the Student paired t test, analysis of variance techniques, and multiple comparisons using the Duncan method.
Results
The overall population statistics are presented in tables 1-4. There were 1005 normal scans in 990 patients aged newborn to 18 years. Of these, 53% were boys and 47% were girls. Of the 1005 scans, 910 were made with 10 mm slice thickness.
There was adequate demonstration of the PS on 87% of the scans, poor demonstration in 6%, and the stalks were not measurable in 7%. The poor or nondemonstrated stalks usually resulted from suboptimal 1 0 mm slice location in a patient population that was not, in general, scanned with specific attention to the pituitary. In the group of adequately demonstrated stalks, the scanning plane was through the midstalk in 86%. In 11 %, the scan was believed to be high
stalk. P = pituitary gland: S = sphenoid sinus.
AJNR:6, Sept/Oct 1985 PITUITARY STALK SIZE IN CHILDREN 735
TABLE 1: Pituitary Measurements in Total Population of Normal TABLE 3: Pituitary Measurements in Total Population of Normal
Boys Aged 0-19 Years Girls Aged 0-19 Years
Minimum Mean Diameter in mm (SD) Mean Minimum Mean Diameter in mm (SD) Mean Age
No. Stalk/Basilar Age No. Stalk/Basilar
(months)
(n ~ 1005) Pituitary Stalk Basilar Artery Ratio (months) (n ~ 1005) Pituitary Stalk Basilar Artery Ratio
(SD) (SD)
0-6 15 1.9 (0.31) 2.7 (0.65) 0.73 (0.18) 0-6 12 2.0 (0.43) 2.6 (0.42) 0.76 (0.09)
7-12 13 2.0 (0.39) 3.4 (0.52) 0.59 (0.12) 7-12 12 1.8 (0.31) 3.3 (0.41) 0.57 (0.12)
13-24 49 2.0 (0.32) 3.5 (0.56) 0.57 (0.12) 13-24 49 2.1 (0.43) 3.5 (0.60) 0.61 (0.13)
25-36 33 1.9 (0.35) 3.8 (0.55) 0.51 (0.11) 25-36 36 2.0 (0.32) 3.6 (0.67) 0.58 (0.14)
37-48 31 2.1 (0.50) 3.7 (0.50) 0.58 (0.14) 37-48 35 2.0 (0.44) 3.6 (0.47) 0.58 (0.12)
49-60 26 2.1 (0.39) 3.8 (0.58) 0.56 (0.15) 49-60 25 2.1 (0.41) 3.5 (0.57) 0.61 (0.18)
61-72 26 2.2 (0.39) 3.9 (0.45) 0.56 (0.13) 61-72 33 2.2 (0.47) 3.7 (0.50) 0.60 (0.18)
73-84 34 2.2 (0.32) 3.7 (0.44) 0.59 (0.11) 73-84 31 2.2 (0.45) 3.7 (0.58) 0.61 (0.12)
85-96 37 2.2 (0.41) 3.8 (0.50) 0.58 (0.14) 85-96 29 2.3 (0.63) 3.6 (0.46) 0.63 (0.14)
97-108. 45 2.3 (0.38) 3.9 (0.58) 0.59 (0.13) 97-108. 30 2.4 (0.50) 3.9 (0.48) 0.61 (0.16)
109-120. 30 2.4 (0.46) 3.9 (0.55) 0.65 (0.24) 109-120. 14 2.6 (0.66) 3.4 (0.45) 0.75 (0.18)
121-132. 30 2.4 (0.56) 3.9 (0.54) 0.65 (0.21) 121-132. 18 2.4 (0.38) 3.7 (0.50) 0.64 (0.14)
133-144. 24 2.5 (0.61) 3.9 (0.55) 0.65 (0.18) 133-144. 24 2.7 (0.50) 3.6 (0.54) 0.74 (0.15)
145-156. 27 2.5 (0.46) 3.6 (0.60) 0.67 (0.15) 145-156. 24 2.8 (0.54) 3.6 (0.34) 0.78 (0.19)
157-168. 16 2.4 (0.57) 3.7 (0.46) 0.64 (0.13) 157-168. 14 2.6 (0.55) 3.7 (0.46) 0.70 (0.10)
169-180 .. 16 2.5 (0.53) 3.4 (0.54) 0.72 (0.13) 169-180 .. 13 2.6 (0.75) 3.3 (0.51) 0.78 (0.23)
181-192 ... 15 2.9 (0.72) 3.5 (0.55) 0.83 (0.20) 181-192. 19 2.7 (0.57) 3.5 (0.60) 0.78 (0.20)
193-204 .. 15 2.5 (0.54) 3.6 (0.40) 0.72 (0.17) 193-204. 5 2.8 (0.52) 3.3 (0.57) 0.82 (0.11)
205-216. 3 2.3 (0.50) 3.6 (0.05) 0.64 (0.13) 205-216. 9 2.8 (0.58) 3.5 (0.57) 0.81 (0.16)
217-228. 3 2.6 (0.66) 3.2 (0.25) 0.79 (0.23) 217-228. 5 2.6 (0.60) 3.2 (0.35) 0.84 (0.19)
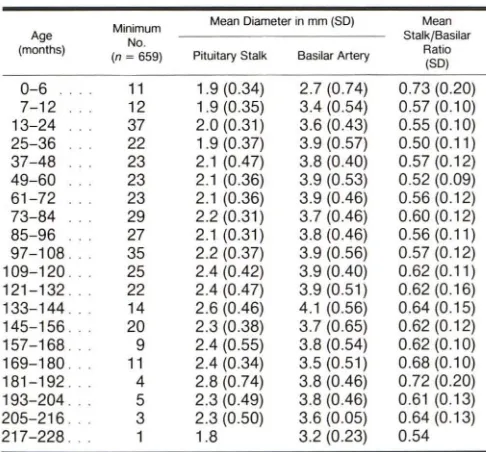
TABLE 2: Pituitary Measurements in "Pure" Population of TABLE 4: Pituitary Measurements in "Pure" Population of
Normal Boys Aged 0-19 Years Normal Girls Aged 0-19 Years
Minimum Mean Diameter in mm (SD) Mean Minimum Mean Diameter in mm (SD) Mean
Age
No. Stalk/Basilar Age No. Stalk/Basilar
(months)
(n ~ 659) Pituitary Stalk Basilar Artery Ratio (months) (n = 659) Pituitary Stalk Basilar Artery Ratio
(SD) (SD)
0-6 11 1.9 (0.34) 2.7 (0.74) 0.73 (0.20) 0-6 8 1.9(0.41) 2.5 (0.47) 0.74 (0.09)
7-12 12 1.9 (0.35) 3.4 (0.54) 0.57 (0.10) 7-12 9 1.8 (0.34) 3.3 (0.47) 0.57 (0.13)
13-24 37 2.0 (0.31) 3.6 (0.43) 0.55 (0.10) 13-24 37 2.1 (0.42) 3.5 (0.56) 0.59 (0.11)
25-36 22 1.9 (0.37) 3.9 (0.57) 0.50(0.11) 25-36 30 2.0 (0.31) 3.6 (0.66) 0.57 (0.15)
37-48 23 2.1 (0.47) 3.8 (0.40) 0.57 (0.12) 37-48 28 2.0 (0.40) 3.5 (0.44) 0.58(0.11)
49-60 23 2.1 (0.36) 3.9 (0.53) 0.52 (0.09) 49-60 17 2.0 (0.31) 3.6 (0.63) 0.60 (0.16)
61-72 23 2.1 (0.36) 3.9 (0.46) 0.56 (0.12) 61-72 22 2.2 (0.48) 3.7 (0.47) 0.60 (0.18)
73-84 29 2.2 (0.31) 3.7 (0.46) 0.60 (0.12) 73-84 24 2.2 (0.33) 3.5 (0.52) 0.62 (0.09)
85-96 27 2.1 (0.31) 3.8 (0.46) 0.56(0.11) 85-96 19 2.2 (0.52) 3.7 (0.51) 0.61 (0.10)
97-108. 35 2.2 (0.37) 3.9 (0.56) 0.57 (0.12) 97-108. 20 2.2 (0.45) 3.9 (0.53) 0.57 (0.15)
109-120. 25 2.4 (0.42) 3.9 (0.40) 0.62(0.11) 109-120. 9 2.4 (0.57) 3.5 (0.53) 0.69 (0.13)
121-132 .. 22 2.4 (0.47) 3.9 (0.51) 0.62 (0.16) 121-132. 11 2.2 (0.28) 3.6 (0.50) 0.60 (0.09)
133-144. 14 2.6 (0.46) 4.1 (0.56) 0.64 (0.15) 133-144. 15 2.5 (0.39) 3.7 (0.51) 0.68 (0.08)
145-156. 20 2.3 (0.38) 3.7 (0.65) 0.62 (0.12) 145-156. 13 2.8 (0.50) 3.5 (0.30) 0.80 (0.17)
157-168. 9 2.4 (0.55) 3.8 (0.54) 0.62 (0.10) 157-168. 10 2.6 (0.49) 3.7 (0.49) 0.70 (0.10)
169-180. 11 2.4 (0.34) 3.5(0.51) 0.68 (0.10) 169-180. 5 2.5 (0.63) 3.2 (0.69) 0.73 (0.10)
181-192. 4 2.8 (0.74) 3.8 (0.46) 0.72 (0.20) 181-192. 10 2.7 (0.68) 3.6 (0.71) 0.74 (0.21)
193-204. 5 2.3 (0.49) 3.8 (0.46) 0.61 (0.13) 193-204 .. 1 2.7 3.4 (0.54) 0.64
205-216 .. 3 2.3 (0.50) 3.6 (0.05) 0.64 (0.13) 205-216. 4 3.0 (0.82) 3.8 (0.59) 0.79 (0.21)
217-228. 1 1.8 3.2 (0.23) 0.54 217-228. 3 2.4 (0.32) 3.1 (0.47) 0.79 (0.18)
near the hypothalamus. In 3%, it was low in the sella turcica diameter ratio. Therefore, we believe that our results are
near the pituitary gland. applicable to both 5 and 10 mm slice thicknesses.
The BA was adequately demonstrated in 96% of the scans.
It was poorly demonstrated or not measurable in only 4%. Group Means This was usually because of a poor contrast bolus or failure
to resolve the BA closely applied to the clivus at the window For the total population of 1005 scans, the mean PS
and level settings photographed. diameter was 2.3 ± 0.5 mm, the mean BA diameter 3.6 ± 0.6
[image:3.615.55.298.106.331.2] [image:3.615.314.558.107.346.2] [image:3.615.54.297.376.602.2] [image:3.615.315.555.378.602.2]736 SEIDEL ET AL. AJNR:6, Sept/Oct 1985
30
2.9
2.8 2.7
2.6
E 2.5 E 2.4
2.3
2.2
2. I
2.0
1.9
1.8 .1 ,
,
,0 2 4
A
Pllullary Sialk Size (n 1005)
! ,
6 8 10 12 14
Age (years)
16 o Female • Male
18 20 E E
B
1.7 1.6 1.5Piluilary Stalk Size (N=659)
o Female
• Male
1
,
0
mm SliceI
LO~~2~~4~~6~~8--~1~0~~12~~14~~16~~'8~~2~0
Age (years)
Fig. 5.- PS size. In both total population (A) and "pure" population (8), PS size increases with advancing age for boys and girls.
4.1 4.0 3.9 3.8 3.7 3.6 3.5 E 3.4 E
3.3 3.2 3.1 3.0 2.9 2.8 2.7 2.6 2.5 0
A
Basilar Arlery Size (N = 1005)
4 6 8 10 12 Age (years)
14 16 o Female • Male
18 20
Basitar Artery Size (N-659) 4.0
3.0
3.6
3.4
E 3.2 E
3.0
o Female 2.8
• Male 2.6
2.4
10 mm Slicel
2.2
0 2 4 6 8 10 12 14 16 18 20
Age (years)
B
Fig. 6.- SA size. In both total population (A) and "pure" population (8) basilar artery is slightly greater in boys than in girls.
mm, BA diameter = 3.7 ± 0.6 mm, and PSjBA ratio
= 0.60
± 0.14. Nevertheless, we analyzed the data for the two groups separately and noted some differences.PS Size
There was a significant correlation between the PS diame-ter and age throughout childhood (p
<
0.001), with a general increase with advancing age for both boys and girls (fig. 5).There was no significant difference in the PS diameter be-tween boys and girls younger than 8 (p = 0.65). However,
between 8 and 18 years, girls had a larger mean PS diameter (2.6 mm) than boys (2.45 mm) (p = 0.02). In girls, a relatively
rapid increase in PS diameter began after age 8. In boys, the increase was delayed to 12 years of age with a sharp and unexplained peak noted at age 15. This difference was pres-ent in both the total and "pure" 10 mm population groups.
BA
SizeAJNR:6, Sept/Oct 1985 PITUITARY STALK SIZE IN CHILDREN 737
.84
.81
.78
.75
.72
.69
.!e iii .66 a:
.63
.60
.57
.54
.51
.48
0 2
A
4
Pituitary Stalk Ratio (n ~1005) Basilar Artery
6 8 10 12 14
Age (years)
I
o Female
• Male
16 18 20
78
.75
.72
.69
.66
2 .63
'"
a: .60
57
54
5 1 48
45
B
0 4
Pituitary Stalk
Basilar Artery
6 8
Rallos (N~ 659)
o Female
• Male
1
'0
mm slice!10 12 14 16 18 20
Age (years)
Fig. 7.-PS to SA ratio. In both total population (A) and "pure" population (8) ratio increases with age and is slightly larger in girls than in boys.
PS/BA Ratio
The PS diameter to BA diameter ratio correlated with both age (p = 0.0001) and gender (p
<
0.02). The ratio was larger in girls than in boys throughout childhood, although the dif-ferences were greater after age 8 (fig. 7). Wide oscillations in the curves during adolescence may reflect the sample size and the variable age of onset of puberty among individuals of the same gender. The "pure" 10 mm group showed an increased ratio in children less than 1 year of age. Neverthe-less, their PS diameter was not unusually large, nor was their BA diameter unusually small. The 10 mm population also demonstrated an apparent decline in stalk size and ratio in17- and 18-year-old boys, although the sample size in this age group was quite small (n = 3).
Ratios> 1.0
In 45 cases, the PS diameter to BA diameter ratio was greater than or equal to 1 in the "normal" population. Of these 45 cases, only 18 had ratios greater than 1, and 14 of these were in the older age group. It is important to remember that certain factors may artifactually increase this ratio. The PS diameter will be large if the stalk size is at the upper limits of
normal or if it is measured at a scan level too high or too low. On the other hand, the BA diameter will be small if it is an anatomic variant or if there is a poor contrast bolus. All of these will result in an increased ratio even if the absolute stalk size is within normal limits.
To eliminate such artifactually "elevated" ratios, we further
selected those cases with PS to BA diameter ratios greater than or equal to 1 and with PS diameters greater than 2 SD above age-matched group means. From our total population of 1005 scans and our subgroup of 45 scans with ratios greater than or equal to 1, only 12 scans (1 %) remained. Most of these patients were 8-18 years old, ages when relatively large PSs and PS to BA ratios are more common. Our total
population was selected from scans prospectively interpreted as normal. While in retrospect most of these 12 scans seem suspicious and would now prompt further evaluation, none of the patients are known to be abnormal at this time. Thus, the application of these two measurements has resulted in a very small subset of patients whose scans deserve careful consid-eration before being declared normal, especially in patients under 8 years of age.
Discussion
We have developed standards for PS diameter and BA diameter, as well as their ratio, for both age and gender.
There is a predictable relation between boys and girls
through-out childhood. In general, the data curves are more variable in adolescents, especially after the expected onset of puberty. Overall, girls do have larger stalks than boys, but only during adolescence. This increase in size of the PS and pituitary gland is hypothesized to relate to the endocrine events of puberty [4].
Many pathologic states have been shown to produce
en-largement of the PS and/or pituitary gland [7, 8] including diabetes insipidus due to histiocytosis X [9] and other causes
[9-11]; pituitary adenoma [12, 13]; hypothalamic lesions in-cluding glioma and neuroepithelial tumors (dermoid, teratoma,
dysgerminoma, and hamartoma) [14, 15]; Rathke cleft cyst [16]; metastases [17]; sarcoidosis [18, 19]; hypothyroidism [20-22]; and infection [23]. Discussion of the pathologic
causes of PS enlargement in children is beyond the scope of
this report.
Peyster et al. [1] recently reported a similar approach to
screening for abnormal PS size. They recommended direct
measurement of the PS if its size was larger than the BA by
visual inspection. Their data were not grouped for age or gender. The sample size for children was very small and the
73B SEIDEL ET AL. AJNR:6, Sept/Oct 1985
A
B
Fig. 8.-Recognition of abnormal PS using PS/BA ratio. A, PS/BA ratio = 1.0 (measure PS diameter). B, PS/BA ratio> 1.0 (PS diameter> 2 SO above age-matched mean). PS diameter (open arrows); BA diameter (closed arrows).
surprising that they did not make the observations that we report here. However, their mean PS and BA values correlate well with those of our older patients.
The PS to BA ratio is an easily applied visual screening tool that enables ready recognition of the possibly abnormal stalk. If the ratio appears close to 1.0, further evaluation should
include direct measurement of the stalk diameter (fig. BA). We
have reported values for 10 mm slice thickness and have
shown no difference with 5 mm slice thickness. However, if
the scanning plane is not ideal, additional thin slices may be
of benefit. If the direct measurement of the PS diameter falls
within 2 SD of our standards, it is likely normal; 99% of normal
children will fall within this range. However, stalks greater
than 2 SD should be viewed with suspicion, and further clinical
evaluation and a follow-up scan are recommended (fig. BB).
Coronal imaging is the scanning plane of choice for
inves-tigating the pituitary gland. However, the stalk is a vertically
oriented structure; thus, coronal imaging is not ideal for its
evaluation and measurement. Although the PS may be
dem-onstrated on coronal images, we believe that its measurement
and comparison with BA size are best made in the axial plane. On reevaluation of our index case (fig. 1), it is obvious that
the PS to BA ratio is greater than 1. With our present knowledge, careful measurement of the PS and early follow-up would have been performed. Such measurements should have permitted earlier diagnosis of this tumor. In fact, our failure to properly diagnose this lesion prompted this study.
It is hoped that application of our standards may prevent another unfortunate false-negative.
ACKNOWLEDGMENTS
We thank R. Shukla and C. R. Buncher for advice and statistical
analysis, Richard Isham for photography, and Sherrie Henslee and Elverna Murray for manuscript preparation.
REFERENCES
1. Peyster RG, Hoover ED, Adler LP. CT of the normal pituitary
stalk. AJNR 1984;5:45-47
2. Syvertsen A, Haughton VM, Williams AL, Cusick JF. The
com-puted tomographic appearance of the normal pituitary gland and
pituitary microadenomas. Radiology 1979; 133: 385-391
3. Roppolo HMN, Latchaw RE, Meyer JD, Curtin HD. Normal
pituitary gland: 1. Macroscopic anatomv-CT correlation. AJNR
1983: 4:927-935
4. Peyster RG, Hoover ED, Viscarello RR, Moshang T, Haskin ME.
CT appearance of the adolescent and preadolescent pituitary
gland. AJNR 1983;4:411-414
5. Aubin ML, Bentson J, Vignaud J. CT of the pituitary stalk. J
Neuroradiology 1978;5: 153-160
6. Brown SB, Irwin KM, Enzmann DR. CT characteristics of the
normal pituitary gland. Neuroradiology 1983;24:259-262
7. Peyster RG, Hoover ED. CT of the abnormal pituitary stalk. AJNR 1984;5: 49-52
8. Pang 0, Rosenbaum AE, Wilberger JE Jr, Gutai JP. Metrizamide
computed tomographic cisternography for the diagnosis of occult
lesions of the hypothalamic-hypophyseal axis in children.
Neu-rosurgery 1981;8: 531-541
9. Sims DG. Histiocytosis X: a follow-up of 43 cases. Arch Dis Child
1977;52: 433-440
10. Manelfe C, Louvet JP, Boulard C, Regnier C, Rochiccioli P,
Bayard F. Hypothalamic-pituitary changes in diabetes insipidus
demonstrated by computerized tomography (letter). Lancet
1978;2: 1379-1380
11. Manelfe C, Louvet JP. Computed tomography in diabetes
insipidus. J Comput Assist Tomogr 1979;3:309-316
12. Eresue J, Drouillard J, Philippe JC, Guibert JL, Roux PH,
Taver-nier J. Evaluation of pituitary adenoma by high resolution and
dynamic CT. Ann Radial (Paris) 1982;25:509-517
13. Gardeur 0, Naidich TP, Metzger J. CT analysis of intrasellar
pituitary adenomas with emphasis on patterns of contrast
en-hancement. Neuroradiology 1981 ;20: 241-247
14. Mori K, Handa H, Takeuchi J, Hanakita J, Nakano Y.
Hypotha-lamic hamartoma. J Comput Assist Tomogr 1981;5:519-521 15. Judge OM, Kulin HE, Page R, Santen R, Trapukdi S.
Hypotha-lamic hamartoma: a source of luteinizing-hormone releasing
fac-tor in precocious puberty. N Engl J Med 1977;296:7-10
16. Martinez LJ, Osterholm JL, Berry RG, Lee KF, Schatz NJ.
Transsphenoidal removal of a Rathke's cleft cyst. Neurosurgery
1979;4: 63-65
17. Duchen LW. Metastatic carcinoma in the pituitary gland and
hypothalamus. J Patho/1966;91 :347-355
18. Winnacker JL, Becker KL, Katz S. Endocrine aspects of
sarcoid-osis. N Engl J Med 1968;278:483-492
19. Decker RE, Mardayat M, Marc J, Rascol A. Neurosarcoidosis with computerized tomographic visualization and transsphe-noidal excision of a supra- and intrasellar granuloma. J Neurosurg
1979;50:814-816
20. Silver BJ, Kyner JL, Dick AR, Chang CH. Primary hypothyroidism.
Suprasellar pituitary enlargement and regression on computed
tomographic scanning. JAMA 1981;246:364-365
21. Gup RS, Sheeler LR, Maeder MC, Tew JM Jr. Pituitary
enlarge-ment and primary hypothyroidism: a report of two cases with
sharply contrasting outcomes. Neurosurgery 1982;11 :792-794
22. Okuno T, Sudo M, Momoi T, et al. Pituitary hyperplasia due to
hypothyroidism. J Comput Assist Tomogr 1980;4:600-602
23. Enzmann DR, Sieling RJ. CT of pituitary abscess. AJNR