Printed in Great Britain © The Company of Biologists Limited 1992
THE INFLUENCE OF TEMPERATURE ON MUSCLE
FUNCTION IN THE FAST SWIMMING SCUP
II. THE MECHANICS OF RED MUSCLE
BY LAWRENCE C. ROME, ANDRZEJ SOSNICKI AND IN-HO CHOI
Department of Biology, University of Pennsylvania, Philadelphia, PA 19104, USA
Accepted 19 September 1991
Summary
To understand better how scup can swim twice as fast as carp with its red muscle, we measured the mechanical properties of red muscle bundles in scup. The values of the mean maximum velocity of shortening (Vmax) at 10°C
(3.32musclelengthss~') and at 20°C (5.55 muscle lengths s"1; Q10=1.69) were
nearly the same as those in carp. Isometric force, however, was approximately 50% greater (183kNm~2; Qlo=1.08). The maximal power generation was
correspondingly about 50% greater in scup than in carp (71Wkg- 1 at 10 °C and
134Wkg~' at 20°C; Q1O=1.88). The larger power output of its muscle may be
important in the faster swimming of the scup. In addition, the fact that scup use a less undulatory style of swimming means that, when they are swimming twice as fast, their red muscle shortens at the same velocity (V) and with the same V/Vmax
(0.37, i.e. where maximum power is generated) as that of carp.
The importance of V/Vmax is further shown by the comparison of scup swimming at different temperatures. The 1.69-fold higher Vmax at 20°C than at
10°C enables scup to swim with a 1.67-fold faster V at 20°C. Thus, at both 10°C and 20°C, red muscle is used only over the same narrow range of V/Vmax
(0.17-0.37), where experiments on isolated muscle suggest that power and efficiency are maximal. Therefore, V/Vmax appears to be an important design constraint that limits the range of velocities over which muscle is used in vivo, both at different temperatures and in fast- and slow-locomoting species.
Introduction
Some animals move slowly while others move rapidly. It is generally thought that faster animals have faster muscles. In the previous paper (Rome etal. 1992) we showed that scup can swim approximately twice as fast with their red (slow oxidative) muscle as can carp. From these results alone, we might expect that the maximum velocity of shortening (Vmax) of the scup muscle would be
approxi-mately twice as fast as that of carp muscle.
282 L. C. ROME, A. SOSNICKI AND I.-H. CHOI
style of swimming, the highest V (velocity of muscle shortening during loco-motion) at which the red muscle is used during swimming is the same in both carp and scup (Rome et al. 1992). If animals use their muscles over the same range of ^/^max (0.2-0.4) as suggested by Rome and colleagues (Rome etal. 1988, 1990a,b; Rome and Sosnicki, 1990), then we would expect Vmax of the scup and carp to be nearly the same.
In this paper we measure the influence of temperature on Vmax and power production in scup and compare these results with those for carp. This gives us the opportunity to evaluate the adaptations necessary for some species to swim rapidly and to explore further the importance of V/Vmax as a design constraint of muscular systems.
Materials and methods
The muscle mechanics apparatus and the techniques for dissection, mounting, muscle mechanics, histology and histochemistry have been previously described in detail for carp (Rome and Sosnicki, 1990). The apparatus and techniques are described only briefly here, except where some important modifications have been made.
Preparation
Scup (Stenotomus chrysops L.), 19-23cm long, were killed with a blow to the head and the scales were scraped off. Unlike carp, there was sufficient fat between the skin and muscle so that the skin could be removed without damaging the preparation. Bundles of about 200 fibres (approximately 0.5 mm thick) were removed from above the midline of the fish at the level of the dorsal fin, dissected at 4°C under a stereomicroscope, and tied to the servomotor arm and force transducer, as in Rome and Sosnicki (1990).
Solutions
Dissection was carried out in a Ringer's solution containing (mmoll"1): NaCl, 132; KC1, 2.6; CaCl2, 2.7; imidazole, 10; sodium pyruvate, 10; MgCl2, 1; pH7.7 at 15 °C, based on Altringham and Johnston (1990). Force-velocity experiments were carried out in this Ringer's solution containing l m m o l F1 caffeine and 10~5gml~1 eserine, which results in a high level of activation of the muscle bundle (see Results).
Experimental apparatus
running the full length of the bundle. All force and length signals were recorded and stored using a Nicolet 4094 digital oscilloscope.
Measurement of Vmax of red bundles
Vmax was approximated by extrapolating the force-velocity curve (determined from force clamps) to zero load. A hyperbola was fitted to the data for loads between about 0.05P0 and 0.8P0» where Po is isometric tension (Rome and Sosnicki, 1990).
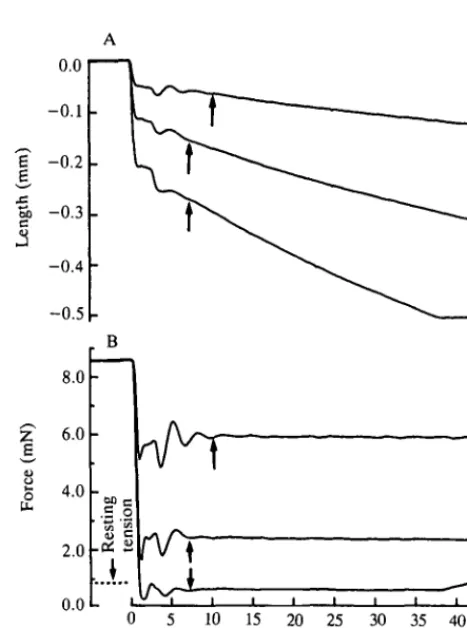
At low loads, length changes were measured over a 5 ms period starting about 7 ms after the release. At higher loads, length changes were measured over a longer period (up to 70 ms) to permit a significant length change. Measurements in this case started about 10ms following release.
Protocol
The experiments were started at a length corresponding to a sarcomere length of 2.10±0.02,um (±s.E., N=8), as measured in the bundles after fixation (up to 6% shrinkage may have occurred during fixation; Rome and Sosnicki, 1991). The temperature was set at either 10°C or 20°C, and the force-velocity curve was determined. The muscle was stimulated every 90s [100 pulses per second (pulsess"1) for 450ms at 10°C and 200pulsess"1 for 300ms at 20°C]. Sarcomere length and fibre length were measured from Epon-embedded sections following the mechanics experiments.
Measurement of active cross section and determination of fibre types
In another set of bundles, we measured the force generated per cross section of muscle fibre and determined the fibre type. The bundles were embedded in gelatin, frozen and sectioned as in Rome and Sosnicki (1990). To differentiate the cross-sectional area occupied by the muscle fibres from that of fatty and connective tissue, sections were processed for routine haematoxylin and eosin (H & E) and modified Gomori-trichrome staining. The cross-sectional area of the red muscle bundles was measured using a digitizing tablet. To determine whether the bundle was homogeneous in fibre type, histochemical reactions for myosin Ca2+-ATPase and succinic dehydrogenase (SDH) were performed as in Rome and Sosnicki (1990).
Results
Because the scup red muscle bundles behaved similarly to those of carp, we used the types of analyses described previously (Rome and Sosnicki, 1990).
Morphology of red muscle bundle
284 L. C. ROME, A. SOSNICKI AND I.-H. CHOI
E and Gomori-trichrome staining of frozen cross sections showed a large amount of connective and fatty tissue among the red muscle fibres. Only about 43±3%
( ± S . E . , N—5) of the cross section was occupied by the muscle fibres. The red
muscle also had a large amount of fatty tissue located beneath the skin, around the connective tissue that forms the myosepta and between the muscle fibres. The fatty and connective tissue, which forms a structural matrix for the muscle fibres, may protect the red muscle because it can be forced to undergo large strains when the white muscle is active (Rome and Sosnicki, 1990, 1991). The length of the red muscle bundles and their fibres, measured from semi-thin Epon-embedded longitudinal sections, varied between 3.2 and 4.8 mm when normalized to a sarcomere length of 2.10 ^m (the sarcomere length of unfixed red muscle in a straight fish).
The histochemical reactions performed on the cross sections of the muscle bundles showed that they contained only the red (slow) muscle fibre type. Thus, routine myosin Ca2+-ATPase reaction after the alkaline preincubation at pH9.4 (inhibition of the slow fibre type) showed no activity. After acid preincubation at pH4.5 (inhibition of the fast fibre types), every muscle fibre within the bundle had a uniform dark staining intensity. The high SDH reaction rate observed in every muscle fibre is indicative of a dense distribution of intermyonbrillar mitochondria, typical for a slow fibre type with a high oxidative capacity.
Activation of the red bundle
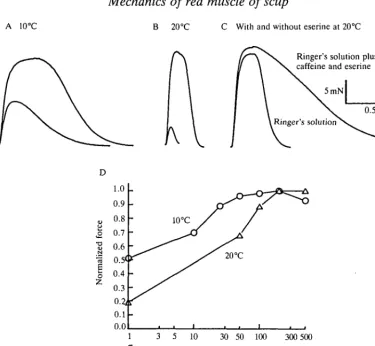
At 20°C, the bundle could be well activated by high-frequency stimulation. Fig. ID shows that nearly maximal tension is achieved at approximately 200 pulses s~\ On average, the ratio of force generated at 500 pulses s~J to that generated at 200pulsess"1 was 1.04. As Fig. 1B,D shows, there was significant reduction in force at lower stimulation frequencies and the twitch-tetanus ratio was low (0.16±0.02, S.E., N-5). The observation that force generation could be abolished by the addition of 10~6moll- 1 curare suggested that the fibres were being indirectly activated by acetylcholine (ACh) released from the nervous tissue contained within the bundle. As in Rome and Sosnicki (1990), we reasoned that the effectiveness of ACh might be improved by use of 1 mmol I"1 caffeine (a twitch potentiator) and eserine (an acetylcholinesterase inhibitor). Addition of these compounds did result in a small, but significant, increase in force generation (Fig. 1C). On average, force generation in plain Ringer was 0.88±0.03 ( ± S . E . ,
iV=7) of that generated in Ringer containing eserine and caffeine. The effect of eserine was saturable. It was maximal between 5 and lOjiigml"1 and increased amounts did not cause an increase in force generation. In fact, force generation in bundles exposed to high eserine concentrations appeared to decline rapidly. The force per cross-sectional area of muscle fibre (determined from frozen sections) during stimulation in caffeine and eserine was 183±31kNm~2 ( ± S . E . , 7V=5).
A 10°C B 20 °C C With and without eserine at 20°C
Ringer's solution plus caffeine and eserine
5mN
0.5 s
D
•a
8
o
[image:5.477.41.416.57.402.2]3 5 10 30 50 100 300 500 Stimulation frequency (pulses s~')
Fig. 1. Force-frequency relationship of scup muscle. (A,B) A twitch and a tetanus in normal Ringer of a scup red muscle bundle at 10°C and 20°C, respectively. (C) Tetani at 20 °C in both normal Ringer and Ringer containing caffeine (1 mmol I"1) and eserine
(10~5gml~'). Note that force is slightly greater, but relaxation time is greatly
prolonged. (D) Normalized force as a function of stimulation frequency (note logarithmic scale) at 10°C and 20°C. Tetani in A-C were performed at 200 pulses s"1.
level of activation. For instance, at 10pulsess 1, generated at 200pulsess"1 (Fig. ID).
the force was 70% of that
Mechanics of red muscle bundles
Seven to fourteen data points were used to generate the force-velocity curve at each temperature. More contractions (15-25) were actually performed, but many had to be discarded because of inappropriate servo gain. The preparation, however, was extremely stable. The ratio of Po generated at the beginning of a run to that at the end showed complete stability at both temperatures (1.015±0.025,
N=4 at 10°C and 1.016±0.007, N=5 at 20°C). The length records showed some
286 L. C. ROME, A. SOSNICKI AND I.-H. CHOI
A 0.0
-0.1
"? -0.2
j
-0.4
-0.5
z 8.0
6.0
S 4.0
2.0
0.0 00 c
•S .2
0 5 10 15 20 25 30 35 40 45
[image:6.470.104.338.63.377.2]Time (ms)
Fig. 2. Force clamps in a red muscle bundle. Length (A) and force (B) records are shown for three force clamps at heavy, moderate and light loads. The bundle was released 210 ms into the contraction after steady isometric force had been reached. The arrows signify the beginning of the measurement period. The resting tension shown on the force record is that measured at the initial length. At the muscle length at which the lightest load was clamped, the passive tension was about one-tenth of that shown. The bundle length at a sarcomere length of 2.10(Um was 3.25 mm.
shortening deactivation. In addition, as the muscle shortened, the resting force decreased, thereby increasing the active load that had to be maintained. To minimize these effects, we measured the initial velocity immediately following the stabilization of force (denoted by the arrows in Fig. 2; see Materials and methods). Force-velocity curves were well-fitted by a hyperbola not constrained to pass through Po=l (Fig. 3). At zero velocity, the unconstrained curves extrapolated to the load axis (Po) at values greater than 1. At 10°C, Po was 1.47±0.12 ( ± S . E . ,
N=8) and at 20°C Pg was 1.57±0.13 ( ± S . E . , N=8).
The influence of temperature on the mechanics of red muscle bundles
1.2
1.0
S? 0.8
"Z 0.6
I 0.4 0.2 0.0
[image:7.541.24.433.79.217.2]Velocity (MLs"1)
Fig. 3. The influence of temperature on the mechanics of red muscle bundles. The mechanical power and force generation are shown as a function of shortening velocity for a red muscle bundle at 10°C ( • ) and 20°C (A). At 10cC, Vmax (maximum velocity
of shortening)=3.16MLs~' (muscle lengths s"1), a/P^Hill constant) =0.36 and P$ (extrapolated load at zero velocity)=1.11, whereas at 20°C, Vmax=5.24MLs~1,
a/P(f=0.32 and P5=1.24. t2 was 0.99 at both temperatures. The curve for power is calculated from the force-velocity curve. Isometric force was 8.5 mN at 10°C and 9.7 mN at 20°C. Bundle length at a sarcomere length of 2.10/im was 3.88 mm.
illustrated by a/Pg and WmaJ(Pox Vmax) values of 0.25±0.04 ( ± S . E . , 7V=8) and 0.128±0.005 (±s.E., N=8), respectively, at 10°C and0.25±0.01 ( ± S . E . , N=8) and
0.132±0.005 ( ± S . E . , N=8), respectively, at 20°C.
The mean Q10 for Po was 1.08. Based on the 183kNm~2 value at 20°C, this would give a Po value of 169kNm~2 at 10°C. The mean Q10 for maximum power generated (Wmax) was 1.88.
We could not determine the Wm^kg"1 of the fibres directly (see Rome and Sosnicki, 1990). Instead, we obtained Wm^kg'1 of the fibres by multiplying the mean (P/Pox V)max determined for one group of bundles (nos 1-8; Table 1) by the
(P0)/m2 (isometric force) determined on another group (nos 9-13), as in Rome and Sosnicki (1990). The Wm^kg'1 of the fibres at 10°C was 70.9±8.1 ( ± S . E . ,
7V=8) and at 20°C it was 134±13 ( ± S . E . , N=8).
Discussion
Activation of scup red muscle
Bundl
e
1 2 3 4 5 6 7 8 Mea
n
S.E
.
Tabl
e
y r ma
x (^xlOO , A O 2.7 3 (99,7 ) 3.8 9 (99,11 ) 3.1 6 (99,9 ) 3.7 1 (99,9 ) 2. 6 (99,8 ) 3.5 4 (99,11 ) 3.5 9 (98,12 ) 3.3 4 (99,13 ) 3.3 2 0.1 6 1. Influence 10° C (P/P o xV) ma x 0.35 9 0.54 3 0.40 4 0.43 0 0.36 8 0.44 4 0.35 7 0.44 0 0.42 0 0.02 1 of temperature
v/v
max at W max ( 0.3 6 0.3 4 0.3 4 0.2 5 0.3 0 0.3 0 0.2 2 0.3 0 0.3 0 0.0 2 onthe y ' ma
x 4.8 3 (99,7 ) 6.3 2 (98,12 ) 5.2 4 (99,10 ) 5.5 5 (99,10 ) 5.2 5 (98,10 ) 5.3 3 (98,9 ) 4.9 7 (99,14 ) 6.9 1 (99,11 ) 5.5 5 0.2 5 mechanics of the 20° C A O (P/P o xV)m: 0.61 2 0.97 5 0.70 6 0.72 9 0.81 3 0.67 0 0.57 5 0.78 0 0.73 3 0.12 6 red muscle bundle
v/y
max at W max 0.3 5 0.2 7 0.3 3 0.2 9 0.3 4 0.2 9 0.2 8 0.2 3 0.3 0 0.0 4y v ma
x 1.7 7 1.6 2 1.6 6 1.5 0 2.0 2 1.5 0 1.3 8 2.0 7 1.6 9 0.0 8 Qi o
Po 1.10 1.02 1.15 1.08 1.09 1.06 1.12 1.04 1.08
0.0 1 "ma x 1.8 8 1.8 3 2.0 1 1.8 3 2.3 2 1.6 1 1.8 0 1.8 4 1.8 8 0.0 7
to oo oo (_ C J ^J O w oo o Z d I
X
o
V max value s ar e give n i n muscl e length s s ' a t a sarcomer e lengt h o f 2.10/im . (P/P o xK) m aX i s a normalize d inde x o f maximu m mechanica l powe r which , whe n multiplie d b y Pom"
2 o
f fibre
, give
s W
max
kg~
l o
The observation that such a high frequency was necessary at 20°C to generate the highest force suggests that the fibres are not capable of producing action potentials, but that they undergo junctional potentials (Rome and Sosnicki, 1990). The force-frequency relationship at 10°C, however, is fairly similar (high twitch-tetanus ratios, high force at relatively low frequencies) to those reported at low temperatures for other fish muscles that produce action potentials (Altr-ingham and Johnston, 1988; Curtin and Woledge, 1988). This response may be a result of the ACh from a single stimulation in scup being more effective than in carp (perhaps owing to differences in ACh release or breakdown).
Two lines of evidence suggest that our procedures resulted in a relatively high level of activation of the red bundles. First, the force-enhancing effect of eserine was saturable and neither increased stimulus strength nor higher stimulation frequency could increase force generation. Second, the value of 183kNm~2 at 20°C is larger than we observed in carp (Rome and Sosnicki, 1990) and larger than values found for other slow twitch muscles (150-160 kNm~2 in rat soleus at 20°C; Claflin and Faulkner, 1985; Ranatunga, 1984).
Mechanics of scup red bundles: influence of temperature and comparison with carp
We found that the force-velocity characteristics of the red muscle bundle of scup were similar in many respects to those of carp as well as those of other species. For instance, at high loads, velocities exceeded those predicted by a hyperbolic fit constrained to pass through PQ=1, as in frog fibres (Edman etal. 1976; Julian et al. 1986). Our extrapolated values of Pg of 1.48 at 10°C and 1.57 at 20°C agree well with those (1.2-1.5 ) previously determined for frog, carp and other fish (see Rome and Sosnicki, 1990).
The Vmax values obtained for scup were very similar to those of carp (3.55 MLs"1 at 10°C and 5.71 MLs"1 at 20°C; Rome and Sosnicki, 1990). Mechanical power output in the scup was considerably higher, however, because of the 50% higher force per cross-sectional area (183kNm~2 in scup vs 123kNirT2 in carp at 20°C).
The Q10 values found for the mechanical properties of the scup red muscle are similar to those found for other muscles. The Qio of force production is the same as that found for frog muscle between 10°C and 20°C (3.55 M L s "1 at 10°C and 5.71 MLs"1 at 20°C; Rome and Kushmerick, 1983). The Q10 for Vmax was very similar to that for carp. The Q] 0 for maximum power production is within the range of values previously reported between 10°C and 20cC (Bennett, 1984) but is considerably higher than that in carp. The reason is that carp, unlike scup, have a flatter force-velocity curve [as measured by Wmax/(Pox^max)] at low tempera-tures than at high ones. Scup have higher Wmax/(PoxVmax) values than the frog (see Rome and Sosnicki, 1990), for instance, and this may be important in enabling them to generate the requisite power to move rapidly.
How scup locomote with different muscle temperatures
290 L. C. ROME, A. SOSNICKI AND I.-H. CHOI
posterior positions of the scup, the velocity of shortening of the red muscle at a
given swimming speed is nearly the same at 10°C and 20°C. In this paper, we have
shown that the Vmax of colder muscle is lower, which means that for any given shortening velocity the force per cross-sectional area at 10 °C is lower than that at 20°C. Because fish's muscle must generate the same total power (forcex velocity) at a given swimming speed, their muscles must generate the same total force. Rome and co-workers proposed (Rome et al. 1984,1985; Rome, 1990) that the fish do this by recruiting more muscle fibres at lower temperatures (a mechanism termed 'compression of the recruitment order'). The quantitative electromyogra-phy (EMG) analysis in the previous paper (Rome et al. 1992) supports this theory as well. Thus, even though force per cross-sectional area is lower at 10°C, by recruiting more fibres, the fish's muscle can generate the same total force.
We can now attempt to quantify this relationship. The ratio of the number of fibres (or cross-sectional area) recruited at 10 °C to that at 20 °C would be the inverse of the ratio of force generation per cross-sectional area at 10°C to that at 20°C. This ratio depends on the velocity at which the muscle is shortening. At 10°C, 1.23 MLs"1 is the fastest at which the red muscle can shorten before the fish would start to recruit its white muscle (Rome et al. 1992). At this velocity (Fig. 4), the red muscle generates a force of 55.7±3.4kNm~2 ( ± S . E . , /V=8) (0.33P0). At 20°C, however, while shortening at 1.23MLs"1, the muscle generates a force of 110±7.7kNm~2 ( ± S . E . , N=8) (0.60P0)- Therefore, to generate the same total force, the fish at 10°C would have to recruit 1.97 times more fibre cross section than at 20°C. Although intriguing, this calculation should be viewed with some caution. First, it assumes that, during locomotion, the fibres are similarly activated
Fig. 4. Influence of temperature on mechanical properties of scup red muscle and on their use during swimming. This figure shows the average (see note below) force-velocity and power-force-velocity curves of scup red muscle at 10 °C (A) and 20 °C (B) (the dotted portions of the curves were not covered by these experiments and are fitted by eye based on previous results). As muscle shortening velocity during steady swimming was independent of temperature, we have placed the swimming speed axis on the graph as well (from Rome et al. 1992). Thus, during steady swimming, the curves provide the power, force and muscle shortening velocity as a function of swimming speed. The stippled regions represent the muscle shortening velocity during steady swimming with red muscle. The dotted vertical lines at each temperature represent transition swimming speeds at each temperature (see Rome et al. 1990a). At slower swimming speeds than that of the left-hand line, the scup use 'burst-and-coast' swimming with red muscle or use their pelvic fins. At higher swimming speeds than that of the right-hand line, the white muscle is recruited and the scup use burst-and-coast swimming. For each temperature, V/Vmax at the transition points is given. The curves were defined by the following coefficients based on the eight muscle bundles in Table 1: Vmax=3.32MLs"1, a/P$=0.25 and Pft=1.325 at 10°C and Vmox=5.55 MLs"1,
a/P§=0.24 and PJ=1.45 at 20°C. Note that the coefficients were chosen so that the
291
at both temperatures. Second, this value would be very different in regions of the fish in which the muscle is active during lengthening rather than shortening.
The value of 1.97 is considerably larger than the value of 1.53 calculated for carp (Rome and Sosnicki, 1990). The value in carp is smaller because at low temperatures carp muscle has flatter force-velocity curves than at high ones, thereby reducing the number of additional fibres required at low temperatures. In scup, the force-velocity curves are similarly curved at both temperatures.
V/Vm a v during swimming: comparison with carp and influence of temperature
Our previous studies on carp (Rome etal. 1988, 1990a; Rome and Sosnicki,
E Z
o S
200
180
160*
140
120
100
80
60
40
20
04
200
180'
160
140
120
100
80
60
40
20
0( 0
rj
r--O r--O II II
V
10X
-I—
o
20 54
H-4-o
II 20 °C
200
180 160
140 120
80
60 40
20 „
0 'M
180
160
140
120
100
80
60
40
20
0
2 3 4
Muscle velocity (MLs ')
30 80
Swimming speed (cms"1)
292 L. C. ROME, A. SOSNICKI AND I.-H. CHOI
1990) showed that they used their red and white muscle over a narrow range of V/Vmax values (0.17-0.36). Because scup can swim nearly twice as fast with their red muscle as carp, we anticipated that the maximum value of V (at which the red muscle was used) as well as Vmax would be twice those of carp, hence maintaining
V/Vmax. We found, however, that, because of a less undulatory style of swimming, as well as a smaller gear ratio (i.e. SL vs A/R), scup have the same V while swimming at 80 cm s~i as carp do swimming at 45 cm s~1 (Rome et al. 1992). In this study, we found that, rather than scaling with maximum swimming speed, Vmax scaled the same way as maximum V (i.e. it was nearly the same in scup as in carp). Hence, despite a twofold difference in swimming velocity, both scup and carp are designed to use their muscle over the same range of V/Vmax.
Thus, as seen in the comparison between scup and carp, fast muscle is not a necessary adaptation for fast locomotion. By modifying kinematics and biomech-anical elements, a large change in swimming performance can be achieved without a change in Vmax. Adopting a less undulatory type of movement might also be an effective technique for reducing drag. Drag appears to be further reduced in scup (compared to carp) by greater streamlining (e.g. folding fins within the body profile). From this study, we also know that one useful muscle adaptation is that scup muscle can generate about 50 % greater power per kilogram of fibre than carp muscle because of its larger force generation. Another possible adaptation would be a faster rate of activation and relaxation in scup than carp (i.e. its muscle has to operate at higher oscillatory frequencies; Altringham and Johnston, 1990), but this was not addressed in this study. It should be noted that, by not adopting these adaptations, carp can maintain steady swimming at lower swimming speeds than scup (i.e. 10 vs 20cms"1 at 10°C and 15 vs 30cms"1 at 20°C), which may be important to their lifestyle.
Muscle fibre recruitment within individual scup at different swimming tempera-tures is also set by V/Vmax. This is shown in Fig. 4. At both temperatures, scup use their red muscle only over the same narrow range of V/Vmax (0.17-0.37 at 20°C and 0.22-0.37 at 10°C). The 1.69-fold increase in Vmax at 20°C enables the scup to swim with a 1.67-fold higher maximum V (and thus with a 1.5-fold faster swimming speed).
V/Vm0A.; an important design constraint of muscle
that maximum efficiency is found at a lower V/Vmax (approximately 0.17) than is maximum power (approximately 0.33).
To achieve a full range of movements, animals recruit fibre types with different
Vmax values and different orientations so that the active fibres operate over the optimal range of values. By using a comparative approach, we have shown in three separate comparisons that fibres are used over the same narrow range of V/Vmax (0.17-0.37): first, in different fibre types within the same animal (carp; Rome et al. 1988); second, in one fibre type at different temperatures (carp; Rome and Sosnicki, 1990; Rome etal. 1990a, scup; this study); and third in the comparison between fast-swimming scup and slow-swimming carp.
In a fourth case, scaling within mammals, an examination of a size range from rats to horses suggests that muscle fibres are being used at the same V/Vmax (Rome
et al. 1990a). For technical reasons, however, we cannot determine precisely what
this value is. Thus, in very different situations, given the speed at which the animals locomote, they vary Vmax, fibre orientation and the kinematics of movement so that V/Vmax is maintained over the range of highest mechanical power output and efficiency.
Other design considerations
The data from this study provide further evidence that myofilament overlap is also an important design constraint. During steady sustainable swimming, scup use their red muscle exclusively. In the previous paper (Rome et al. 1992) we observed that the maximum sarcomere length excursion was 0.24 jum and this was centred around 2.10 ^m (i.e. 1.98-2.22 /im). If scup have the same myofilament lengths as carp (Sosnicki et al. 1991), this would suggest that these movements are achieved without significant decrement in force (Rome and Sosnicki, 1991). Thus, animals adjust three design parameters (fibre orientation, myofilament lengths and the kinematics of movement) during evolution such that the muscle fibres being used always operate at near maximal myofilament overlap and force generation.
The importance of V/VmaK (and to a lesser extent myofilament overlap) should be viewed in the broader context of the full range of muscle movements. First, there is some evidence that, towards the tail region of fish, the red muscle is primarily performing lengthening contractions rather than shortening contractions (Williams et al. 1989; van Leeuwen et al. 1990). Second, V/Vmax is important only in muscles that are actively shortening (i.e. mechanical power and efficiency are only defined for shortening muscle). Finally, even in muscle that primarily undergoes active shortening, the muscle must still shorten and lengthen and activate and relax in a cyclical manner which affects power output (Josephson, 1985; Altringham and Johnston, 1990).
Nonetheless, V/Vmax still appears to be maintained between fairly narrow bounds. This may be understood from the following considerations. First, fish must generate positive mechanical work to overcome the force of drag and only
shortening muscle can produce positive mechanical work. Second, the design
294 L. C. ROME, A. SOSNICKI AND I.-H. CHOI
of lengthening muscle (i.e. lengthening muscle generates high forces while requiring little energy and in many cases in nature is even replaced by tendon). Thus, it appears that the design parameters for muscle (e.g. Vmax) are primarily set for effective shortening. And finally, although factors such as activation and relaxation kinetics and shortening deactivation are no doubt important for power output, these effects are superimposed on the rate at which the myofilaments move past one another, which is probably the major determinant of power and efficiency.
It is vitally important to try to reproduce in vitro the exact length changes and stimulation pattern the muscle undergoes in vivo. This will help us evaluate the importance of other design parameters as well as defining new constraints. In addition, it will enable us to prove conclusively that muscle is actually active during lengthening and, if so, to see if the muscle is specially designed for this function.
The authors thank Doug Swank for helping perform some of the experiments and Louis Kerr for performing some of the histology. We also Gordon Lutz for transporting some of the scup used from Woods Hole to Philadelphia. This research was supported by grants to L.C.R. from NIH (AR38404), University of Pennsylvania Research Foundation and University of Pennsylvania BRSG.
References
ALTRINGHAM, J. D. AND JOHNSTON, I. A. (1988). Activation of multiply innervated fast and slow myotomal muscle fibres of the teleost Myoxocephalus scorpius. J. exp. Biol. 140, 313-324. ALTRINGHAM, J. D. AND JOHNSTON, I. A. (1990). Scaling effects on muscle function: power
output of isolated fish muscle fibres performing oscillatory work. J. exp. Biol. 151, 453-467. BENNETT, A. F. (1984). Thermal dependence of muscle function. Am. J. Physiol. 247,
R217-R229.
CLAFLIN, D. R. AND FAULKNER, J. A. (1985). Shortening velocity extrapolated to zero load and unloaded shortening velocity of whole rat skeletal muscle. J. Physiol., Lond. 359, 357-363. CURTIN, N. A. AND WOLEDGE, R. C. (1988). Power output and force-velocity relationship of live
fibres from white myotomal muscle of the dogfish, Scyliorhinus canicula. J. exp. Biol. 140, 187-197.
CURTIN, N. A. AND WOLEDGE, R. C. (1991). Efficiency of energy conversion during shortening of muscle fibres from the dogfish, Scyliorhinus canicula. J. exp. Biol. 158, 343-353.
EDMAN, K. A. P., MULIERI, L. A. AND SCUBON-MULIERI, B. (1976). Non-hyperbolic force-velocity relationship in single muscle fibres. Acta physiol. scand. 98, 143-156.
JOHNSON, T. P., ALTRINGHAM, J. D. AND JOHNSTON, I. A. (1991). The effects of Ca2+ and
neuromuscular blockers on the activation of fish muscle fibres. J. Fish Biol. (in press). JOSEPHSON, R. K. (1985). The mechanical power output of a tettigoniid wing muscle during
singing and flight. J. exp. Biol. 117, 357-368.
JULIAN, F. J., ROME, L. C., STEPHENSON, D. G. AND STRIZ, S. (1986). The maximum speed of shortening in living and skinned frog sartorius muscle fibres. J. Physiol., Lond. 370, 181-199. RANATUNGA, K. W. (1984). The force-velocity relation of rat fast- and slow-twitch muscles
examined at different temperatures. J. Physiol., Lond. 351, 517-529.
ROME, L. C. (1990). The influence of temperature on muscle recruitment and function in vivo. Am. J. Physiol. 259, R210-R222.
ROME, L. C , FUNKE, R. P. AND ALEXANDER, R. M. (1990a). The influence of temperature on muscle velocity and sustained performance in swimming carp. J. exp. Biol. 154,163-178.
ROME, L. C , FUNKE, R. P., ALEXANDER, R. M., LUTZ, G., ALDRIDGE, H. D . J. N., SCOTT, F.
AND FREADMAN, M. (1988). Why animals have different muscle fibre types. Nature 355, 824-827.
ROME, L. C. AND KUSHMERICK, M. J. (1983). The energetic cost of generating isometric force as a function of temperature in isolated frog muscle. Am. J. Physiol. 244, C100-C109.
ROME, L. C , LOUGHNA, P. T. AND GOLDSPINK, G. (1984). Muscle fiber recruitment as a function of swim speed and muscle temperature in carp. Am. J. Physiol. 247, R272-R279.
ROME, L. C , LOUGHNA, P. T. AND GOLDSPINK, G. (1985). Temperature acclimation improves sustained swimming performance at low temperatures in carp. Science 228, 194-196. ROME, L. C. AND SOSNICKI, A. A. (1990). The influence of temperature on mechanics of red
muscle in carp. J. Physiol., Lond. 427, 151-169.
ROME, L. C. AND SOSNICKI, A. A. (1991). Myofilament overlap in swimming carp. II. Sarcomere length changes during swimming. Am. J. Physiol. 260, C289-C296.
ROME, L. C , SOSNICKI, A. A. AND GOBLE, D. O. (19906). Maximum velocity of shortening of three fibre types from the horse soleus: Implications for scaling with body size. J. Physiol., Lond. 431,173-185.
SOSNICKI, A. A., LOESSER, K. AND ROME, L. C. (1991). Myofilament overlap in swimming carp. I. Myofilament lengths of red and white muscle. Am. J. Physiol. 260, C283-C288.
VAN LEEUWEN, J. L., LANKHEET, M. J. M., AKSTER, H. A. AND OSSE, J. W. M. (1990). Function
of red axial muscle of carp (Cyprinus carpio L.): recruitment and normalised power output during swimming in different modes. / . Zool., Lond. 220,123-145.
WILLIAMS, T. L., GRILLNER, S., SMOLJANINOV, V. V., WALLEN, P., KASHIN, S. AND ROSSIGNOL,