Accuracy of Dynamic Perfusion CT with
Deconvolution in Detecting Acute
Hemispheric Stroke
Max Wintermark, Nancy J. Fischbein, Wade S. Smith, Nerissa U. Ko, Marcel Quist, and William P. Dillon
BACKGROUND AND PURPOSE:Dynamic perfusion CT (PCT) with deconvolution produces maps of time-to-peak (TTP), mean transit time (MTT), regional cerebral blood flow (rCBF), and regional cerebral blood volume (rCBV), with a computerized automated map of the infarct and penumbra. We determined the accuracy of these maps in patients with suspected acute hemispheric stroke.
METHODS:Forty-six patients underwent nonenhanced CT and dynamic PCT, with follow-up CT or MR imaging. Two observers reviewed the nonenhanced studies for signs of stroke and read the PCT maps for TTP, MTT, rCBF, and rCBV abnormalities. Sensitivity, specificity, accuracy, and interobserver agreement were compared (Wilcoxon tests). Nonenhanced CT and PCT data were reviewed for stroke extent according to previously reported methods. Sensitivity, specificity, and accuracy of the computerized maps in detecting ischemia and its extent were determined.
RESULTS:Compared with nonenhanced CT, PCT maps were significantly more accurate in detecting stroke (75.7– 86.0% vs. 66.2%;P< .01), MTT maps were significantly more sensitive (77.6% vs. 69.2%;P< .01), and rCBF and rCBV maps were significantly more specific (90.9% and 92.7%, respectively, vs. 65.0%; P< .01). Regarding stroke extent, PCT maps were signifi-cantly more sensitive than nonenhanced CT (up to 94.4% vs. 42.9%; P< .01) and had higher interobserver agreement (up to 0.763). For the computerized map, sensitivity, specificity, and accuracy, respectively, were 68.2%, 92.3%, and 88.1% in detecting ischemia and 72.2%, 91.8%, and 87.9% in showing the extent.
CONCLUSION: Dynamic PCT maps are more accurate than nonenhanced CT in detecting hemispheric strokes. Despite limited spatial coverage, PCT is highly reliable to assess the stroke extent.
Perfusion CT (PCT) techniques combined with CT angiography (CTA) provide a comprehensive nonin-vasive survey of the site of arterial occlusion and the resulting ischemia and infarction (1). Two categories of PCT techniques are currently in practice:
whole-brain PCT and section-selective dynamic PCT. Whole-brain PCT provides information related to ce-rebral blood volume (CBV) and the infarct core (2, 3), with reported sensitivity, specificity, and accuracy of 90.5%, 89.5% and 90.0%, respectively (4). It does not, however, permit assessment of the ischemic pen-umbra (5), which is the target of acute stroke treatment.
Section-selective dynamic PCT involves the acqui-sition of sequential CT data from a few sections in a cine mode during an intravenous bolus of iodinated contrast material. Dynamic PCT data can be analyzed according to two distinct mathematical models: the maximal slope model and the central volume princi-ple (6). The maximal slope model has a sensitivity and specificity of 93% and 98%, respectively, as reported in small series of patients (7, 8), although it has the major drawback of not being quantitative (6). The central volume principle, which relies on a
mathemat-Received January 30, 2004; accepted after revision April 14. From the Departments of Radiology, Neuroradiology Section (M.W., N.J.F., W.P.D.), and Neurology, Neurovascular Service (W.S.S., N.U.K.), University of California, San Francisco; Depart-ment of Diagnostic and Interventional Radiology, University Hos-pital Center, Lausanne, Switzerland (M.W.); and Medical IT– Advanced Development, Philips Medical Systems, Best, the Netherlands (M.Q.).
Supported by grants from the Swiss Society of Radiology, the Socie´te´ Acade´mique Vaudoise, and the SICPA Foundation.
Address reprint requests to Max Wintermark, MD, Department of Radiology, Neuroradiology Section, University of California, San Francisco.
©American Society of Neuroradiology
ical operation called deconvolution, assesses cerebral blood flow (CBF), CBV, and mean transit time (MTT) in a robust and reproducible way; it also has the advantage of being quantitative (9 –12). The com-puterized automated map of infarct and penumbra (13, 14) is correlated with findings on MR-based diffusion-weighted (DW) imaging and perfusion-weighted imaging, both in the acute phase (13) and on follow-up (14).
In clinical practice, PCT maps are interpreted in conjunction with nonenhanced CT and CTA images in patients with suspected stroke. However, the accu-racy of the maps obtained during dynamic PCT with deconvolution has not been fully assessed. Which of the maps is most reliable for the detection of stroke? What are the advantages of each of the maps com-pared with the others?
Whatever PCT map is considered, the limited spa-tial coverage of dynamic PCT might represent a ma-jor drawback and jeopardize its sensitivity. With mul-tidetector-row CT technology, the spatial coverage of dynamic PCT can reach 20 –24 mm for each bolus of contrast material. When we consider the risk of neph-rotoxicity and the amount of contrast material that must be reserved for subsequent CTA (15), a maxi-mum of two 40 –50-mL boluses can be used; there-fore, total coverage up to 40 – 48 mm reached. To increase coverage with CT perfusion during a single bolus of contrast agent, certain technical manipula-tions, such as the toggling-table technique, have been proposed (16). These can potentially double the spa-tial coverage afforded by PCT.
In this study, we assessed the different maps de-rived from dynamic PCT with deconvolution in the setting of suspected acute hemispheric stroke. Our goal was to determine the sensitivity, specificity, and accuracy of the maps of TTP, MTT, regional CBF (rCBF), and regional CBV (rCBV), as well as the computerized automated map, for demonstrating acute brain ischemia and its extent. To assess the potential impact of the limited spatial coverage of PCT, we compared findings on the four 10-mm sec-tions included in our PCT protocol to the findings on whole-brain nonenhanced CT scans.
Methods
Design
Imaging data obtained as part of standard clinical stroke care at our institution were retrospectively reviewed with the approval of our institutional review board. At our institution, patients with suspected acute stroke and no notable renal insufficiency or allergy to contrast agent undergo the following imaging protocol: nonenhanced CT, PCT at two cross-sectional positions, CTA of the cervical and intracranial vessels, and contrast-enhanced cerebral CT (15). The acquisition parame-ters for the PCT series are described later.
Nonenhanced CT and PCT data were included in this study if these conditions were met: 1) The patient presented to the emergency department with signs and symptoms suggestive of hemispheric stroke (e.g., hemisensory loss, hemiparesis, apha-sia, or homonymous visual field abnormality) of 12 hours’ duration or less, 2) there was no evidence of intracerebral hemorrhage, and 3) the patient underwent follow-up CT or
MR imaging to confirm or rule out ischemic hemispheric stroke. Patients who underwent thrombolysis were excluded.
Imaging Protocol
PCT consisted of a 45-second series with 45 gantry rotations performed in cine mode during the intravenous administration of iodinated contrast material. Images were acquired and re-constructed at a temporal sampling rate of one image per second, resulting in a series of 45 images for each assessed section. Two successive PCT series were performed after non-enhanced CT and before CTA. The two PCT series were separated by 5 minutes.
Multidetector-row CT technology permitted the assessment of two adjacent 10-mm-thick sections for each series. Two 10-mm-thick sections were preferred to four adjacent 5-mm-thick sections per location to maximize the signal-to-noise ratio without increasing the dose to the patient. The two sections of the first PCT series were at the level of the third ventricle and the basal ganglia, positioned above the orbits to protect the lenses. The second PCT series was selected at a level 3.5 cm rostral to the first section of the first series.
For each series, a 40-mL bolus of iohexol (Omnipaque, iodine 300 mg/mL; Amersham Health, Princeton, NJ) was administered into an antecubital vein by using a power injector at an injection rate of 4 mL/s. The acquisition parameters were 80 kVp and 120 mAs. CT scanning was initiated 7 seconds after the start of the injection. The time delay before contrast ma-terial reached the brain parenchyma allowed the acquisition of nonenhanced baseline images.
Data Processing
PCT data were analyzed by using PCT prototype software (Philips Medical Systems, Best, the Netherlands). This software relies on the central volume principle, which is the most accu-rate for low injection accu-rates of iodinated contrast material (6). After motion correction and noise reduction are done by using an anisotropic, edge-preserving spatial filter, the software ap-plies curve fitting by a least-mean-squares method to obtain mathematical descriptions of the time-attenuation curves. Then, it applies a closed-form (noniterative) deconvolution to calculate the MTT map (17). The deconvolution operation requires a reference arterial input function, which selected by the PCT software in a region of interest that the user draws around the anterior cerebral artery (ACA). The rCBV map is calculated from the areas under the time-enhancement curves (18). A simple equation combining rCBV and MTT values allows the calculation of rCBF: rCBF ⫽ rCBV/MTT (17). Finally, the software calculates an automated computerized map of the penumbra and infarct by using rCBF and rCBV thresholds, according to a method previously described and validated (13, 14).
Data Analysis
hypoattenu-ation in 10 areas: caudate, lenticulate, internal capsule, insula, M1, M2, M3, M4, M5, and M6. Their assessments lead to a score ranging from 10 (no areas with hypoattenuation) to 0 (10 areas with hypoattenuation). If the score was 7 or less, the patient was considered to have a stroke involving more than one third of the MCA territory (20). Finally, the reviewers assessed hypoattenuation in the arterial territories of the ACA and posterior cerebral artery (PCA).
In separate review sessions, the same reviewers reviewed the rCBV, rCBF, MTT, and time-to-peak (TTP) maps for abnor-mally low rCBV, low rCBF, high MTT, and high TTP values in the four areas defined in the ATLANTIS method, the 10 areas defined in the ASPECTS method, and the ACA and PCA territories. If two or more areas from the ATLANTIS method or if three or more areas from the ASPECTS method showed abnormal values, the patient was considered to have a stroke involving more than one third of the MCA territory, as shown on the corresponding PCT map. Special attention was paid to the blinding of patient data. Moreover, reviews of the nonen-hanced CT scans and rCBV, rCBF, MTT, and TTP maps were performed successively, at 2-week intervals. The reviewers per-formed the readings independently of each other and were blinded to the other’s opinions, as well as the results of the formal, dictated evaluation of these examinations. The review-ers were informed of only the body side of the signs and symptoms to reproduce the emergency setting as closely as possible.
The reviewers’ assessment of the PCT maps relied on their subjective visual evaluation and involved a comparison of the presumed pathologic hemisphere with the presumed healthy one. The data were also subjected to automated analysis by PCT prototype software (Philips Medical Systems). As men-tioned before, this software automatically defines a computer-ized map of the infarct and penumbra based on thresholds levels of rCBF and rCBV. This computerized automated map was assessed for possible penumbra or infarct in the four ATLANTIS areas, the 10 ASPECTS areas, and the ACA and PCA territories.
Statistical Analysis
In each patient, follow-up CT or MR images were reviewed according to the scheme just described. The results were con-sidered the criterion standard for the calculation of the sensi-tivity, specificity, and accuracy of hypoattenuation on nonen-hanced CT and of rCBV, rCBF, MTT, and TTP abnormalities on PCT. Sensitivity, specificity, and accuracy were calculated for the detection of stroke and also for the assessment of the extent (more or less than one third of the MCA territory).
For each conventional nonenhanced CT sign (erased cortex, erased insula, erased basal nuclei, attenuated artery sign), the sensitivity, specificity, and accuracy were determined depend-ing on whether a final diagnosis of stroke was confirmed or not. Sensitivity, specificity, and accuracy were also calculated for all the conventional nonenhanced CT signs considered together (e.g., the study was considered positive if any of the previously listed signs were present). These global values for nonenhanced CT were used as a reference in Wilcoxon (Mann-Whitney) tests to determine whether the different PCT maps were superior to nonenhanced CT. The significance level was set at .01 to ac-count for the multiple sampling (Bonferroni correction).
Cohen coefficients were calculated to determine the in-terobserver agreement (between the neuroradiologist and the stroke neurologist). These were determined for both the pres-ence and the extent of abnormalities on nonenhanced CT and PCT. Avalue of 0.20 or less implied poor agreement; 0.21– 0.40, fair agreement; 0.41– 0.60, moderate agreement; 0.61– 0.80, substantial agreement; and 0.81–1.00, excellent agree-ment (21).
Results
Patient Characteristics
Between January and June 2003, 147 patients pre-sented to the emergency department with strokelike symptoms and underwent our stroke CT protocol. Among them, we identified 46 who fulfilled the in-clusion criteria. Thirty-one were male and 15 female, with a median age of 64 years (range, 28 –94 years). Their symptoms and signs of stroke were left sided in 28 and right sided in 18. The median time between stroke onset and performance of the admission CT protocol was 5.5 hours, with a range of 1.0 –12.0 hours. Twenty-nine patients underwent follow-up CT (median, 5 days; range, 3–18 days), and 17 underwent follow-up MR imaging (median, 5 days; range, 2– 8 days), which included both DW imaging and fluid-attenuated inversion recovery series. Most patients did not undergo CTA or MR angiography during their follow-up examination. Final diagnoses were acute ischemic stroke in 26 (23 nonlacunar and three lacunar), transient ischemic attack (TIA) in 14, and nonstroke conditions in six (seizures in four, migraine in two). The location of the strokes is summarized in Table 1. Seven patients were also had strokes before the event precipitating the stroke CT protocol.
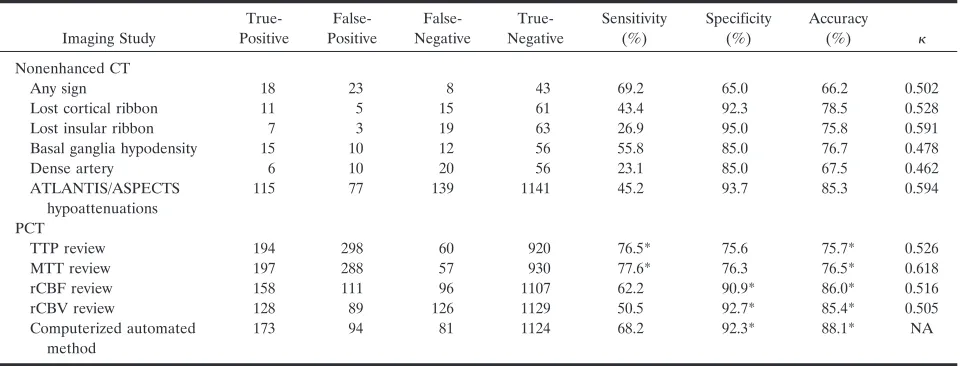
Nonenhanced CT and PCT in Detecting Stroke The sensitivity, specificity, accuracy, and interob-server agreement of nonenhanced CT and PCT in the assessment of stroke are summarized in Table 2. The accuracy of PCT was significantly greater than that of nonenhanced CT (75.7– 86% vs. 66.2%;P⬍.01) in the detection of stroke. TTP and MTT maps were signifi-TABLE 1: Territorial location of strokes on follow-up
Scoring System
Number (n⫽26)
Major arterial territory
ACA 2 (7.7)
MCA 17 (65.4)
PCA 11 (42.3)
ATLANTIS
Frontal 12 (46.2)
Parietal 8 (30.8)
Temporal 8 (30.8)
Basal ganglia 9 (34.6)
ASPECTS
Caudate 4 (15.4)
Lenticulate 8 (30.8)
Internal capsule 7 (26.9)
Insula 10 (38.5)
M1 5 (19.2)
M2 10 (38.5)
M3 7 (26.9)
M4 7 (26.9)
M5 14 (53.8)
M6 5 (19.2)
[image:3.585.305.534.70.303.2]cantly more sensitive than nonenhanced CT (76.5% and 77.6%, respectively, vs. 69.2%;P⬍ .01), with a higher interobserver agreement for MTT maps (i.e., 0.618). rCBF and rCBV were significantly more specific then nonenhanced CT (90.9% and 92.7%, respectively, vs. 65.0%; P ⬍ .01). On the other hand, interobserver agreement only tended to be better with PCT than with nonenhanced CT. The automated method for delineat-ing brain ischemia had sensitivity, specificity, and accu-racy similar to those resulting from the observers’ re-view; interobserver-agreement issues did not apply, as since it was automated method.
False-Negative and False-Positive Findings False-negative findings on PCT were related mainly to a lack of spatial coverage. PCT failed to completely reveal a nonlacunar stroke in only one of the 23 patients. In three cases, follow-up imaging demonstrated acute lacunar strokes that were too small to be detected on PCT maps. The other false-negative cases were false-false-negative areas in patients with true-positive disease (i.e., in each of these pa-tients) PCT demonstrated most but not all ischemic areas. In two cases, hyperemia (high rCBF and rCBV, low MTT and TTP) rather than oligemia was re-corded in a territory in which follow-up imaging showed infarct; this led to false-negative results ac-cording to the assessment criteria used. This pattern was also identified in three patients with a final diag-nosis of TIA; this finding will need to be accounted for in future grading systems. Finally, in four patients, PCT maps were degraded by motion artifacts that compromised the detection of oligemia in some ar-eas; this also led to false-negative results.
One case of arterial recanalization was also docu-mented (Fig 1). In this case, the rCBF, MTT, and TTP maps were abnormal in some areas that were negative for stroke on follow-up examination. The computerized automated map described these areas
as penumbra. False-positive results with PCT also occurred in three cases of TIA, in which TTP and MTT maps suggested ischemia (Fig 2). Remote in-farctions also led to false-positive results, as they could be distinguished from acute strokes only when PCT maps were interpreted side by side with the corresponding nonenhanced CT.
Nonenhanced CT and PCT in Assessing Stroke Extent
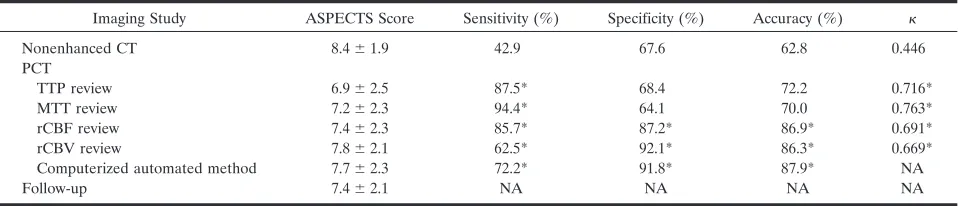
In assessing the extent of stroke (more or less than one third of the MCA territory), PCT is more sensi-tive (up to 94.4%), specific (up to 92.1%) and accu-rate (up to 87.9%) than nonenhanced CT (62.8%). PCT also had significantly increased interobserver agreement. This finding was true with both the AS-PECTS (Table 3) and the ATLANTIS scoring systems.
Discussion
[image:4.585.55.537.70.253.2]We found that dynamic PCT maps were signifi-cantly more accurate than nonenhanced CT in the detection of stroke (75.7– 88.1% vs. 66.2%;P⬍ .01) in patients with hemispheric stroke symptoms of less than 12 hours ’ duration. MTT and TTP maps were significantly more sensitive than nonenhanced CT (77.6% and 76.5%, respectively, vs. 69.2%;P⬍.01), with higher interobserver agreement for MTT maps (0.618 for MTT vs. 0.526 for TTP). On the other hand, rCBF and rCBV maps were significantly more specific (90.9% and 92.7%, respectively). Sensitivity, specificity, accuracy, and interobserver agreement for nonenhanced CT were consistent with those previ-ously reported (22–25). Conventional nonenhanced CT signs (hemispheric hypoattenuation, loss of the cortical ribbon, hypoattenuation in the basal ganglia, attenuated artery sign) were specific (85.0 –95.0%) but not sensitive (23.1–55.8%), since most of these TABLE 2: Sensitivity, specificity, accuracy, and interobserver agreement in detecting stroke
Imaging Study
True-Positive
False-Positive
False-Negative
True-Negative
Sensitivity (%)
Specificity (%)
Accuracy
(%)
Nonenhanced CT
Any sign 18 23 8 43 69.2 65.0 66.2 0.502
Lost cortical ribbon 11 5 15 61 43.4 92.3 78.5 0.528
Lost insular ribbon 7 3 19 63 26.9 95.0 75.8 0.591
Basal ganglia hypodensity 15 10 12 56 55.8 85.0 76.7 0.478
Dense artery 6 10 20 56 23.1 85.0 67.5 0.462
ATLANTIS/ASPECTS hypoattenuations
115 77 139 1141 45.2 93.7 85.3 0.594
PCT
TTP review 194 298 60 920 76.5* 75.6 75.7* 0.526
MTT review 197 288 57 930 77.6* 76.3 76.5* 0.618
rCBF review 158 111 96 1107 62.2 90.9* 86.0* 0.516
rCBV review 128 89 126 1129 50.5 92.7* 85.4* 0.505
Computerized automated method
173 94 81 1124 68.2 92.3* 88.1* NA
Note.—Follow-up CT or MR imaging was the criterion standard. Globally, accuracy was significantly greater with PCT than with nonenhanced CT: TTP and MTT maps are significantly more sensitive, whereas rCBF and rCBV maps were significantly more specific. NA indicates not applicable.
signs occur relatively late in the course of acute brain ischemia (26, 27). This observation was consistent with their occurrence, which was lower than that of PCT abnormalities. The reviewers identified 115 true-positive hypoattenuating areas on the nonenhanced CT, while 197 true-positive abnormal areas were identified on MTT maps.
False-negative PCT results were related mainly to a lack of spatial coverage, as has been reported for other dynamic PCT techniques (28, 29). However,
with PCT, a nonlacunar stroke was missed in only one of 23 patients. We also identified false-negative areas occurring in patients with true-positive disease (i.e., PCT demonstrated most ischemic areas but missed some). Several lacunar strokes were not identified on PCT because of a lack of spatial resolution. In two patients, we identified a pattern that was responsible for false-negative results based on the classification scheme used in our study. This pattern consisted of hyperemia (high rCBF and rCBV, low MTT and
TTP) rather than oligemia in a territory in which follow-up imaging subsequently showed infarct. This pattern was likely related to the so-called luxury per-fusionand should be accounted for in future studies. Most of the false-positive PCT results were associ-ated with TIA. In TIA, MTT is prolonged, but rCBV is also increased, presumably because of sufficient circulation and cerebral vascular autoregulation, with subsequent preservation of rCBF. In a sense, how-ever, these are only false-positive for predicting in-farction, as the patient presumably does have isch-emia but insufficient tissue compromise to lead to infarction. False-positive PCT results also occurred in cases of remote infarctions, which typically have the same PCT characteristics as acute ones (prolonged TTP and MTT, lowered rCBF and rCBV). Remote infarctions are easily distinguished from acute ones (less than 12 hours) on the basis of nonenhanced CT. However, the reviewers in this study, evaluated non-enhanced CT and PCT maps in different sessions and not together, increasing the false-positive PCT re-sults. The impact of combined interpretation of non-enhanced CT and PCT studies was not analyzed, but is expected to reduce such false-positive results.
The clinical interpretation of PCT data should in-clude evaluation of a sensitive map to screen acute patients for brain ischemia and also a specific map to diagnose infarction. MTT and TTP maps are both highly sensitive for detecting ischemia. TTP maps, however, had lower interobserver agreement and are sensitive to extracranial or intracranial vascular ste-nosis, independent of brain ischemia. Therefore, MTT maps are more useful in screening for ischemia, with the caveat that they are abnormal not only in strokes but also in TIA. rCBF and rCBV maps are the most specific PCT maps, and their combined inter-pretation in the computerized automated method had an accuracy of 88.1%. Our study design was such that it was impossible to systematically assess the influence of recanalization or persistent arterial occlusion—and also the resolution of penumbra or the evolution of infarction over penumbra— on the accuracy of the PCT maps, since we did not have follow-up CTA or MR angiographic studies in most patients.
Our proposed interpretation scheme based on sen-sitive MTT maps and specific rCBF and rCBV maps must still be validated in a prospective study with respect to its effect on patient care; this is also the case for the computerized automated maps. The re-viewers did not undertake a combined interpretation of the different PCT maps together so that we could explore the value of interpreting each map in isola-tion. With the results of this study, we expect the sensitivity and specificity of PCT— coupled with non-enhanced CT findings—to be substantially higher if reviewers use MTT to identify ischemia and rCBF and rCBV maps to confirm ischemia in regions with prolonged MTT. Additionally, the incorporation of CTA results might also enhance this accuracy; this is the subject of further study.
Another important factor in the diagnosis and treatment of stroke is the assessment of infarction extent, as this is an important criterion in the selec-tion of patients for acute treatment (30, 31). Our study demonstrated that PCT was significantly more sensitive (up to 94.4%), more specific (up to 93.9%), and more accurate (up to 87.9%) than nonenhanced CT in the detection of stroke involving more than one third of the MCA territory. Interobserver agreement for PCT (up to 0.763) was substantial and significantly higher than that of nonenhanced CT (i.e., 0.446). This was true whether the ATLANTIS or the ASPECTS-derived scores were used.
This finding has important implications on stroke management. Indeed, the 37.0 – 42.9% sensitivity of nonenhanced CT for strokes more extensive one third of the MCA territory suggests that five to eight (10.9 – 17.4%) of our 46 patients with large infarcts on fol-low-up would have undergone unindicated aggressive treatment or invasive diagnostic procedures (e.g., an-giography) if the volume of infarction at baseline was based on nonenhanced CT alone. With PCT, the percentage of patients referred for aggressive acute stroke treatment, which is not indicated on the basis of the one-third MCA guidelines, could be theoreti-cally lowered to 2.2%. Thus, PCT constitutes an im-portant tool for the stratification of patients for acute stroke treatment, and it may potentially result in
stantial cost savings and reductions in morbidity. However, whether the European Cooperative Acute Stroke Study (ECASS) and National Institute of Neu-rological Disorders and Stroke (NINDS) criteria re-garding nonenhanced CT findings can be directly transferred to PCT is unclear. We are likely dealing with a new tool that defines the volume of brain at
risk more precisely that previous methods, and we postulate that PCT parameters may help in deciding who is at risk for hemorrhage and who is likely to benefit from aggressive intervention.
We did not directly compare the performances of PCT and DW imaging in the early detection of brain ischemia. For PCT, we found an overall sensitivity of
77.6%, which can be compared with the 86 –94% reported for DW imaging (32–34). Interobserver agreement for PCT (0.505– 0.618) was similar to the 0.6 reported for DW imaging (35, 36). Our study also showed that PCT has high sensitivity (up to 94.4%), specificity (up to 93.9%), and accuracy (up to 87.9%), and interobserver agreement (up to 0.716) in the depiction of stroke extent. However, a direct compar-ison with acute DW imaging in this feature remains to be performed.
We enrolled only patients with suspected hemispheric stroke, limiting the number of patients with lacunar or other small strokes and those with strokes in the poste-rior fossa. PCT technique is limited in the diagnosis of lacunae and strokes in the posterior fossa because of limited spatial resolution and artifacts in this fossa. Ad-ditionally, imaging of the posterior fossa with PCT re-sults in a substantial radiation dose to the lenses.
Another limitation of our study is the requirement of follow-up scanning for inclusion in the study. This cri-terion excluded a large fraction of those with TIA and might have positively influenced the accuracy measures by lowering the number of nonstroke patients. How-ever, because our goal was to calculate the sensitivity, specificity, and accuracy of nonenhanced CT and PCT maps—and ultimately to compare nonenhanced CT and PCT techniques—we needed a criterion standard other than nonenhanced CT or PCT; therefore, a fol-low-up examination was required.
Conclusion
Deconvolution-based dynamic PCT maps are more accurate than nonenhanced CT scans in the depiction of acute hemispheric stroke. MTT maps are the most sensitive, and rCBF and rCBV maps the most spe-cific. Moreover, PCT more accurately depicts the extent of stroke; this advantage has implications on clinical decision making. Despite its limited spatial coverage, PCT can likely be used to stratify patients for acute stroke treatment. An interpretation scheme based on sensitive MTT maps and specific rCBF and rCBV maps must be validated in a prospective study with respect to its effect on patient care.
References
1. Latchaw RE, Yonas H, Hunter GJ, et al.Council on Cardiovascu-lar Radiology of the American Heart Association: guidelines and recommendations for perfusion imaging in cerebral ischemia. Stroke2003;34:1084 –1104
2. Lev MH, Segal AZ, Farkas J, et al.Utility of perfusion-weighted CT imaging in acute middle cerebral artery stroke treated with intra-arterial thrombolysis: prediction of final infarct volume and clin-ical outcome.Stroke2001;32:2021–2027
3. Hamberg LM, Hunter GJ, Maynard KI, et al.Functional CT per-fusion imaging in predicting the extent of cerebral infarction from a 3-hour middle cerebral arterial occlusion in a primate stroke model.AJNR Am J Neuroradiol2002;23:1013–1021
4. Hunter GJ, Silvennoinen HM, Hamberg LM, et al.Whole-brain CT perfusion measurement of perfused cerebral blood volume in acute ischemic stroke: probability curve for regional infarction. Radiol-ogy2003;227:725–730
5. Wintermark M, Bogousslavsky J.Imaging of acute ischemic brain injury: the return of computed tomography. Curr Opin Neurol
2003;16:59 – 63
6. Wintermark M, Maeder P, Thiran JP, Schnyder P, Meuli R. Quan-titative assessment of regional cerebral blood flows by perfusion CT studies at low injection rates: a critical review of the underlying theoretical models.Eur Radiol2001;11:1220 –1230
7. Mayer TE, Hamann GF, Baranczyk J, et al.Dynamic CT perfusion imaging of acute stroke.AJNR Am J Neuroradiol2000;21:1441–1449 8. Reichenbach JR, Rother J, Jonetz-Mentzel L, et al.Acute stroke
evaluated by time-to-peak mapping during initial and early fol-low-up perfusion CT studies. AJNR Am J Neuroradiol 1999;20: 1842–1850
9. Wintermark M, Maeder P, Thiran JP, Schnyder P, Meuli R. Simul-taneous measurements of regional cerebral blood flows by perfu-sion-CT and stable xenon-CT: a validation study. AJNR Am J Neuroradiol2001;22:905–914
10. Furukawa M, Kashiwagi S, Matsunaga N, Suzuki M, Kishimoto K, Shirao S.Evaluation of cerebral perfusion parameters measured by perfusion CT in chronic cerebral ischemia: comparison with Xenon CT.J Comput Assist Tomogr2002;26:272–278
11. Kudo K, Terae S, Katoh C, Oka M, Shiga T, Tamaki N, Miyasaka K. Quantitative cerebral blood flow measurement with dynamic perfusion CT using the vascular-pixel elimination method: com-parison with H2
15O positron emission tomography. AJNR Am J Neuroradiol2003;24:419 – 426
12. Gillard JH, Antoun NM, Burnet NG, Pickard JD.Reproducibility of quantitative CT perfusion imaging.Br J Radiol2001;74:552–555 13. Wintermark M, Reichhart M, Cuisenaire O, et al.Comparison of admission perfusion computed tomography and qualitative diffu-sion- and perfudiffu-sion-weighted magnetic resonance imaging in acute stroke patients.Stroke2002;33:2025–2031
14. Wintermark M, Reichhart M, Thiran JP, et al.Prognostic accuracy of cerebral blood flow measurement by perfusion computed tomog-raphy, at the time of emergency room admission, in acute stroke patients.Ann Neurol2002;51:417– 432
15. Smith WS, Roberts HC, Chuang NA, et al.Safety and feasibility of a CT protocol for acute stroke: combined CT, CT angiograph, and CT perfusion imaging in 53 consecutive patients. AJNR Am J Neuroradiol2003;24:688 – 690
16. Roberts HC, Roberts TP, Smith WS, Lee TJ, Fischbein NJ, Dillon WP.Multisection dynamic CT perfusion for acute cerebral isch-TABLE 3: Sensitivity, specificity, accuracy, and interobserver agreement in assessing stroke extent by ASPECTS score (>1⁄3ASPECTS)
Imaging Study ASPECTS Score Sensitivity (%) Specificity (%) Accuracy (%)
Nonenhanced CT 8.4⫾1.9 42.9 67.6 62.8 0.446
PCT
TTP review 6.9⫾2.5 87.5* 68.4 72.2 0.716*
MTT review 7.2⫾2.3 94.4* 64.1 70.0 0.763*
rCBF review 7.4⫾2.3 85.7* 87.2* 86.9* 0.691*
rCBV review 7.8⫾2.1 62.5* 92.1* 86.3* 0.669*
Computerized automated method 7.7⫾2.3 72.2* 91.8* 87.9* NA
Follow-up 7.4⫾2.1 NA NA NA NA
Note.—PCT was globally more sensitive, specific, and accurate than nonenhanced CT in correctly classifying large strokes, with significantly increased interobserver agreement. NA indicates not applicable.
[image:8.585.55.534.70.173.2]emia: the “toggling-table” technique. AJNR Am J Neuroradiol
2001;22:1077–1080
17. Axel L.Tissue mean transit time from dynamic computed tomog-raphy by a simple deconvolution technique.Invest Radiol1983;8: 94 –99
18. Ladurner G, Zilkha E, Iliff D, du Boulay GH, Marshall J. Mea-surement of regional cerebral blood volume by computerized axial tomography.J Neurol Neurosurg Psychiatry1976;39:152–155 19. Kalafut MA, Schriger DL, Saver JL, Starkman S.Detection of early
CT signs of > 1/3 middle cerebral artery infarctions: interrater reliability and sensitivity of CT interpretation by physicians in-volved in acute stroke care.Stroke2000;31:1667–1671
20. Pexman JH, Barber PA, Hill MD, et al.Use of the Alberta Stroke Program Early CT Score (ASPECTS) for assessing CT scans in patients with acute stroke.AJNR Am J Neuroradiol2001;22:1534 –1542 21. Kundel HL, Polansky M. Measurement of observer agreement.
Radiology2003;228:303–308
22. von Kummer R, Bourquain H, Bastianello S, et al.Early prediction of irreversible brain damage after ischemic stroke at CT.Radiology
2001;219:95–100
23. von Kummer R, Holle R, Gizyska U, et al.Interobserver agreement in assessing early CT signs of middle cerebral artery infarction. AJNR Am J Neuroradiol1996;17:1743–1748
24. Dippel DW, Du Ry van Beest Holle M, van Kooten F, Koudstaal PJ.The validity and reliability of signs of early infarction on CT in acute ischaemic stroke.Neuroradiology2000;42:629 – 633 25. Barber PA, Demchuk AM, Hudon ME, Pexman JH, Hill MD,
Buchan AM.Hyperdense sylvian fissure MCA “dot” sign: a CT marker of acute ischemia.Stroke2001;32:84 – 88
26. Kuroiwa T, Seida M, Tomida S, Hiratsuka H, Okeda R, Inaba Y. Discrepancies among CT, histological, and blood brain barrier findings in early cerebral ischemia.J Neurosurg1986;65:517–524 27. Moulin T, Cattin F, Crepin-Leblond T, et al.Early CT signs in
acute middle cerebral artery infarction: predictive value for
subse-quent infarct locations and outcome.Neurology1996;47:366 –375 28. Rother J, Jonetz-Mentzel L, Fiala A, et al.Hemodynamic
assess-ment of acute stroke using dynamic single-slice computed tomo-graphic perfusion imaging.Arch Neurol2000;57:1161–1166 29. Ko¨nig M, Klotz E, Luka B, Venderink DJ, Spittler JF, Heuser L.
Perfusion CT of the brain: diagnostic approach for the early de-tection of ischemic stroke.Radiology1998;209:85–93
30. The NINDS t-PA Stroke Study Group.Intracerebral hemorrhage after intravenous t-PA therapy for ischemic stroke. Stroke
1997;28:2109 –2118
31. Hacke W, Kaste M, Fieschi C, et al.Intravenous thrombolysis with recombinant tissue plasminogen activator for acute hemispheric stroke. The European Cooperative Acute Stroke Study (ECASS). JAMA1995;274:1017–1025
32. Mohr JP, Biller J, Hilal SK, et al. Magnetic resonance versus computed tomographic imaging in acute stroke. Stroke
1995;26:807– 812
33. Lutsep HL, Albers GW, DeCrespigny A, Kamat GN, Marks MP, Moseley ME.Clinical utility of diffusion-weighted magnetic reso-nance imaging in the assessment of ischemic stroke.Ann Neurol
1997;41:574 –580
34. Lansberg MG, Norbash AM, Marks MP, Tong DC, Moseley ME, Albers GW. Advantages of adding diffusion-weighted magnetic resonance imaging to conventional magnetic resonance imaging for evaluation of acute stroke.Arch Neurol2000;57:1311–1316 35. Lansberg MG, Albers GW, Beaulieu C, Marks MP.Comparison of
diffusion-weighted MRI and CT in acute stroke. Neurology
2000;54:1557–1561