664
Enhancing Patterns in Multiple Sclerosis:
Evolution and Persistence
Juan He, Robert I. Grossman, Yulin Ge, and Lois J. Mannon
BACKGROUND AND PURPOSE: Contrast enhancement on MR images of patients with
multiple sclerosis (MS) is known to be associated with abnormalities of the blood-brain barrier (BBB). However, little is known about diagnostic patterns and common features of enhanced MS lesions. This study was designed to evaluate initial enhancement patterns, changes in these enhancing patterns, and duration of enhancement in a cohort of patients with MS.
METHODS: Twenty-five patients with clinically definite MS were studied retrospectively.
The appearance of enhancing lesions and sequential changes in the appearance on axial con-trast-enhanced spin-echo images were evaluated. The enhancing lesions were classified as nod-ular, ringlike, or ‘‘other’’ (eg, arclike).
RESULTS: Of 301 new enhancing lesions, 205 (68%) showed nodular enhancement, 70 (23%)
a ring pattern, and 26 (9%) a pattern neither nodular nor ringlike (eg, arclike). Two hundred eighty (93%) of 301 enhancing lesions disappeared within 6 months, and seven (2%) lesions showed persistent enhancement longer than 6 months. The other 14 (5%) lesions, which dis-appeared by the time of the next scan, were excluded, because the course between two exam-inations was longer than 6 months. Of nine persisting nodular enhancing lesions on the follow-up images, seven were decreased in size, whereas all of two persisting ringlike enhancing lesions on the follow-up images were larger than before.
CONCLUSION: Nodular enhancement is the predominant enhancement pattern for new MS
lesions, and the temporal course of enhancement is usually shorter than 6 months. The appre-ciation of the evolution of MS-enhanced lesions aids in both identifying new MS lesions and distinguishing these lesions from other pathologic entities. This may be helpful in clinically evaluating the stage of MS lesions.
MR imaging is the most sensitive technique for detecting multiple sclerosis (MS) lesions in vivo throughout the CNS. It has an established role in diagnosis and has also been used to investigate the natural course of the disease (1–3). Contrast-en-hanced MR imaging is sensitive in detecting ab-normalities of the blood-brain barrier (BBB) (4). Several authors have suggested that contrast-en-hanced MR imaging is very sensitive to the acute inflammatory phase of MS lesion development and detects disease activity five to 10 times more fre-quently than does clinical evaluation of relapses (5, 6) or T2-weighted MR imaging (1, 7). Serial con-trast-enhanced MR imaging studies have provided researchers with a better understanding of the nat-ural history of MS and insight into treatment trials.
Supported in part by grant NS29029 from NIH.
Address reprints requests to Robert I. Grossman.
qAmerican Society of Neuroradiology
Previous studies have reported sizes and numbers of enhancing lesions (8, 9). This study focuses on the longitudinal morphology of new MS lesions. Specifically, we evaluate 1) initial enhancement patterns of MS lesions, 2) changes in enhancement patterns, and 3) duration of enhancement.
Methods
From the patients with clinically definite MS in our long-term National Institutes of Health–funded MS study, we stud-ied 25 patients (five men and 20 women; ages, 28 to 66 years) who had at least one definite enhanced MS lesion during the follow-up period. All patients satisfied the Poser diagnostic criteria for MS (10) and had not been treated. Eighteen patients had a relapsing-remitting course, and seven had a secondary progressive course. Informed consent for MR imaging was ob-tained from all subjects.
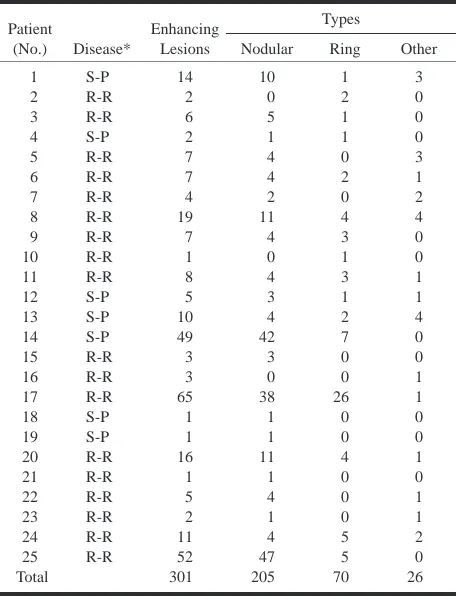
TABLE 1: Pattern of enhanced MS lesions Patient (No.) Disease* Enhancing Lesions Types
Nodular Ring Other
1 2 3 4 5 6 7 8 9 10 11 12 13 14 15 16 17 18 19 20 21 22 23 24 25 Total S-P R-R R-R S-P R-R R-R R-R R-R R-R R-R R-R S-P S-P S-P R-R R-R R-R S-P S-P R-R R-R R-R R-R R-R R-R 14 2 6 2 7 7 4 19 7 1 8 5 10 49 3 3 65 1 1 16 1 5 2 11 52 301 10 0 5 1 4 4 2 11 4 0 4 3 4 42 3 0 38 1 1 11 1 4 1 4 47 205 1 2 1 1 0 2 0 4 3 1 3 1 2 7 0 0 26 0 0 4 0 0 0 5 5 70 3 0 0 0 3 1 2 4 0 0 1 1 4 0 0 1 1 0 0 1 0 1 1 2 0 26
* R-R: relapsing-remitting MS; S-P: secondary progressive MS.
TABLE 2: Changes of persistent, enhanced lesions
Patient Disease* Enhancing Pattern Entry Exit Changes in Size Interval† (mos) 8 17 25 25 25 17 20 1 19 14 14 R-R R-R R-R R-R R-R R-R R-R S-P S-P S-P S-P Ring Ring Nodular Nodular Nodular Nodular Nodular Nodular Nodular Nodular Nodular Ring Ring Nodular Nodular Nodular Nodular Nodular Nodular Nodular Nodular Ring Increasing Increasing Increasing Decreasing Decreasing Decreasing Decreasing Decreasing Decreasing Decreasing · · · 6.0 6.5 2.5 2.5 6.0 4.5 3.0 6.5 7.0 6.0 6.0
* R-R: relapsing-remitting course; S-P: secondary progressive course. † The time between two examinations.
At least three MR scans were obtained from each patient during the observation period. We followed up at least twice when we found one enhanced lesion. The time between two MR examinations was 2 to 12 months; this interval was 6 months in 90% of examinations.
The presence and appearance of enhancing lesions on T1-weighted postcontrast images were identified directly from the computer screen. For the purpose of this report, the precontrast T1-weighted and T2-weighted images were used only to help confirm the presence of an enhancing lesion. New enhancing lesions were defined as lesions that did not appear on a pre-vious contrast-enhanced examination.
The enhancing lesions were divided into three groups: nod-ular, ringlike, and other (eg, arclike). Sequential changes in the appearance of lesions were also monitored.
Results
One hundred forty-one contrast-enhanced MR scans were obtained from 25 patients. Most en-hancing lesions were easily recognized as areas of increased signal intensity in the white matter on T1-weighted images. Questionable, small areas of enhancement near the cortical surface were exclud-ed from the analysis.
Excluding lesions that enhanced on the first and last scan and for which the total duration of hancement could not be calculated, 301 new en-hancing lesions were identified. Two hundred eighty (93%) of 301 enhancing lesions disappeared within 6 months; seven (2%) lesions persisted in enhancing longer than 6 months. The other 14 (5%) lesions, which disappeared by the time of the next scanning period, were excluded because the course between two examinations was longer than 6 months.
Among the 301 new enhancing lesions, 205 le-sions (68%) showed nodular enhancement, 70 (23%) showed ringlike enhancement, and 26 (9%) revealed other patterns, such as arcs or one small point in the center of the ring (Table 1).
Of the 205 nodular, enhancing lesions, one was observed increasing in size on 2.5-month follow-up images, seven were decreased on 2.5- to 7-month follow-up images, and one lesion converted to a ringlike lesion after 6 months (Fig 1). Of 70 ringlike, enhancing lesions, only two lesions en-larged after 6 and 6.5 months, respectively (Table 2). All others (196 nodular, 68 ringlike, and 26 ‘‘other’’) disappeared by the time of the next ex-amination (Fig 2).
Discussion
[image:2.612.61.544.572.720.2]the brain, based primarily on MR imaging and neu-ropathologic studies, is now understood to include evolution from an acute inflammatory lesion to a relatively stable, smaller lesion with variable amounts of tissue damage (12). Neuropathologic correlation studies have established that MR en-hancement corresponds to areas of transient im-pairment of BBB associated with inflammatory in-filtration (13). Enhancing lesions are increasingly important outcome measures in natural history studies, as they provide a direct, quantitative as-sessment of identifying active disease and distin-guish new versus old lesions by identifying areas of BBB breakdown. Longitudinal MR studies re-veal that subsequent to the first appearance of acute, enhancing MS lesions in the brain, these le-sions undergo a series of characteristic changes over periods of days to months (12). To our knowl-edge, this present report represents the largest his-torical study of enhanced MS lesions, and provides a basis for understanding the natural history of en-hancement in MS lesions.
Guttmann et al (14) conducted a serial study of five patients with relapsing-remitting MS in the course of 1 year, and indicated that the majority of the new enhancing lesions were of the nodular pat-tern. In the course of their evolution, the general trend was one of transition from an earlier nodular to a predominantly ringlike pattern. The ringlike, enhanced pattern was significantly more frequent at time points longer than 29 days after initial imaging.
In our study, we followed up 301 enhanced MS lesions from 25 MS patients. The vast majority of new enhancing lesions showed nodular enhance-ment (68%), 23% showed ringlike enhanceenhance-ment, and 9% demonstrated other patterns, such as arcs. For the ringlike, enhanced lesions (23%), we can-not confirm whether these lesions had changed from an initial nodular pattern. In the majority of our cases, the previous scan had been obtained 6 months earlier, exceeding the 29-day time points cited by Guttmann et al (14). Among the persistent enhancing lesions, however, we observed the con-version from nodular to ringlike pattern, but not from ringlike to nodular pattern, suggesting that the initial enhancing pattern was nodular.
The enhancement pattern is likely related to the histologic age of the MS plaque. Histologically, MS plaque types can be divided into acute, chron-ic-active, chronic-inactive, and ‘‘shadow’’ plaques (14). Edema, myelin swelling, macrophage infiltra-tion, lymphocyte infiltrainfiltra-tion, and endothelial cell activation are evident in acute plaques. Although chronic-active plaques are histologically older than acute ones, myelin breakdown is still ongoing, with foamy macrophages actively removing and digest-ing myelin. The chronic-active plaque margin is broad and markedly hypercellular, owing to paren-chymal infiltrates, oligodendroglial hyperplasia, hypertrophic astrocytes, and abundant macrophag-es. The center of the plaque can be identical to that
of the chronic silent plaque (15–16). Ringlike en-hancement probably arises from recent inflamma-tion at the periphery of a chronic-active lesion in which the BBB defect has been partly or complete-ly repaired centralcomplete-ly (17). It is noted that occasion-ally the ongoing activity affects one margin of a plaque and the remainder is quiescent, which may be a cause of the formation of the arc pattern.
From the evolution of the persistent enhancing lesions detected in this study, we found that nodular enhancement tended to change from a larger to a smaller size (ie, in seven of nine), except for one that increased in size and one that converted to a ringlike lesion. In contrast, all lesions of ringlike enhancement (two of two) converted from smaller to larger rings. Publications (11, 18, 19) concerning the correlation between enhancement pattern and magnetization transfer ratio (MTR) suggest the nodular enhancing lesions have the highest MTR. This could be the result of early inflammatory re-sponse, leading, in most cases, to isointense le-sions, probably without significant matrix destruc-tion. Conversely, the central portion of the ringlike, enhancing lesions had the lowest MTR, possibly reflecting a high degree of matrix destruction. Ro-vira et al (19) found that more than half of ringlike, enhancing lesions change to areas of hypointense nonenhancement on T1-weighted images, and these hypointense lesions have been thought to represent chronic plaques with severe demyelination or ax-onal loss (19). In addition, changes in size of the ringlike, enhancing lesions in our patients support the belief that demyelination occurs from the center outward (11, 20, 21).
A serial MR study (22) of 8 to 11 months’ du-ration in six patients with relapsing-remitting MS showed that 95% of new enhancing lesions reveal persistent contrast enhancement in a period shorter than 8 weeks. No lesions consistently enhanced for more than 16 weeks.
Our results confirm and extend these findings. The vast majority of lesions (90%) enhance for no more than 6 months, most under 6 months, sug-gesting that the abnormality of the BBB is a tran-sient phenomenon. Over a short period, visually conspicuous contrast enhancement decreases, even-tually completely. This seems to correspond to res-toration of the integrity of the BBB (12).
FIG1. Patient 14. Secondary progressive MS. Axial contrast-enhanced T1-weighted MR image (600/27/1 [TR/TE/excitation]).
A, No enhanced lesion can be seen on image 6 months prior to follow-up.
B, A new, nodular, enhanced MS lesion appears 6 months later.
C, After 6 months, the pattern of nodular enhancement converts to a ringlike pattern.
D, After another 6 months, the ringlike, enhanced lesion cannot be seen.
occasionally, BBB abnormalities may persist for a longer time, even in secondary progressive MS (28). This phenomenon may be either an epiphe-nomenon or associated in a minor way with pathophysiology.
Contrast-enhanced MR imaging appears to be a sensitive method for detecting active MS lesions. But lesion activity should not be equated with en-hancement; more activity is taking place than just that defined by enhancement. The BBB abnormal-ity is transient; it becomes less important over time. It is unlikely that all the inflammatory changes only occur in this temporary period of enhancement. In-flammatory changes in MS are not always detected by enhancement, particularly when the level of in-flammation is low. Nesbit et al (29) suggested that the breakdown of the BBB in MS might be related to macrophage migration and infiltration, but the association is weaker with perivascular lymphocyte infiltration. Some evidence of inflammatory activ-ity is a common finding, albeit at a low grade and affecting a few vessels only, even in silent-appear-ing MS lesions. Such activity comprises a few
small lymphocytes, numerous plasma cells, large mononuclear cells, and the occasional mast cell. Furthermore, for the secondary progressive and pri-mary progressive stages, and for the abnormalities in normal-appearing white matter with MS, de-creasing levels of enhancement and/or little en-hancement are observed in spite of increasing neu-rologic deficits, also suggesting a diminished role of the BBB abnormality indicated by contrast en-hancement (1).
FIG 2. Patient 17. Relapsing-remitting MS. Axial contrast-enhanced T1-weighted MR image (600/27/1).
A, Two new nodular, enhanced MS lesions.
B, After 4.5 months, the nodular, en-hanced lesions disappear.
after single-dose injection (31). Triple-dose con-trast-enhanced MR imaging may detect subtle BBB damage (32). Although it has been reported that contrast-enhanced examination is helpful for de-tecting a treatment effect in MS patients over short-er pshort-eriods of time, enhancement may not be a good measurement of how effective a drug is. The effect of drugs should be monitored over a longer time course, and drugs can act at other levels besides BBB.
Conclusion
The enhancement of MS lesions on T1-weighted images may be in the form of nodules, rings, or other patterns. Nodular enhancement is the pre-dominant pattern for new MS lesions, whereas ringlike enhancement appears to be a secondary pattern. The course of enhancement is transient and usually is shorter than 6 months; rarely it may per-sist for a longer time. The appreciation of the evo-lution of MS-enhanced lesions aids in both identi-fying new MS lesions and distinguishing these lesions from other pathologic entities. This may be helpful in clinically evaluating the stage of MS lesions.
References
1. Grossman RI, McGowan JC. Perspectives on multiple sclerosis. AJNR Am J Neuroradiol 1998;19:1251–1265
2. Fazekas F, Barkhof F, Filippi M, et al. The contribution of mag-netic resonance imaging to the diagnosis of multiple sclerosis. Neurology 1999;53:448–456
3. Miller DH, Grossman RI, Reingold SC, McFarland HF. The role of magnetic resonance techniques in understanding and man-aging multiple sclerosis. Brain 1998;121:3–24
4. Simon JH. Contrast-enhanced MR imaging in the evaluation of treatment response and prediction of outcome in multiple sclerosis. J Magn Reson Imaging 1997;7:29–37
5. Miller DH, Albert PS, Barkhof F, et al. Guidelines for the use of magnetic resonance techniques in monitoring the treatment of multiple sclerosis. Ann Neurol 1996;39:6–16
6. Barkhof F, Scheltens P, Frequin ST, et al. Relapsing-remitting multiple sclerosis: sequential enhanced MR imaging vs clinical findings in determining disease activity. AJR Am J Roentgenol 1992;159:1041–1047
7. Thompson AJ, Kermode AG, Wicks D, et al. Major differences in the dynamics of primary and secondary progressive mul-tiple sclerosis. Ann Neurol 1991;29:53–62
8. Koudriavtseva T, Thompson AJ, Fiorelli M, et al. Gadolinium enhanced MRI predicts clinical and MRI disease activity in relapsing-remitting multiple sclerosis. J Neurol Neurosurg Psy-chiatry 1997;62:285–287
9. Filippi M, Rocca MA, Horsfield MA, Comi G. A one year study of new lesions in multiple sclerosis using monthly gadolinium enhanced MRI: Correlations with changes of T2 and magne-tization transfer lesion loads. J Neurol Sci 1998;158:203–208 10. Poser CM, Paty DW, Scheinberg L. New diagnostic criteria for
multiple sclerosis: guidelines for research protocols. Ann Neurol 1983;13:227–231
11. Petrella JR, Grossman RI, McGowan JC, Campbell G, Cohen JA. Multiple sclerosis lesions: relationship between MR enhance-ment pattern and magnetization transfer effect. AJNR Am J Neuroradiol 1996;17:1041–1049
12. Simon JH. From enhancing lesions to brain atrophy in relaps-ing MS. J Neuroimmunol 1999;98:7–15
13. Kappos L, Moeri D, Radue WE, et al. Predictive value of gad-olinium-enhanced magnetic resonance imaging for relapse rate and changes in disability or impairment in multiple sclerosis: a meta-analysis. Lancet 1999;353:964–969
14. Guttmann CRG, AHN SS, Hsu L, Kikinis R, Jolesz FA. The evo-lution of multiple sclerosis lesions on serial MR. AJNR Am J Neuroradiol 1995;16:1481–1491
15. Hickey WF. The pathology of multiple sclerosis: a historical perspective. J Neuroimmunol 1999;98:37–44
16. Raine CS. Part two—neuropathology and etipathogenesis. In: Raine CS, McFarland HF, Tourtellotte WW, eds. Multiple Scle-rosis: Clinical and Pathogenic Basis. London, New York: Chap-man & Hall Medical;1997:159–170
17. Bastianello S, Pozzilli C, Bernardi S, et al. Serial study of gad-olinium-DTPA MRI enhancement in multiple sclerosis. Neu-rology 1990;40:591–595
18. Filippi M, Rocca MA, Sormani MP, Pereira C, Comi G. Short-term evolution of individual enhancing MS lesions studied with magnetization transfer imaging. Magn Reson Imaging 1999;17: 979–984
19. Rovira A, Alonso J, Cucurella G, et al. Evolution of multiple sclerosis lesions on serial contrast-enhanced T1-weighted and magnetization-transfer MR images. AJNR Am J Neuroradiol 1999;20:1939–1945
20. Dousset V, Grossman RI, Ramer KN, et al. Experimental allergic encephalomyelitis and multiple sclerosis: lesion characteriza-tion with magnetizacharacteriza-tion transfer imaging. Radiology 1992;182: 483–491
21. Hiehle JF, Grossman RI, Ramer KN, Gonzalez-Scarano F, Cohen JA. Magnetization transfer effects in MR-detected multiple sclerosis lesions: comparison of gadolinium-enhanced spin-echo images and nonenhanced T1-weighted images. AJNR Am J Neuroradiol 1995;16:69–77
scans in patients with early, relapsing-remitting multiple scle-rosis: implications for clinical trials and natural history. Ann Neurol 1991;29:548–555
23. Kwon EE, Prineas JW. Blood-brain barrier abnormalities in longstanding multiple sclerosis lesions. An immunohistochem-ical study. J Neuropathol Exp Neurol 1994;53:625–636 24. Claudio L, Raine CS, Brosnan CF. Evidence of persistent
blood-brain barrier abnormalities in chronic-progressive multiple sclerosis. Acta Neuropathol 1995;90:228–238
25. Gonzalez-Scarano F, Grossman RI, Galetta S, Atlas SW, Silber-berg DH. Multiple sclerosis disease activity correlates with gadolinium enhanced magnetic resonance imaging. Ann Neurol 1987;21:300–306
26. Barnes D, Munro PMG, Youl BD, Prineas JW, McDonald WI. The longstanding MS lesion. A quantitative MRI and electron microscopic study. Brain 1991;114:1271–1280
27. Filippi M, Rossi P, Campi A, Colombo B, Pereira C, Comi G. Serial contrast-enhanced MR in patients with multiple
scle-rosis and varying levels of disability. AJNR Am J Neuroradiol 1997;18:1549–1556
28. Rosenblum D, Saffir M. The natural history of multiple scle-rosis and its diagnosis. Phys Rehabil Clin N Am 1998;9:537–549 29. Nesbit GM, Forbes GS, Scheithauer BW, Okazaki H, Rodriguez M. Multiple sclerosis: histopathologic and MR and/or CT cor-relation in 37 cases at biopsy and three cases at autopsy. Ra-diology 1991;180:467–474
30. Filippi M, Yousry T, Campi A, et al. Comparison of triple dose versus standard dose gadolinium-DTPA for detection of MRI enhancing lesions in patients with MS. Neurology 1996;46: 379–384
31. Rovaris M, Mastronardo G, Prandini F, Bastianello S, Comi G, Filippi M. Short-term evolution of new multiple sclerosis le-sions enhancing on standard and triple dose gadolinium-en-hanced brain MRI scans. J Neurol Sci 1999;164:148–152 32. Rovaris M, Rodegher M, Comi G. Filippi M. Correlation