6
A Fu t u r e U s e r In t e r f a c e f o r t h e
Flu k e P o w e r Q u a lit y A n a ly z e r
Th e d e s ig n o f J o b A s s is t a n c e f e a t u r e s a n d
To u c h S c r e e n f u n c t io n a lit y f o r P o w e r Fa c t o r A n a ly s is
Bac helo r Thesis Philip Jansen Oc to b er 10, 2011
University o f Tw ente Fac ulty o f Eng ineering Tec hno log y Ind ustrial Desig n Eng ineering
Po st offic e b ox 217 7500 AE Ensched e The N etherlands
Benc hm ark Elec tro nic s B.V.
Lelyw eg 10 7602 EA Alm elo The N etherlands
Chairm an o f the exam c om m ittee p ro f.d r.ir. A. d e Bo er
M ento r at University o f Tw ente ir. A.P. van d en Beukel
7
P r e f a c e
Carrying out this project at Benchmark Almelo has been a unique and valuable learning experience. The people I was around were always very kind to me and the atmosphere was excellent. I really have had a most memorable time.
While I have enjoyed the company environment, there would be little truth in saying things went smooth process-wise. Getting familiar with the subject matter was anything but easy: I have found it difficult to get a good grasp of the abstract concepts that comprise power quality, power factor and user interface design. Moreover, this project confronted me with the fact that I am an awful planner. I have spent far too much time in the orientation phase, wasting it by delving deep into topics that were essentially of lesser relevance. I did not have a good perspective on the project for most of the time.
As anyone reading it entirely may probably notice, I was in a bit of a hurry to finish the report. The quality of many sections, especially the latter ones, is not as I would have wished. On a positive note, however, I am quite satisfied with the final design concept I have created. There is much to improve upon, but in the end I think I have made a meaningful contribution to Benchmark and Fluke.
I would like to thank everyone who provided me with assistance throughout this project. In particular, I wish to thank the following people:
Christian Suurmeijer, for offering his guidance and support throughout the project, and for his cheerfulness and encouraging words.
Maarten van Alphen, for sharing his knowledge and expertise, and for often being available at a moment’s notice.
8
C o n t e n t s
C O N TEN TS __________________________________________________________________________ 8
1 IN TRO D U C TIO N _______________________________________________________________ 10
2 B A C K G RO U N D ________________________________________________________________ 12
2.1 FLUKE CORPORATION _______________________________________________________________ 12
2.1.1 Fluke Products ________________________________________________________________ 12 2.1.2 The Almelo Facility ____________________________________________________________ 14
2.2 THE POWER QUALITY ANALYZER ________________________________________________________ 15
2.2.1 Power Quality Defined __________________________________________________________ 15 2.2.2 Power Quality Consulting _______________________________________________________ 16 2.2.3 Fluke Power Quality Products ____________________________________________________ 17 2.2.1 An Overview of Thor ___________________________________________________________ 18
2.3 THE SIGNIFICANCE OF POWER FACTOR ____________________________________________________ 20
2.3.1 Power Factor Explained _________________________________________________________ 20 2.3.2 The Costs of a Low Power Factor __________________________________________________ 22 2.3.3 How to Correct a Low Power Factor _______________________________________________ 23 2.3.4 Power Factor Consulting ________________________________________________________ 25 2.3.5 An Overview of Donar __________________________________________________________ 25
3 P R O B L EM D ESC R IP TIO N ____________________________________________________ 2 7
4 D ES IG N A N A L YSIS ___________________________________________________________ 2 8
4.1 AN OVERVIEW OF POWER FACTOR SOLUTIONS _______________________________________________ 28
4.1.1 Power factor Correction Methods _________________________________________________ 28 4.1.2 Power Factor Correction in the Presence of Harmonics ________________________________ 29
4.2 METHODS OF PROVIDING JOB ASSISTANCE __________________________________________________ 30
4.2.1 Setup Assistant _______________________________________________________________ 30 4.2.2 Interface Agent _______________________________________________________________ 30 4.2.3 Power Factor Expert System _____________________________________________________ 30
4.3 AN INTERVIEW WITH A CONSULTANT _____________________________________________________ 31
4.3.1 The Consultants Work Process ___________________________________________________ 31 4.3.2 The Difficulties Experienced ______________________________________________________ 33 4.3.3 Thoughts and Wishes related to job assistance ______________________________________ 33
4.4 THOR USER INTERFACE ______________________________________________________________ 34
4.4.1 Main Menu Layout ____________________________________________________________ 34 4.4.2 Controls and Screen Information __________________________________________________ 35 4.4.3 Functions for Power Factor Analysis _______________________________________________ 37
4.5 THE MARKET AND THE COMPETITION _____________________________________________________ 37
4.5.1 A Market Overview ____________________________________________________________ 37 4.5.2 An Overview of Competitors’ Offerings _____________________________________________ 38
5 FU N D A M EN TA L D ES IG N C O N SID ER A TIO N S ______________________________ 4 0
5.1 THE USER PROFILES ________________________________________________________________ 40 5.2 RESTRICTIONS ON THE HARDWARE _______________________________________________________ 41 5.3 NIELSEN’S USABILITY HEURISTICS ________________________________________________________ 41 5.4 TOUCH SCREEN-SPECIFIC GUIDELINES _____________________________________________________ 42
9
7 D ES IG N C O N C EP TS _________________________________________________________ 4 7
7.1 CONCEPT 1:“POWER TOUCH” _________________________________________________________ 47 7.2 CONCEPT 2:“POWER TAB” ___________________________________________________________ 49
8 FIN A L D ES IG N C O N C EP T ____________________________________________________ 5 1
8.1 PROCESS ________________________________________________________________________ 52 8.2 SCREEN LAYOUT ___________________________________________________________________ 53
8.3 INTERFACE SEQUENCE _______________________________________________________________ 54
9 R EQ U IREM EN TS VERIFIC A TIO N ____________________________________________ 6 0
10 C O N C L U SIO N S A N D REC O M M EN D A TIO N S _______________________________ 6 5
10.1 CONCLUSIONS ____________________________________________________________________ 65 10.2 RECOMMENDATIONS ________________________________________________________________ 65
B IB L IO G R A P H Y ___________________________________________________________________ 6 6
A P P EN D IX A – B EN C H M A R K EL EC TR O N IC S __________________________________ 6 8
A P P EN D IX B – W A YS O F H O L D IN G TH E A N A L YZ ER __________________________ 7 0 A P P EN D IX C – ID EA TIO N S K ETC H ES ____________________________________________ 7 1
10
1
In t r o d u c t io n
In this era of electric power liberalization and energy conservation efforts, the concept of “power quality” is becoming increasingly important. Electronic test tools manufacturer Fluke Corporation creates sophisticated portable instruments that can measure the quality of electric power in power distribution systems. Power Quality Analyzers, as they are called, are used by electric engineers to troubleshoot power problems and maintain power systems at industrial, office and public locations.
Fluke is a market leader and strives to maintain its position through innovation. On behalf of Fluke, contract manufacturer Benchmark Electronics, is searching for new design concepts for a future Power Quality Analyzer’s user interface. Benchmark would like to see a future user interface support comprehensive “job assistance” features that make the user’s work tasks less demanding, more efficient and more convenient. These job assistance features should primarily be aimed at making the instrument more accessible to blue-collar electrical technicians. Benchmark reasons that with an enriched target user group, Fluke will be able to sell more Analyzers.
In addition, Benchmark wishes the design to feature touch screen functionality. Some of Fluke’s competitors already use it in their products. The benefits of using touch screen technology include larger screen sizes, higher durability, and generally more usable interfaces. Furthermore, touch screen technology could help facilitate the deployment of job assistance features.
To limit the scope of this project the user interface should be specifically devised for power
factor analysis. Power factor is an indicator of the efficiency of a power distribution system.
Many businesses deal with power distribution systems that have low power factors, and are incurring significant financial losses as a result. Power factor analysis is an important aspect in reducing the cost of energy of these businesses. Benchmark regards it as an excellent vehicle to showcase a user interface’s support of job assistance features with.
The goal of this project is to aid Benchmark in its development of future Power Quality Analyzers for Fluke, by creating and evaluating a design concept of a novel, more
user-friendly user interface for a future Power Quality Analyzer. This user interface should (1)
support comprehensive job assistance features that help electrical technicians in performing power factor analyses, (2) have touch screen controls and (3) be economically feasible five years from now. The concept is to offer useful insights for further development of user interfaces that support comprehensive job assistance features and touch screen controls.
12
2
B a c k g r o u n d
The sophistication nature of the Power Quality Analyzer and the complicated concepts that relate to it, necessitate the discussion of a fair bit of background information before a proper description of the assignment’s problem can be given. In this chapter Fluke Corporation and its products will be introduced; the Power Quality Analyzer and concepts of power quality will be discussed; and the future product positioning change of the Power Quality Analyzer and the fundamentals of power factor will be explained. In the next chapter the problem description will be presented.
A company profile of Benchmark Electronics is provided in Appendix A.
2 .1
Flu k e C o r p o r a t io n
Fluke Corporation is an American multinational company that designs, manufactures and markets electronic industrial test and measurement tools and software. Started by the late John Fluke, Sr. in 1948, it is a wholly owned subsidiary of Danaher Corporation since 1998. Danaher is a large diversified technology company headquartered in Washington, D.C.
Fluke’s products include various types of digital multimeters, portable oscilloscopes, power quality analyzers, thermal imagers, calibration instruments, air quality meters, vibration testers and other specific test and measurement tools (Fig. 1). They mainly serve blue-collar professionals in the fields of production, maintenance, installation and engineering, who use them to measure, generate and make sense of electrical and other kinds of physical phenomena.
Fluke operates according to the following mission statement (Fluke Corporation, n.d.): “Fluke’s mission is to be the leader in compact, professional electronic test tools.”
The company maintains 21 offices worldwide, employing some 2,400 people. It runs manufacturing operations in the United States, the United Kingdom and China, while its headquarters are in Everett, Washington.
2 .1.1 Flu k e P r o d u c t s
While many of them may not be considered “handheld”, Fluke’s products are generally praised for their portability. Much effort goes into making the devices as compact as they can be, since most are intended for field applications that require them to be carried around with ease.
13 Sixty-three years after its foundation, Fluke has become a well-established leader in the test and measurement industry. Product innovation is considered to be an essential component to its success. The company strives to be at the forefront of technological development and is committed to trying to understand exactly what their customers’ needs are. It has introduced such innovative products as a vibration tester that uses sophisticated diagnostic technology (Fig. 2), and a multimeter that conveniently comes with a detachable display (Fig. 3)—allowing the device to be operated from a distance. In the past five years, Fluke’s tools have won more than 50 industry awards (Fluke Corporation, n.d.).
14 Figure 2: Fluke 810 Vibration Tester Figure 3: Fluke 233 Remote Display
Multimeter
2 .1.2 Th e A lm e lo Fa c ilit y
From 1993 until 1999, the Almelo division of Benchmark operated under the banner of Fluke and was named the Almelo Industrial Center (AIC). The AIC planned, designed and manufactured Fluke branded industrial test and measurement tools. It formed the basis of the company’s Diagnostic Tools Division. As such, its focus was on the development of a successful line of portable oscilloscopes, called ScopeMeter (Fig. 4, Fig. 5).
Figure 4: A recent ScopeMeter product (Fluke 190-202) Figure 5: Assorted Fluke ScopeMeters
Portable oscilloscopes are handheld test instruments that can graphically present the cyclical course of an electrical signal through time. They are used as multi-purpose diagnostic tools in the production and service of electrical and electronic equipment.
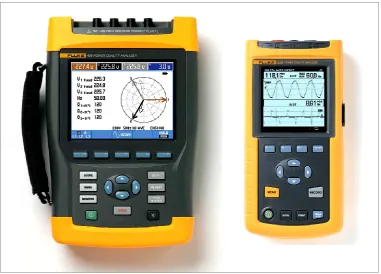
15 productive relations with Fluke.1 Since 1999, it has been producing Power Quality Analyzers in addition to ScopeMeters (Fig. 6). At a glance, these devices appear very similar to ScopeMeters. In fact, however, they are fundamentally different devices in terms of functional capabilities.
Figure 6: Two of Fluke’s Power Quality Analyzers
2 .2
Th e P o w e r Q u a lit y A n a ly z e r
Fluke’s Power Quality Analyzers are portable, professional tools that can measure a number of electrical parameters indicative of power quality in power distribution systems. They are used primarily to troubleshoot power problems and maintain power systems at industrial, office and public locations. Their users may include electrical technicians, engineers and scientists.
2 .2 .1 P o w e r Q u a lit y D e f in e d
Power quality is defined as the degree to which the delivery and utilization of electric power affect the performance of electrical systems (Ryan, 1996). The term is used to describe electric power in alternating current (AC) power distribution systems. Any deviation to the ideal sinusoidal voltage waveform shape can be regarded as a power
quality disturbance (Ryan, 1996).
Power quality disturbances can originate at the side of the electricity consumer, in power distribution systems and electrical loads, or at the side of the electric utility, in electricity
1
16 generators, power transmission systems and power distribution systems. Potential power quality culprits may include lightning, large equipment starting up or shutting down, improper electric wiring and grounding, and overloaded electric circuits. Often, the exact causes are quite elusive.
Disturbances are classified into different categories, such as sags, swells,
under-/overvoltage, harmonic distortion, noise, and transients (Fig. 7). Depending on their
[image:12.595.73.528.246.457.2]magnitude and duration—and importantly, the affectability of the electrical systems involved—they have consequences of varying severity. In Europe, the EN 501602 norm provides limits and tolerances, beyond which the disturbances may be considered unacceptable.
Figure 7: Typical waveform shapes of a sag, a swell, undervoltage, noise, harmonic distortion, and a transient
2 .2 .2 P o w e r Q u a lit y C o n s u lt in g
Businesses have strong incentives to manage the quality of their power. Electric power that is of insufficient quality can cause electrical equipment to malfunction, fail prematurely or not even work from the outset—microelectronics are especially vulnerable in this regard. It can also lead to reduced power efficiency, which may drive up energy costs. In 2007, poor power quality was estimated to be costing European business over €150 billion per year (Leonardo Energy, 2008).
When unable to solve their power quality troubles by themselves, businesses will enlist the help of power quality consultants. These specialist electrical engineers are typically employed by power quality consultancies, electrical contractors, and electric utilities. They will conduct on-site investigations into the power quality problems of their clients, using power quality analyzers. The investigations will generally result in recommendations of
2
17 power quality solutions, which often entail the installation of power quality protection
equipment at the customer’s premises.3
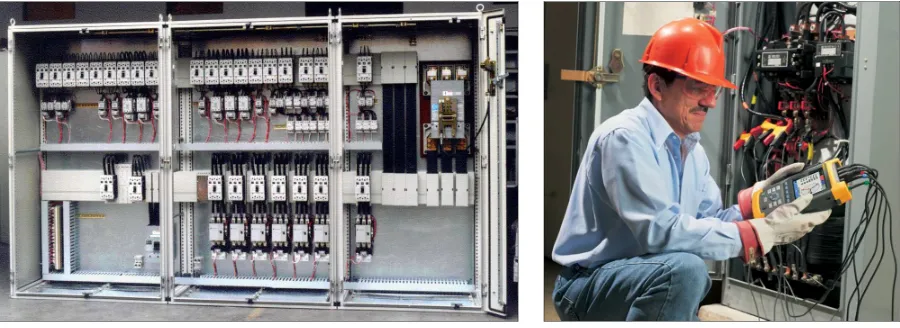
[image:13.595.73.523.277.441.2]The power quality analyzer is an indispensable tool for any power quality consultant. It is greatly depended upon in locating, predicting, preventing and troubleshooting problems in power distribution systems. In operation, the device will typically be connected to the customer’s facility’s power distribution panel at the utility service entrance, by means of voltage leads and current clamps (Fig. 8, Fig. 9). It will record, monitor and analyze—often for an extensive period of time—various key power quality parameters according to the stringent IEC 61000-4-304 standard of measurement. Through its integrated LCD, the analyzer will provide measuring results and norm-referenced diagnostic information that will aid the power quality consultant in his analysis of the power quality issues he is confronted with.
Figure 8: A typical power distribution panel Figure 9: A power quality analyzer connected to the power distribution panel
2 .2 .3 Flu k e P o w e r Q u a lit y P r o d u c t s
Fluke’s Power Quality Analyzers are part of the company’s Power Quality Tools group of products. In addition to power quality analyzers, Fluke offers power quality loggers, power
quality recorders and power quality clamp meters. Since the launch of its first power quality
product in 1994, Fluke has steadily become a major participant in a large and growing market for power quality test and measuring equipment.
Fluke’s current line of Power Quality Analyzers consists of two products:
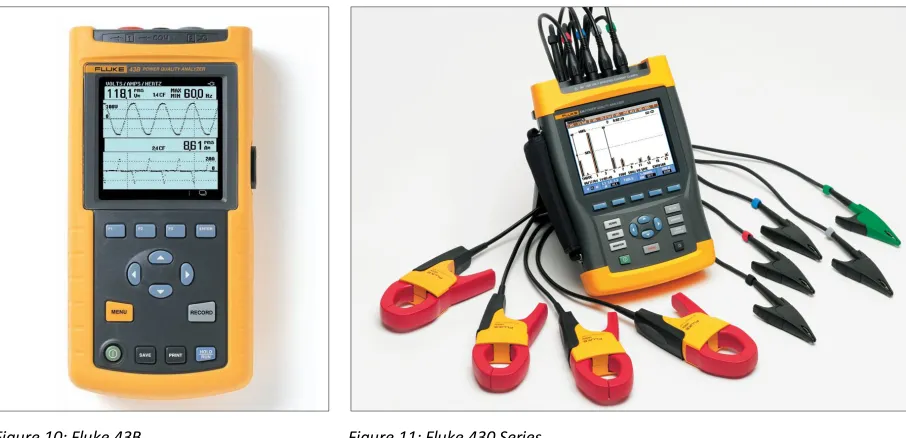
the 43B Single Phase Power Quality Analyzer (Fig. 10);
and the 430 Series Three Phase Power Quality Analyzer (Fig. 11);
3
Power quality protection equipment include surge suppressors, voltage regulators, power conditioners and
uninterruptable power supplies. 4
18 Figure 10: Fluke 43B Figure 11: Fluke 430 Series
Both have been developed at what is now Benchmark’s Almelo location. The “43B”, which has been in production since 2004,5 has only basic power quality analysis capabilities. It is designed to take single-phase6 measurements of electric systems and is used solely for troubleshooting and maintenance purposes. The “430 Series” offers more advanced functionality and improved measuring accuracy over the 43B. It comprises two models, the “434” and the “435”, which were introduced in 2006 and 2008, respectively. There are only minor differences between the two. Both allow measurements to be taken simultaneously on all three phases of three-phase7 electric systems and are intended to be used for an extended range of power quality analyzer purposes.
2 .2 .1 A n O v e r v ie w o f Th o r
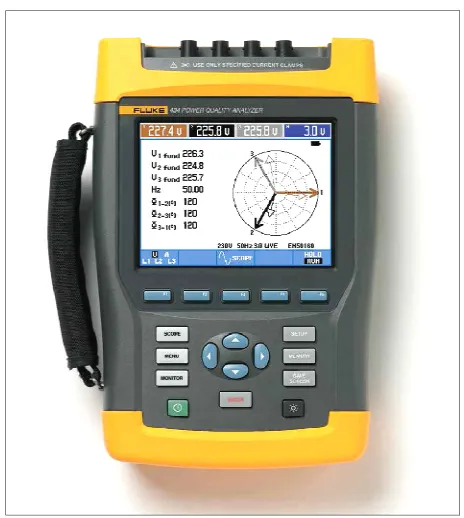
The Fluke 430 Series Three Phase Power Quality Analyzer, being the most recent finished product, was chosen as a basis for the design of new Power Quality Analyzer functions and user interface parts. Within Benchmark and Fluke it is codenamed “Thor”—after the hammer-wielding Norse god of thunder and lightning. This name seems fitting for an electrical device that exudes ruggedness, no-nonsense and authority through its general shape, exterior elements and color scheme.
Thor is described as a high-end power quality troubleshooter. It has four input channels for simultaneous measurement of voltages and currents on all four conductors of a three phase power distribution system; it features gapless sampling at a rate of 200 kS/s on each channel; and it can measure voltages up to 6 kV. By virtue of its 0.1 percent voltage
5
The 43B is but a slightly upgraded version of the “43”, which was introduced already in 1998.
6
The term “single-phase” refers to the distribution of alternating current electric power using a system in which the sinusoidal voltage waveforms on its circuit conductors are in phase with each other. The voltages on the circuit conductors thus vary in unison. A single-phase analyzer is designed to take measurements on one circuit conductor at a time.
7
19 accuracy, the 435 model is fully compliant with the very stringent “Class A” of the IEC 61000-4-30 standard of measurement.
Thor always automatically records all measuring results shown on its display, and offers the possibility to store them in its internal memory for future retrieval. The device can also be configured to automatically log over 400 power quality parameters at user defined intervals. When transferred to a pc with FlukeView analysis software installed, measurement data can be used to generate graphs and reports with.
The applications of Thor are listed as follows (Fluke Corporation, 2009):
frontline troubleshooting and predictive maintenance—analyzing a power system to quickly
locate, predict, prevent and troubleshoot power quality issues;
electrical load capacity verification—analyzing a power system to determine if it has
enough electrical capacity to handle proposed, additional electrical loads;
cost of energy assessment—analyzing a power system to quantify the electricity cost
reductions that can be achieved by taking certain measures;
incoming power quality validation—monitoring voltages at the utility service entrance to
determine whether the electric utility is the source of any power quality issues;
[image:15.595.112.344.388.647.2] and long-term and intermittent analysis—monitoring voltages and currents over long periods of time to uncover hard-to-find or intermittent power quality issues.
Figure 12: Thor exterior design
20 Thor meets the stringent 600 V CAT IV, and 1000 V CAT III, safety standards required for measurement at the utility service entrance.
2 .3
Th e s ig n if ic a n c e o f P o w e r F a c t o r
At Benchmark Almelo, a successor to Thor is currently being developed. This new product is in an early prototype stage and is due for launch in 2012. Officially dubbed the “430 Series II Three Phase Energy Analyzer”, it breaks with the present product naming tradition. The name change reflects a shift in emphasis within the product towards functionality for cost of energy assessment. Fluke will try to position its future three-phase analyzers more prominently as tools that help businesses make informed decisions on how to bring down the cost of their energy consumption. Considering ever-rising energy prices and increasing public awareness of energy efficiency, the company foresees a greater market demand for such products.
Poor energy efficiency in a power distribution system is not necessarily attributable to a power quality issue. Equipment such as motors, transformers, busbars and cables can be “at fault” in different ways. Very often the single major cause of inefficiency is excess power that is flowing through a power system when this system has what is known as a low
displacement power factor. Although it is associated with power quality, displacement
power factor is not normally considered a power quality parameter.
The instigation of the product positioning change means displacement power factor is currently receiving increased attention from Benchmark and Fluke.
2 .3 .1 P o w e r Fa c t o r Ex p la in e d
Displacement power factor—henceforth simply named power factor—is an indicator of the efficiency of an AC power distribution system. It is defined as the ratio of the active power, which is used by the electrical loads to perform work, to the apparent power, which is flowing through a power distribution circuit (reference); it is a dimensionless number between 0 and 1, or nil and unity. A power factor near unity is most desirable.
Strictly speaking, power factor is not a power quality parameter as it describes a relation between voltage and current, whereas power quality typically only relates to voltage.
Power factor is given by the formula:
=
| |
.
21 Power factor is a way of measuring the relative amount of reactive power in a power system. Reactive power (Q), measured in reactive volt-amperes (var), is that portion of the apparent power that results in no net transfer of energy to the loads over an AC cycle. It is power that is not used by the electrical loads to perform work, but instead is returned to the source. In a sense, it is wasted power—although many loads cannot do without it. The amount of reactive power in a power system is determined by the nature of the electrical loads.
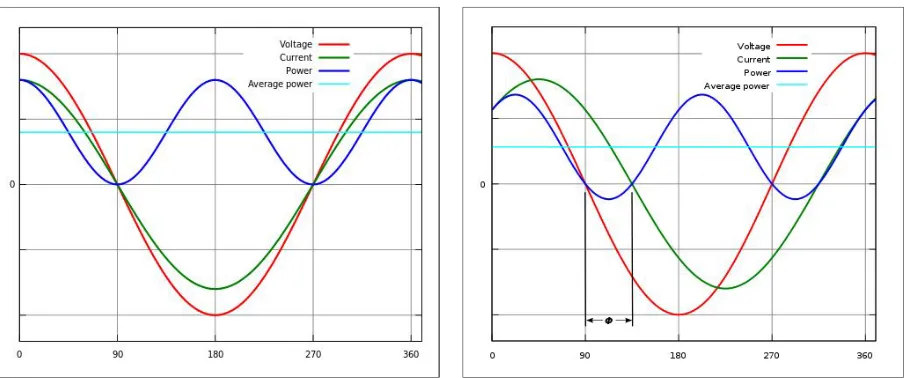
In an electric system with a purely resistive load, such as an electric heater, the voltage and current waveforms intersect the time axis at the same point (Fig. 14). As they are “in phase” with each other, the power waveform resulting from their product has only positive instantaneous values (Fig. XX). This indicates that, in each AC cycle, all of the power in the circuit is flowing in one direction, and is used to perform work in the load. Thus, in case of a purely resistive load, the active power equals the apparent power—resulting in a power factor of unity—and no reactive power is transferred.
Figure 13: Voltage, current and power waveforms with a purely resistive load
Figure 14: Voltage, current and power waveforms with a partially reactive load
With a partially reactive load, such as an electric motor, the voltage and current waveforms do not intersect the time axis at the same point (Fig. 15). A partially reactive load has a resistive and a reactive component. The reactive component consists of capacitive and or inductive elements, which, during part of the AC cycle, store some of the energy from the power circuit in their electric or magnetic fields, only to return this energy during the rest of the cycle. This causes a current to flow back and forth between the load and the power generator, asynchronous to the AC voltage—either “lagging” it or “leading” it by exactly 90°.
[image:17.595.73.525.305.494.2]22 is less than the apparent power—resulting in a power factor of between nil and unity—and reactive power is continuously flowing back and forth between the load and the generator.
The higher the reactance of the load; the larger the phase shift between the voltage and current waveforms; the lower the power factor; and the higher the reactive power. In an electric system with a purely reactive load, such as a capacitor or an inductor, the load will cause a maximal phase shift of 90°. Only reactive power will flow through the system, as it will return all the power it will receive. The power factor will then be nil.
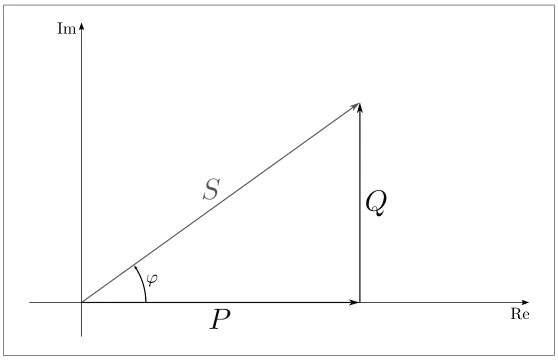
The exact relation between active power, reactive power, apparent power, and phase shift ( ) is conveniently described by the power triangle (Fig. 16)—provided the waveforms are perfectly sinusoidal. The power triangle is an often used concept in power engineering. In it,
phasors are used to express active power (P), reactive power (Q) and complex power (S),
such that:
=
+
.
[image:18.595.113.392.386.567.2]Phasors are simplified representations of sine waves, using vectors in the complex plane. Complex power (S), measured in volt-amperes (VA), is the vector sum of active power (P) and reactive power (Q). Apparent power (| |) is simply the modulus, or absolute value, of complex power (S).
Figure 15: The power triangle
From the power triangle it can be derived that the power factor is equal to the modulus of the cosine of phase shift ( ), as presented by the formula:
= |cos |.
This is why power factor is often abbreviated as “cos ” or “cos phi”.
2 .3 .2 Th e C o s t s o f a L o w P o w e r Fa c t o r
23 have higher circulating currents—due to higher reactance-induced currents—than the system with the higher power factor. Increased currents in a system pose a number of problems.
Firstly, higher currents bring about energy waste. This is due to higher copper loss, or I2R loss—heat converted from electrical energy in the conductors of a power system. A low
power factor thus signifies an inefficient use of energy. It is associated with substantial energy transmission and distribution losses. Businesses affected by a low power factor bear most of the cost of these losses through higher electricity bills: their energy use is higher, as are the tariffs set by the electric utility.
Rising energy prices worldwide cause the economic impact of a low power factor to be felt ever more strongly. Also, growing concerns about CO2 emissions make it a topic that is
increasingly seen in an ethical light as well.
Secondly, higher currents cause a greater voltage drop—the reduction in voltage that occurs in the conductors of a power system. This is also due to higher copper loss. Excessive voltage drop can result in undervoltage, a type of power quality disturbance. A low power factor thus influences power quality. It may lead to unsatisfactory operation of electrical equipment and may even cause damage to it.
Lastly, higher currents push generators, switchgear, transformers and conductors closer to their rated current carrying capacities. A low power factor thus represents an inefficient use of power transmission and distribution equipment. It decreases a power system’s ability to withstand current surges. If rated current carrying capacities are exceeded, equipment may overheat and cause an electric system to fail.
Also, it reduces a power system’s capacity for load expansion. In order to expand their loads, businesses with power systems that have capacity problems and low power factors may decide to upgrade their systems—at great financial cost—when often they could make do with the same systems had these had higher power factors.
Electric utilities face a similar problem. A low power factor reduces power generation, transmission and distribution systems’ capacity to serve new customers. All the while, businesses are usually not charged by the utility for the current capacity they use as a result of the reactive power they generate.
To recoup the financial cost of excessive loss of current capacity caused by low power factor businesses, electric utilities impose a reactive demand charge on such customers. Utilities expect this compensation when reactive power exceeds a certain level, often 50% of active power—corresponding to a power factor of 0.85. For low power factor businesses, most of the financial cost of a low power factor is in the reactive demand charge.
2 .3 .3 H o w t o C o r r e c t a L o w P o w e r Fa c t o r
24 increase the power factor of a power system. These methods do not involve major overhauling of an electric system, but only rely on the placement of special power factor
correction equipment at selected points in a power circuit.
[image:20.595.72.528.200.439.2]The crucial components of this equipment are capacitor banks (Fig. 16). These are groups of large, specially constructed capacitors that serve to compensate for the reactance of partially inductive loads—loads with reactive components that mostly consist of inductive elements.
Figure 16: A series of capacitor banks at a large industrial facility
Partially inductive loads are by far the most common type of partially reactive load. Among them are the most important contributors to a low power factor: variable-speed electric motors. Such motors are used in compressors, conveyors, fluorescent lighting and many types of manufacturing equipment. Because of this, power factor problems are primarily set in industrial facilities, such as sawmills, foundries, chemical plants, polymer plants, textile factories and automotive factories.
Inductive loads differ from capacitive loads in the phase shift between the reactance-induced current they create and the AC voltage. Inductive elements in inductive loads produce currents that lag the AC voltage by exactly 90°, whereas capacitive elements in capacitive loads produce currents that lead the AC voltage by exactly 90°.
The reactance-induced current waveforms created by both types of load are complete opposites, as they are shifted 180° in phase from each other. Hence, at the same time that inductive loads store reactance-induced current, capacitive loads return it, and vice versa.
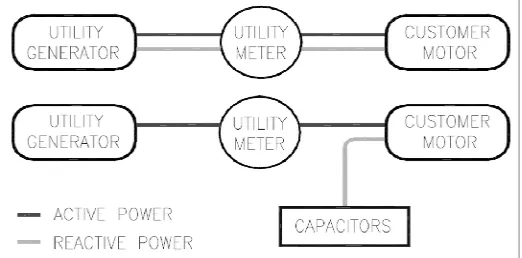
25 In a setup where capacitors and loads are close together, reactance-induced current will not travel long distances through the conductors of power distribution and transmission systems (Fig. 17). The amount of current flowing through the conductors between the loads and the generators of the electric utility will be reduced. Less reactance-induced current will be needed from the electric utility, and the power factor of large parts of the power distribution and transmission systems will be increased.
Figure 17: A capacitor connected to a load; reactive power is diverted
2 .3 .4 P o w e r Fa c t o r C o n s u lt in g
To increase the power factor of their systems, businesses will typically hire broad-oriented power quality consultants, or more specialized electrical engineers who could be called
energy consultants. Power factor consulting has a lot in common with power quality
consulting—which it is often considered a subset of. It is a sophisticated process involving computer analyses and on-site examinations in which power quality tools are often used.
During a power factor investigation power quality analyzers are used in much the same way as in a power quality investigation. However, a smaller set of analyzer functions is used. Thor currently offers limited functionality to investigate power factor. In Donar, this functionality will be expanded.
The investigations will generally result in recommendations of power factor solutions, which involve the installation of power factor correction equipment at the customer’s premises.
2 .3 .5 A n O v e r v ie w o f D o n a r
Within Benchmark and Fluke the future 430 Series II Three Phase Energy Analyzer is codenamed “Donar”—the southern Germanic variant name of Thor. The most important change in Donar with respect to Thor is the presence of “troubleshoot functions” for power and energy analysis (Van Alphen, 2011): Donar will be able to better assist the user during power and energy analysis. It will feature clever algorithms, by which it is able to calculate the effects on energy efficiency of five electrical parameters that are frequent causes energy inefficiency: conductor thickness, displacement power factor, harmonic distortion,
phase unbalance and neutral current (Van Alphen, 2011). Significantly, the product will also
26 With Donar, Fluke seeks to capitalize more fully on energy efficiency market trends. The company recognizes that energy efficiency is a topic of ever-increasing importance in business circles. Globally, energy prices are rising as non-renewable energy sources are becoming scarce, and fear of global warming is leading to more stringent standards on CO2
27
3
P r o b le m D e s c r ip t io n
Benchmark Almelo and Fluke are developing Donar, the successor to Thor—Fluke’s three-phase power quality analyzer. Donar is to have improved functionality that will make power and energy analysis a little more convenient. It will assist the user in calculating the effects of certain electrical parameters on energy efficiency, and expressing energy inefficiency in monetary terms.
Benchmark believes that power and energy analysis will remain a focal point for the Analyzer. The company holds a vision of future product developments beyond Donar. There are two aspects to this vision. Firstly, Benchmark thinks much more could be done in the way of adding assistance functionality to the instrument. The deployment of comprehensive “job assistance” features could make power and energy analysis a less demanding, more efficient, and more satisfying job to perform. Existing Analyzer users could thereby see improvements in productivity. Perhaps more importantly, new users could be drawn to the Analyzer: lesser trained, “blue-collar” electrical technicians could perform power and energy analyses alongside ordinary energy consultants. Benchmark supposes this would spell an opportunity for Fluke to expand its customer base and sell more Analyzers.
Secondly, it thinks the appeal of the Analyzer could be boosted by adding touch screen functionality. Currently, the market is beginning to see the introduction of touch screen technology in three-phase power quality analyzers. Fluke is not at the front of this development; none of Fluke’s power quality products is presently featuring touch screen technology. However, Benchmark believes it will definitely be coming to Fluke’s Power Quality Analyzers in the not too distant future. The benefits of using touch screen technology in the analyzers include a larger screen size, higher durability, and a generally more usable interface. Furthermore, it could help facilitate the deployment of job assistance features.
Benchmark thinks a future design concept study should have to be executed, to shape its ideas further and present them to Fluke. For optimal illustration of the ideas, the focus of the study should lie on the creation of a “showcase design” of a new user interface for the Analyzer. The company is interested in how new job assistance features and the touch screen technology could come together in the user interface to make the Analyzer a more accessible, more usable, and more appealing instrument to carry out power and energy analyses with. The new user interface should be designed to become viable five years from now.
28
4
D e s ig n A n a ly s is
This chapter covers the analysis phase.
4 .1
A n O v e r v ie w o f P o w e r Fa c t o r S o lu t io n s
In order to develop a user interface that supports job assistance features, it is helpful to know a bit about the solutions that are devised in power factor analysis.
4 .1.1 P o w e r f a c t o r C o r r e c t io n M e t h o d s
There are four principal methods of correcting power factor through the placement capacitor banks in a power circuit. They are listed as (Lefrank, 2002):
Individual power factor correction Group power factor correction Central power factor correction Hybrid power factor correction
The following will briefly highlight each method, its applications, its advantages and its disadvantages:
- Individual power factor correction
Simplest method of power factor correction. An appropriately sized capacitor bank is placed in parallel with each inductive load. This eliminates all reactive current flowing through the conductors. Can be used to increase system’s capacity for load expansion.
[image:24.595.305.442.401.501.2]Advantage: simple installation. Disadvantage: high installation costs.
Figure 18: Typical individual power factor correction
- Group power factor correction
Electrical machines that are always switched on at the same time can be combined as a group and have a joint capacitor bank.
Advantage: more cost effective than individual correction.
Disadvantage: only for groups of loads that
[image:24.595.306.446.556.661.2]29 - Central power factor correction
The correction equipment is installed at the power distribution panel. Most frequently used. Primarily aimed at eliminating the reactive demand charge imposed by the electric utility.
[image:25.595.68.528.59.365.2]Advantages: can always be used where power system has sufficient capacity; easy to monitor; relatively simple installation. Disadvantage: reactive current in user’s power distribution system is not reduced.
Figure 20: Typical central power factor correction
- Hybrid power factor correction
For economic reasons the three methods described above are often combined.
Figure 21: Typical hybrid power factor correction
4 .1.2 P o w e r Fa c t o r C o r r e c t io n in t h e P r e s e n c e o f H a r m o n ic s
[image:25.595.304.446.73.170.2]Oftentimes, power factor analysis is complicated by harmonics, which are periodic distortions of voltage, current, or power waveforms (Fig. 22). Harmonics are produced by modern electronic equipment, such as computers and printers.
Figure 22: Harmonic distortion
[image:25.595.115.460.481.632.2]30
4 .2
M e t h o d s o f p r o v id in g jo b a s s is t a n c e
4 .2 .1 S e t u p A s s is t a n t
[image:26.595.115.343.201.374.2]A setup assistant or software wizard (Fig. 23) is a type of user interface that presents a user with a sequence of dialog boxes that guide the user through a series of well-defined steps. Tasks that are difficult, infrequently carried out, or unfamiliar may be easier to complete with the use of an assistant.
Figure 23: Typical software wizard example
A dialog box typically contains a “next” option that is selected to move to the next dialog box after entering or configuring information in the present dialog box. A dialog box usually also provides a “back” option that is selected to go to the previous dialog box. The last dialog box in a setup assistant sequence typically presents a “finish” option that is selected to close the setup assistant.
4 .2 .2 In t e r f a c e A g e n t
One way of providing job assistance to users is implementing software agents. A software agent is a piece of software that acts on behalf of the user in a rational and autonomous way.
4 .2 .3 P o w e r Fa c t o r Ex p e r t S y s t e m
An excellent way of providing job assistance to users is to implement an expert system in the power quality analyzer. In artificial intelligence, an expert system is a computer system that emulates the decision-making ability of a human expert (Jackson, 1998). Expert systems are designed to solve complex problems by reasoning about knowledge, like an expert, and not by following a fixed procedure programmed by a software developer.
31 If an expert system can be trusted to make all decisions and perform all calculations involved in power factor analysis in correct fashion, the power quality analyzer’s job assistance functionality can be expanded in the following manner:
The analyzer can decide when, where, and for how long measurements of a power system need to be taken.
The analyzer can interpret the measuring results and recommend a proper solution to a power factor problem.
- The analyzer can propose an optimal distribution of capacitor banks in a power system. - The analyzer can propose the placement of harmonic filters in a power system, when
necessary.
The analyzer can outline the financial savings that are made by implementing a solution.
4 .3
A n In t e r v ie w w it h a C o n s u lt a n t
An interview was conducted with the owner of a small power and energy consultancy in Hengelo, The Netherlands. The purpose of the interview was to find out in some detail how energy consultants carry out their jobs, to learn about the difficulties they experience while executing their work tasks, and to discover their wishes for job assistance features.
The interviewee was an energy consultant who had many years of professional experience in the field of power factor consulting, serving industrial businesses throughout The Netherlands. He offered power factor consulting, equipment ordering and equipment maintenance services, mostly to industrial customers.
The next subsections summarize the findings of the interview.
4 .3 .1 Th e C o n s u lt a n t s W o r k P r o c e s s
The following is a description of the consultants work process:
1. When a customer calls, the consultant will set up an appointment for a visit. At the customer’s facility, he will first study the customer’s monthly energy bills and network schematics to get an overview of the situation. He will then perform measurements, using his power quality tools, usually at selected points on the facility’s main (and sub) distribution panel.
2. The entire measurement process will either take a few hours or a week to complete, depending on whether the consultant is interested in present, momentary values or recordings of values over a longer time period. By recording parameters during a facility’s entire cycle of operation (using his power quality analyzer) he can accurately identify peak values.
32 4. Finally, the consultant will present his costumer with a detailed report of his analysis and will make him an offer (for the equipment necessary) to implement the proposed solution. He uses previous reports as templates for new reports.
- The consultant distinguishes between two types of customers: companies that wish to halt the incurrence of reactive demand charges by the electric utility, and companies that seek to enlarge their facility’s electric network capacity to accommodate an expansion of production.
- The two types of customers the consultant discerns each require a different approach with regard to data collection.
o In dealing with the first customer category, the consultant’s power factor analyses are based primarily on a costumer’s monthly energy bills and network schematics. The required capacitor power rating can, in most cases, easily be determined using the maximum active power (kW), active energy (kWh) and reactive energy (kVArh) figures listed in the electric utility’s monthly invoice. Direct system measurements are used as a check, mainly to find out whether there is excessive harmonic distortion in the system—which can wreak havoc once the capacitors are installed.
o In dealing with the second category, extensive measurements of the network form the basis of the power factor analyses. The consultant will take readings of the apparent power (kVA), real power (kW), reactive power (kVAr) and harmonic distortion (THD-I, THD-U and harmonic spectrum) at various branches of the network, so he can get a detailed picture of the network’s capacity for load expansion.
- The consultant is not much concerned with the practical aspects of installing power factor correction equipment, as these are generally looked after by a customer’s regular electrical contractor.
- When performing measurements, the consultant wears thick rubber gloves that are designed to protect against voltages up to 1000 Volts (Fig. 24). He prefers having them on for continuous stretches of time, because removing them and putting them on can be quite a hassle.
- The consultant has stated that equipment maintenance services form a significant part of his business. He will inspect air filters and capacitor contactors and replace them if necessary.
33
4 .3 .2 Th e D if f ic u lt ie s Ex p e r ie n c e d
When asked about the difficulties he experiences in his job, the consultant made the following points:
- The consultant explained he often experiences difficulty in measuring voltages at the main distribution board, due to the measurement locations being in cramped and poorly accessible spaces. He said this is typical of European-style distribution units. American-style units generally are much more spacious.
- Measuring currents can pose difficulty as well when there is little space around the power cables for attaching current clamps. Instead of applying clamps, the consultant may use flexible current probes (colloquially called “dog collars”) in such cases.
- Drawing upon his extensive know-how, the consultant generally has little trouble performing his analyses. When pressed to name to most challenging parts of the analysis process, he pointed to the calculations involved in dimensioning a power factor correction system with regard to harmonic disturbance issues.
- Harmonics have a detrimental effect on the performance of an electric system. Power factor correction capacitors can grossly exacerbate harmonic disturbance issues and are adversely affected by them.
- The consultant noted care must be taken never to grossly “overdimension” the capacitor power rating.
4 .3 .3 Th o u g h t s a n d W is h e s r e la t e d t o jo b a s s is t a n c e
The consultant expressed the following thoughts and wishes with respect to job assistance in the power quality analyzer:
The consultant thinks it is conceivable to create simple, but sufficiently accurate representations of customers’ power systems using an Analyzer type of device.
The consultant reacted positively to the suggestion of integrating into the Analyzer the computer software he uses for his analyses. If he can perform at least part of his analysis on-site, he can communicate his preliminary findings at a much earlier time. This would be valued highly by his customers.
The consultant would like the Analyzer to be able to calculate the capacitor power rating based on the power factor and vice versa.
He supposed the Analyzer could help him prepare excel sheets and reports for sharing and printing (at the customer’s location).
The consultant believes wireless internet technologies may offer interesting opportunities. The Analyzer may search external databases to provide instant, up-to-date information on products, services and prices.
The consultant thinks a database in the Analyzer, containing all previously collected information on his customers’ power systems, will prove very convenient during maintenance work on his costumers’ power factor correction equipment.
34
4 .4
Th o r U s e r In t e r f a c e
The Thor user interface consists of a keypad, an LCD, a device casing, a power connector, and input connectors for voltage leads and current clamps. This section will provide a brief description of the Thor user interface focusing on the keypad and the LCD.
4 .4 .1 M a in M e n u L a y o u t
Thor offers an extensive and powerful set of measuring modes to check power distribution systems.8 Some give a general impression of power system performance; others are used to investigate specific details. In the user interface, they are grouped into three main menu options: “SCOPE”, “MONITOR” and “MENU”. Each of these options has a dedicated key on the keypad (Fig. 25, item A).
SCOPE is used to get a clear view of the voltage and current waveform shapes and their phase relation, by means of Waveform screens (Fig. 26) and Phasor screens (Fig. 27). These may offer the first hints of any power quality problems present. Also, they provide a way to verify that the voltage leads and current clamps are connected correctly.
MONITOR is used to get a general impression of the power quality. It offers Bar Graph
screens (Fig. 28), which show whether important power quality parameters exceed a
certain set of limits. One such set is specified according to the EN 50160 norm. This option is generally used for long-term observation of a power system.
MENU is used to get in-depth information on various power quality parameters that are believed to cause trouble. It mainly provides Meter screens (Fig. 29), which give instantaneous overviews of many important numerical measuring values, and Trend screens (Fig. 30), which show the course through time of these measuring values. The Analyzer automatically records all readings in the Meter screens.
The main menu layout of Donar will differ slightly from Thor. It will switch the MONITOR main menu option with “LOGGER”, a measuring mode that is located under MENU.
Other menu options that have dedicated keys on the keypad are “SETUP”, “MEMORY” and “SAVE SCREEN” (Fig. 14, item B).
8
The measuring modes are Scope Waveform & Phasor, Volts/Amps/Hertz, Dips & Swells, Harmonics, Power &
35 Figure 25: Thor keypad and LCD
4 .4 .2 C o n t r o ls a n d S c r e e n In f o r m a t io n
Operation of measuring functions and adjustment of settings is performed via screen menus. Four arrow keys are used to navigate through these menus (Fig. 25, item C). The “ENTER” key is used to make selections (Fig. 25, item E). The keys “F1” through “F5” (Fig. 25, item D) are soft keys that are also used to make selections. Each soft key corresponds with a soft key text area that may be selected. Soft key functions that can be selected are indicated by white-colored text; soft key functions that are currently not available are indicated by gray-colored text; and soft key functions that are presently selected are highlighted with a black background.
G
H
I
J
A
B
E K
D
36 The following screen information is common for all screen types:
Measuring mode (shown in the screen header, not visible in Fig. 25)
Measuring values (Fig. 25, item G)—main numerical measuring values with background colors that differ per phase and for voltage or current.
Status indicators (Fig. 25, item H)—symbols that may appear on the screen to show the state of analyzer and measurements.
Items: indication that the 150/180 cycle aggregation interval is active; indication of time that a measurement has been going on; indication that horizontal zoom is on; indication that measurement may be unstable; indication that a dip, swell or interruption has occurred; indication that recording of measurement data is on; indication of phasor rotation or phase sequence; indication of battery or line power; and indication of keyboard locked.
Main area with measuring data (Fig. 25, item I) Status line (Fig. 25, item J)
Items: date of the analyzer’s real time clock; time of day or cursor time; nominal line voltage and frequency; GPS signal strength indicator; number of phases and wiring configuration for the measurement; and name of the limits used for the MONITOR option.
Softkey text area (Fig. 25, item K)
Figure 26: A Waveform screen Figure 27: A Phasor screen
[image:32.595.74.530.345.515.2] [image:32.595.74.525.563.731.2]37 Figure 30: A Trend screen
4 .4 .3 Fu n c t io n s f o r P o w e r Fa c t o r A n a ly s is
Thor offers three measuring modes that are used in power factor analysis: “Power & Energy”, “Harmonics” and “Logger”. All three are located under “MENU”.
Figure 31: A Power & Energy Trend screen
Figure 32: A Harmonics Trend screen Figure 33: A Logger Trend screen
Power & Energy displays Meter screens and Trend screens. The Meter screens mainly provide measuring values of parameters that are related to power factor (Fig. 31). The Trend screens show the course through time of all measuring values in the Meter screens.
Harmonics displays a Bar Graph screens and a Trend screen. The Bar Graph screens show the distortion size of each of the harmonic components as a percentage of the full signal (Fig. 32).
Logger offers the possibility to store with high resolution the measuring values of multiple parameters over adjustable time intervals (Fig. 33).
4 .5
Th e M a r k e t a n d t h e C o m p e t it io n
4 .5 .1 A M a r k e t O v e r v ie w
[image:33.595.73.529.349.479.2]38 The power quality T&M equipment market consists of the following segments: handheld
devices; portable instruments; permanently installed monitors; power quality software; and revenue-demand meters with power quality features (Frost & Sullivan, 2010). With its
Power Quality Tools group of products Fluke mainly focuses on the handheld devices and portable instruments segments. Three-phase power quality analyzers such as Thor can be regarded as a subcategory of the portable instruments segment.
With regard to Thor, Fluke faces competition from three major participants—Chauvin Arnoux, Dranetz and Hioki Corporation—as well as several smaller participants. Competition in the three-phase power quality analyzer subcategory is based primarily on price, performance and features. A trend can be seen towards enhanced capabilities of the three-phase analyzers.
Fluke seeks to differentiate its high-end power quality analyzers from its competitors’ through high specifications, high reliability, smart functionality, thoughtful user interface design, and distinctively rugged exterior design. It chooses to create high quality, “Class A” equipment, on which it can maintain healthy profit margins.
4 .5 .2 A n O v e r v ie w o f C o m p e t it o r s ’ O f f e r in g s
[image:34.595.113.416.418.572.2]The PowerXplorer PX5 440 (Fig. 34) is a power quality analyzer manufactured by Dranetz, one of Fluke’s main competitors. The PX5 440 is the flagship model of the company’s line of power quality analyzers.
Figure 34: Dranetz PowerXplorer PX5 440
The PX5 440 has the following characteristics:
Size: 300 mm x 64 mm x 203 mm (h x w x d) Weight: 1.9 kg
Display: 3.75 x 4.75 inches color touch screen LCD Input:
- The touch screen is operable using finger or stylus.
- The touch screen display permits alphanumeric data entry. Assistance features:
39 - There are three ways to set up the instrument for measuring:
- Automatic Setup automatically configures the instrument’s circuit type, voltage and current channels, and parameter thresholds.
- Wizard Setup takes the user through a series of screens prompting for information about the circuit to be monitored.
[image:35.595.113.529.168.532.2]- Advanced setup allows the user to modify trigger parameters and intervals that were previously set up through Automatic or Wizard setups.
Figure 35: PX5 440 – Main menu Figure 36: PX5 440 – Wizard screen 1
40
5
Fu n d a m e n t a l D e s ig n C o n s id e r a t io n s
This chapter highlights the fundamental considerations that should form the basis of any solution to the problem.
5 .1
Th e U s e r P r o f ile s
The end-users of Thor are mostly power quality consultants, and energy consultants. They are highly trained, specialist electrical engineers that have the skills necessary to put the instrument to good use. Benchmark imagines future power quality analyzers could be made more accessible to lesser-trained electrical technicians by implementing job assistance features. This would enable Fluke to expand its customer base.
Generalizations of the findings of the interview, conversations with employees of Benchmark and Fluke, and common sense assumptions by the author, have led to the establishment of two user profiles for the new user interface design. These are presented in the table below. The new design should primarily consider the user profile of the “regular electrical technicians”.
User
characteristics
New user interface users’ characteristics
Power quality and energy consultants (existing user group)
Regular electrical technicians
(new user group)
Age Range in age from about 30 to 60 years Will range in age from about 25 to 60 years
Sex Are mostly male Will mostly be male
Educational background
Generally have had a college education Will generally have had a
community/junior college education Generally have extensive experience in
the field of electrical engineering
Will generally have some experience in the field of electrical engineering Have specialist knowledge of low
voltage power systems, power factor and harmonic disturbance issues, and power factor correction equipment
Will have familiarity with low voltage power systems, power factor and harmonic disturbance issues, and power factor correction equipment
Physical limitations
Have some physical limitations in relation to the use of hands, due to the wearing of electrical gloves
Will have some physical limitations in relation to the use of hands, due to the wearing of electrical gloves
Tool use Make regular use of basic electrical tools
Will generally have had some prior experience using basic electrical tools Make regular use of a power quality
analyzer
Will generally have had no prior experience using a power quality analyzer
41 Use special computer software to
perform calculations that are part of their power factor analysis
Attitude Are traditionalistic with regard to work practices; may hesitate to embrace new technologies
Will be new to their jobs: will probably be more accepting of new technologies
May be somewhat distrustful of comprehensive ‘auto’ functions
Will probably place confidence in comprehensive ‘auto’ functions May feel threatened by new
technologies that aim to simplify the work process (fear of being made redundant)
Will probably feel bolstered by new technologies that aim to simplify the work process
Motivation Will probably be motivated by job productivity considerations to use new features in the Analyzer
Will probably be motivated by general job performance considerations to use new features in the Analyzer
5 .2
R e s t r ic t io n s o n t h e H a r d w a r e
Benchmark wishes for the design to become viable within five years from now. Important considerations that arise from this are the size and weight restrictions of the Analyzer instrumentation five years from now. The instrumentation is not expected to change dramatically in five years. Thus, a decision was made that the new interface design should fit an analyzer that has approximately the same frontal dimensions as Thor, and should fit an analyzer that weighs about 1.5 kg.
5 .3
N ie ls e n ’s U s a b ilit y H e u r is t ic s
It is important that the new user interface design conforms to general principles of user interface design. Jakob Nielsen has devised ten heuristics, or “rules of thumb”, that are frequently used to evaluate the usability of user interfaces (Nielsen & Mack, 1994). They can also function as guidelines in the design of user interfaces. In the next chapter they will form the basis for the usability requirements.
The heuristics as published by Nielsen are as follows:
1. Visibility of system status.
The system should always keep users informed about what is going on, through appropriate feedback within reasonable time.
2. Match between system and the real world.
The system should speak the users’ language, with words, phrases and concepts familiar to the user, rather than system-oriented terms. Follow real-world conventions, making information appear in a natural and logical order.
42 Users often choose system functions by mistake and will need a clearly marked “emergency exit” to leave the unwanted state without having to go through an extended dialogue. Support undo and redo.
4. Consistency and standards.
Users should not have to wonder whether different words, situations, or actions mean the same thing. Follow platform conventions.
5. Error prevention.
Even better than good error messages is a careful design which prevents a problem from occurring in the first place. Either eliminate error-prone conditions or check for them and present users with a confirmation option before they commit to the action.
6. Recognition rather than recall.
Minimize the user’s memory load by making objects, actions, and options visible. The user should not have to remember information from one part of the dialogue to another. Instructions for use of the system should be visible or easily retrievable whenever appropriate.
7. Flexibility and efficiency of use.
Accelerators -- unseen by the novice user -- may often speed up the interaction for the expert user such that the system can cater to both inexperienced and experienced users. Allow users to tailor frequent actions.
8. Aesthetic and minimalist design.
Dialogues should not contain information which is irrelevant or rarely needed. Every extra unit of information in a dialogue competes with the relevant units of information and diminishes their relative visibility.
9. Help users recognize, diagnose, and recover from errors.
Error messages should be expressed in plain language (no codes), precisely indicate the problem, and constructively suggest a solution.
10.Help and documentation.
Even though it is better if the system can be used without documentation, it may be necessary to provide help and documentation. Any such information should be easy to search, focused on the user’s task, list concrete steps to be carried out, and not be too large.
5 .4
To u c h s c r e e n - s p e c if ic G u id e lin e s
The following guidelines, derived from multiple sources, refer specifically to the design of touch screen user interfaces, and are used to supplement Nielsen’s Heuristics in the next chapter:
1. Use sufficiently sized buttons.
43 2. Provide immediate feedback upon reception of touch screen user input.
Feedback acknowledges the user’s actions and assures them that processing is occurring. Users expect immediate feedback when they operate a control (Apple, Inc., 2011).
3. Use bright background colors.
Bright background colors hide fingerprints and reduce glare (Waloszek, 2000).
4. Be aware of screen coverage.
The hand or finger of the user may obscure parts of the screen during operation (Waloszek, 2000). Navigation buttons may best be placed at the bottom of the screen area.
5. Prefer constrained controls.
Constrained controls like lists and sliders reduce the need for text input, which can be cumbersome on a touch screen (Microsoft, n.d.).
6. Provide appropriate default values.