In search for the reversed
camera angle effect
Bachelor Thesis Michiel Peterkamp
S0118192 University of Twente Faculty of Behavioral Sciences
1st Examiner Dr. A. Heuvelman University of Twente Faculty of Behavioral Sciences
2 ABSTRACT
3 INTRODUCTION
For marketers it is very useful to know in which way consumers perceive products. So it is not surprising there is a considerable amount of literature about product design and aesthetics. While there are numerous books about aesthetics and design there is little scientific research supporting this.
An approach that Meyers-Levy and Peracchio (1992) took was to manipulate the camera angle, with respect to a product, to influence the way in which participants judged that product. It is a well known phenomenon in social science that these camera angle effects, downward-looking, eye-level or upward looking, have a significant effect on how we look at faces (Kraft, 1987). Meyers-Levy and Peracchio also found an effect that camera angle can have on the evaluation of products.
The effect that a camera angle has on products influences the way we judge these products (Kraft, 1987; Meyers-Levy & Peracchio, 1992; Peracchio & Meyers-Levy, 2005). Low camera angles looking up provide the perception of power, potency (Kraft, 1987; Meyers-Levy & Peracchio, 1992), strength, action and superiority (Giannetti, 1982). A downward-looking camera angle, on the contrary, provides the perception of an object to be less threatening and more malleable (Yang, Zhang & Peracchio, 2010).
According to Van Rompay, Hekkert, and Muller (2005) “we may also associate smallness with refinement, as in the experience of relatively small, technologically controlled details in a design. In those cases, disproportional large features may be understood as coarse. Whereas expressions like impressive, luxurious or coarse are most likely not only related to the size of people or things around us, the size schema is, at least to some degree, expected to underlie these expressions” (p. 365).
Peracchio and Meyers-Levy (2005) investigated if a high camera angle, which imparts the concept of weakness (Kraft, 1987), in a different context impart the relatively
4
most natural, organic objects grow in or are found on the ground below eye level (e.g., soil, vegetation, bodies of water, etc.)” (p. 35-37).
They used a cereal advertisement with a short paragraph of copy and a priming task that activated the concept of naturalness while manipulating the camera angle. They found that stylistically imparted descriptive concepts only appeared when the viewers engage in somewhat extensive processing and the concepts conferred by the stylistic properties are otherwise activated.
It is well known that processing fluency has effect on the evaluation of products and our attitudes towards these products. The more fluently perceivers can process an object, the more positive their aesthetic response will be (Hekkert & Leder, 2008; Reber, Schwarz & Winkielman, 2004).
The interesting question is; do products that have intrinsic properties like impressiveness and potency or refinement and childlikeness have contrary camera angle effects?
The expectation will be that if camera angle effects emphasize the same properties that products carry intrinsically they will be processed more fluently and thus be judged more positively.
H1: Products that have strong, potent, powerful properties are judged more positively from a low camera angle looking up than from a high camera angle looking down, because an upward-looking camera angle emphasizes these properties.
H2: Products with charmful, refined, rounded properties are judged more positively from a high camera angle looking down than from a low camera angle looking up, because a downward-looking camera angle emphasizes these properties.
5 METHOD
Stimuli
For this experiment two types of products were used. One type of products that carry properties like potency, powerfulness, impressiveness and strength and another type of product that carry the more positive properties of downward-looking camera effects like refinement, subtlety, delicacy and approachableness. In the search for products with those contrary intrinsic properties it is important to find some specific characteristics in
products that evoke these properties. Zhang, Lawrence, & Price (2006) explained in their study that angular shapes tend to induce associations with traits that express energy, toughness and strength, and rounded shapes tend to induce associations with traits that express approachableness, friendliness, and harmony. Although these are properties that say something about the valence of potency and activity of the products (Osgood, Suci & Tannenbaum, 1957), it was the goal of this experiment to emphasize these properties by camera angle manipulation and evaluate the products on Osgood’s (1957) evaluative factor.
To strengthen this experiment there were products used from the same category that have these opposite properties, to keep the participant as much in the dark about the purpose of the research as possible.
6
The products were photographed at an angle of approximately 40 degrees above and below eye level, the same angle Kraft (1987) and Meyers-Levy and Peracchio (1992) used in their search for camera angle effects.
To keep the participants in the dark about the purpose of the experiment the twelve pictures of the six products were used in two questionnaires. One picture per product (high or low camera angle) in each questionnaire. This resulted in two questionnaires that treat every product from high or low camera angle. To limit the influence of preexisting brand perceptions on evaluation all identifying brand names and logos of the products were masked.
Apparatus
The products were judged with a seven point Likert scale with an opposing term at either end of the scale rating the overall impression of the products. To prevent response tendencies some of the opposites were commuted. The scale covers the evaluative factor that Osgood et al. (1957) developed, by using seven semantic opposites that were most heavily loaded with this factor (see Table 1). The evaluative factor is the only factor that was used to judge the products, that is because the evaluative factor is the most important of the semantic space dimensions (Osgood et al., 1957) and if there were used semantic opposites from the potency or activity factor (i.e., strong – weak) this would jeopardize the validity of the experiment.
Table 1 The seven semantic opposites: Good – Bad
Successful – Unsuccessful True – False
Optimistic – Pessimistic Beautiful – Ugly
7
Procedure
All participants in this study were gathered through email, social media and personal communication. In total a number of 86 participants joined the experiment, but because of some not fully completed questionnaires, 71 questionnaires were used (45 men, 26 women). Participants were between 16 and 60 years of age (M = 30,13; SD = 11,03) and they were randomly divided over the two different questionnaires, 32 participants completed questionnaire 1 and 39 participants completed questionnaire 2.
The participants entered the experiment by clicking on a URL that sends them randomly to one of the two questionnaires. First, they encountered a screen welcoming them to the experiment and saying they were to judge six different products and after each product they will be asked to judge these products using a rating scale. Next, they judged the six products independently from each other with the sevenfold semantic scale. At the end of the
questionnaire they were asked to fill in their sex, education level and age and were thanked for their help.
Design
A 2x2 design was used, with camera angle (high, low) and product type (strong, weak), to analyze the data. Two questionnaires were used. Both questionnaires treated every product from high or low camera angle (see Table 2 and Table 3). The scores of each product per angle was compared to each other and analyzed with a one-sided
independent-samples t test.
Table 2
Questionnaire 1
Product Coffee machine Digital camera Refrigerator Kettle TV Toaster
Camera angle high low low high high low
8 Table 3
Questionnaire 2
Product Refrigerator Kettle TV Toaster Coffee machine Digital camera
Camera angle high low low high low high
9 RESULTS
In this experiment there were no significant differences found for the scores of two strong products (the refrigerator and the widescreen TV) and one weak product (the kettle) when manipulating the camera angle, but there was a main camera angle effect found for the coffee machine and there was a reversed camera angle effect found for the digital camera and for the toaster.
The reliability of the questionnaires was tested by computing Cronbach’s Alpha. A reliability coefficient of .87 was found that allows the assumption that the questionnaires did indeed measure the underlying factor.
H1: Products that have strong, potent, powerful properties are judged more positively from a low camera angle looking up than from a high camera angle looking down, because an upward-looking camera angle emphasizes these properties.
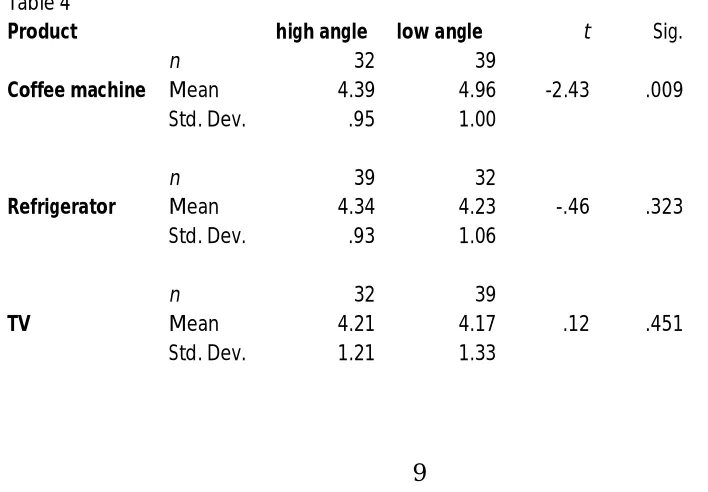
[image:9.595.89.443.515.761.2]Hypothesis 1 was partly confirmed, for the strong products there was a main camera angle effect found for the coffee machine, but there was no effect found for the refrigerator and also no effect was found for the widescreen TV (see Table 4).
Table 4
Product high angle low angle t Sig.
n 32 39
Coffee machine Mean 4.39 4.96 -2.43 .009
Std. Dev. .95 1.00
n 39 32
Refrigerator Mean 4.34 4.23 -.46 .323
Std. Dev. .93 1.06
n 32 39
TV Mean 4.21 4.17 .12 .451
10
H2: Products with charmful, refined, rounded properties are judged more positively from a high camera angle looking down than from a low camera angle looking up, because a downward-looking camera angle emphasizes these properties.
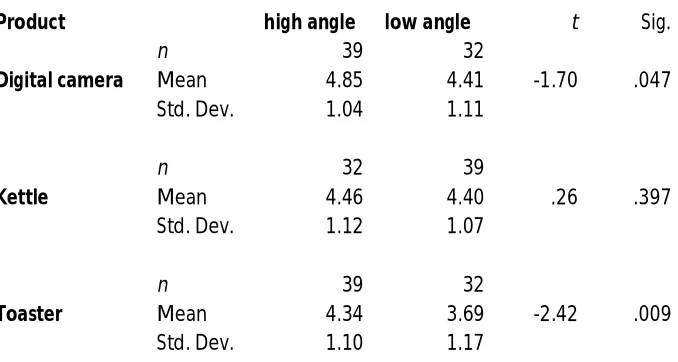
[image:10.595.95.434.279.460.2]Hypothesis 2 was also partly confirmed, for the weak products a reversed camera angle effect was found for the digital camera and for the toaster, but no camera angle effect was found for the kettle (see Table 5).
Table 5
Product high angle low angle t Sig.
n 39 32
Digital camera Mean 4.85 4.41 -1.70 .047
Std. Dev. 1.04 1.11
n 32 39
Kettle Mean 4.46 4.40 .26 .397
Std. Dev. 1.12 1.07
n 39 32
Toaster Mean 4.34 3.69 -2.42 .009
11 DISCUSSION
This research examined the influence of high and low camera angles on the evaluation of three strong products and three weak products of the same branch. Based on the studies of Kraft (1987), Meyers-Levy and Peracchio (1992), Peracchio and Meyers-Levy (2005) and the high reliability of the questionnaires a main camera angle effect was expected to be found. The hypotheses were not fully confirmed but the scores of the coffee machine were consistent with previous research and the scores of the digital camera and the toaster were in line with the theory of the present research.
Need For Cognition (NFC) seems to play a significant role in product evaluation. In their first study about camera angle effects Meyers-Levy and Peracchio (1992) found no camera angle effects when the participants were high in NFC and high in motivation. They attributed this to the heuristic processing hypotheses, this means that camera angle effects only arise when people make use of simple decision rules or heuristics to evaluate products. In another study of camera angle effects Peracchio and Meyers-Levy (2005) revised their vision. In this study it seems that an inverted U-shaped relationship may exist between the extensiveness of processing and both discernment and use of stylistically imparted descriptive concepts. It seems that the effect of the NFC of the participant is different for different kind of experiments. Because of this changing
relationship of NFC and product evaluation it is hard to say if the NFC of the participants influenced the outcomes of the present experiment. In future research for the reversed camera angle effect it might be wise to measure peoples NFC, after taking place in the experiment, to control for NFC effects.
12
factor (Osgood et al., 1957), if the stimuli do indeed carry out these characteristics to desirable extent.
Another reason why there were only camera angle effects found for some of the products may be due to the number of participants used in the present experiment, because of the 2x2 design there are four conditions. It is preferable to use at least 25 participants per condition, this leads to a total of at least 100 participants to join the experiment. This would increase the chance to find a significant main effect.
The findings in the studies of Meyers-Levy and Peracchio (1992) and Peracchio and Meyers-Levy (2005) were never replicated in follow up studies. So the search for a camera angle effect on products seems to be a hard one. That is probably for a large part accountable for the moderation effect that NFC has on product evaluation, and this is presumably the main difference between the studies for camera angle effects for faces and for products.
So in summary the main recommendations for future research for the reversed camera angle effect are to take in account the role that NFC can play on product evaluation and also to use products that have been tested low on potency.
13 REFERENCES
- Giannetti, L. D. (1982). Understanding movies. Englewood Cliffs, NJ: Prentice-Hall.
- Hekkert, P. & Leder, H. (2008) Product aesthetics. Product Experience, 10, 259-285.
- Kraft, R. N. (1987). The influence of camera angle on comprehension and retention of pictorial events. Memory & Cognition, 15(4), 291-307.
- Meyers-Levy, J. & Peracchio, L. A. (1992). Getting an angle on advertising: The effect of camera angle on product evaluations. Journal of Marketing Research, 39, 454-461.
- Osgood, C. E., Suci, G. J. & Tannenbaum, P. H. (1957). The measurement of meaning.
University of Illinois Press.
- Peracchio, L. A. & Meyers-Levy, J. (2005) Using stylistic properties of ad pictures to communicate with consumers. Journal of Consumer Research, Inc., 32, 29-40.
- Reber, R., Schwarz, N. & Winkielman, P. (2004) Processing fluency and aesthetic pleasure: Is beauty in the perceiver's processing experience? Personality and Social Psychology Review, 8 (4), 364-382.
- Van Rompay, T., Hekkert, P. & Muller W. (2005) The bodily basis of product experience. Design Studies, 26, 359-377.
- Van Rompay, T., Pruyn, A. & Tieke, P. (2009) Symbolic meaning integration in design and its influence on product and brand evaluation. Special Issue on Design & Emotion, 3 (2), 19-26.
- Yang, X., Zhang, J. & Peracchio, L. A. (2010) Understanding the impact of self-concept on the stylistic properties of images. Journal of Consumer Psychology,
20, 508-520.
14
APPENDIX A - Statistics
Statistics
leeftijd
N Valid 71
Missing 0
Mean 30,13
Std. Deviation 11,027
Minimum 16
Maximum 60
geslacht
Frequency Percent Valid Percent
Cumulative
Percent
Valid Man 45 24,7 63,4 63,4
Vrouw 26 14,3 36,6 100,0
Total 71 39,0 100,0
Missing System 111 61,0
Total 182 100,0
opleiding
Frequency Percent Valid Percent
Cumulative
Percent
Valid 3 7 9,9 9,9 9,9
4 17 23,9 23,9 33,8
5 37 52,1 52,1 85,9
6 10 14,1 14,1 100,0
Total 71 100,0 100,0
15
Reliability of variables
Coffee machine Bovenaf Coffee machine Onderaf
Reliability Statistics
Cronbach's
Alpha N of Items
,838 7
Digital camera Onderaf Digital camera Bovenaf
Reliability Statistics
Cronbach's
Alpha N of Items
,914 7
Refrigerator Onderaf Refrigerator Bovenaf
Reliability Statistics
Cronbach's
Alpha N of Items
,787 7
Kettle Bovenaf Kettle Onderaf
Reliability Statistics
Cronbach's
Alpha N of Items
,855 7
Widescreen TV Bovenaf Widescreen TV Onderaf
Reliability Statistics
Cronbach's
Alpha N of Items
,927 7
Reliability Statistics
Cronbach's
Alpha N of Items
,870 7
Reliability Statistics
Cronbach's
Alpha N of Items
,916 7
Reliability Statistics
Cronbach's
Alpha N of Items
,799 7
Reliability Statistics
Cronbach's
Alpha N of Items
,888 7
Reliability Statistics
Cronbach's
Alpha N of Items
16
Toaster Onderaf Toaster Bovenaf
Reliability Statistics
Cronbach's
Alpha N of Items
,879 7
Overall
Reliability Statistics
Cronbach's
Alpha N of Items
,881 7
Reliability Statistics
Cronbach's
Alpha N of Items
17
APPENDIX B - Stimuli
18