Jaar
doc
umen
t 2009
Stich
ting Holding Isa
la kliniek
en
R.A.K. Vlijm
- 2 -
Relating the master surgery schedule to the workload at the nursing
wards
Date:
November 2011
Author: R.A.K. Vlijm
Industrial Engineering and Management School of Management and Governance University of Twente, Enschede
Supervisors: Dr.ir. E.W. Hans
Operational Methods for Production and Logistics School of Management & Governance
University of Twente, Enschede
Dr.ir. I.M.H. Vliegen
Operational Methods for Production and Logistics School of Management & Governance
University of Twente, Enschede
B. van den Akker
- 4 -
Summary
Introduction
This master thesis has been conducted from February through September 2011 at the Isala Klinieken Zwolle. The goal of the research was to reduce the variability of the workload on the nursing wards.
The study shows that stream of elective surgery patients is responsible for most of the erratic behaviour at the nursing wards. High variability of workload in the nursing wards results in many unfavourable consequences: peak workloads, cancellation of patients, empty beds, the allocation of patients to wards that are non-optimal for their healing process, difficulties handling emergency patients, higher risk of mortality, higher failure to rescue rates, lower job satisfaction and higher likelihood of nurse burn-out.
The study proposes a decision tool that quantifies the required bed demand for the current master surgery schedule and offers alternative MSSs that are expected to perform substantially better.
Research approach
To conduct this research, we use Vanberkel’s model to relate recovering surgical patient workload to the Master Surgery Schedule. The model is used to evaluate variants of the current MSS. In this research the term OR-block is defined as a shift (morning or afternoon) in any of the operating rooms on any of the 10 days within an MSS-cycle (De Weezenlanden there are 10 (ORs) times 2 (shifts per day) times 10 (Days) = 200 OR-blocks). The heuristic developed in this research swaps OR-blocks and compares the calculated expected patient workload.
The performance of an MSS is defined along three dimensions: the variability of the expected bed demand per day, of the expected number of admissions per day, and of the expected number of discharges per day. The model records the best possible swaps. After implementing the change the model can be rerun. We refer to a rerun as an iteration.
Results
Two interventions are tested: restricting the amount of patients that are allowed to be operated during one OR-block, and altering the MSS. The first intervention yields no consistent results. The later, however, shows considerable improvements. The interventions are tested for both of the hospital’s major locations, De Weezenlanden (WL) and Sophia (SZ).
For De Weezenlanden, the workload performance measure has been reduced by about 50 percent after five iterations. The total bed demand for the location is reduced from 137 to 131 beds after five iterations. For the Sophia location, the workload performance measure is reduced by about 60 percent after four iterations, and the bed demand is reduced by 3 beds.
Ward specific distributions
- 5 -
Conclusions
The best swaps for the Weezenlanden location are: swapping urology from the first Wednesday to the last Friday afternoon, then swapping urology from the second Wednesday to the last Friday of the cycle, then swapping ear, nose and throat surgery from the first Thursday for orthopaedics from the second Monday, then ear, nose and throat surgery from the first Friday for orthopaedics from the first Monday. Table 5.5 and 5.6 give an overview of the best swaps.
The best swaps for the Sophia location are: swapping neurosurgery from the first Monday with plastic surgery from the last Friday, then swapping neurosurgery from the second Monday with plastic surgery from the first Friday, then neurosurgery from the second Monday with general surgery from the last Friday, then neurosurgery from the first Monday with general surgery from the second Monday. A complete overview of the best swaps can be found in the Appendix.
The heuristic is flexible. The performance measure can be adapted to minimize variance over all days (both week and weekend days), or to minimize total bed demand, or give different weights to either the variance of bed demand during the week and the variance of bed demand during the weekend. It is also possible to swap OR-days instead of OR-blocks.
The workload is reduced considerably for the hospital in general, but further investigation shows that we need to be aware of changes at specific wards. As a consequence of the reduction in workload some wards perform better as well. There are some wards that perform worse after the intervention however, and it is important to be aware of this.
Recommendations
The implementation of this research is a delicate matter. The recommendations regarding the implementation should be followed. Because the MSS for the new location is not decided upon yet, it is a huge opportunity to get rid of inefficiencies in the schedule. It is recommended to carefully structure the new MSS. Strictly speaking the hospital can start with a completely new MSS. Building an MSS from the bottom up allows for improvements compared to the current schedule and it is recommended that this opportunity is used wisely.
Depending on the management’s goal for the new hospital, the heuristic for optimization may or may not lead to a desired MSS. If capacity becomes an issue and the hospital’s management decides to increase the number of patients in the weekends in order to decrease the workload throughout the week the one-step-swaps may not be the most effective modus operandi. Traditionally the Friday has been a relatively quiet day for the operating rooms. If bed occupancy needs to be raised in the weekends one might consider more drastic approaches to altering the MSS.
When workload of a specific ward is expected to increase measures must be taken. Our model predicts when this will happen, so we can anticipate on this. Possible measures include exchanging nurses between different wards.
- 7 -
Management Samenvatting (Dutch)
Introductie
Deze master thesis is uitgevoerd in februari tot en met augustus 2011 in de Isala Klinieken Zwolle. Het doel van het onderzoek was de patiëntlogistiek te verbeteren, met name de variabiliteit met betrekking tot de werklast op de verpleegafdelingen te verminderen.
De studie toont aan dat de patiëntstroom die verantwoordelijk is voor het grootste deel van het grillige gedrag op de verpleegafdelingen de electieve OK-patiënten zijn. Hoge variabiliteit op de verpleegafdelingen resulteert in een hele reeks van ongunstige gevolgen: pieken in de werklast, de annulering van patiënten, de toewijzing van patiënten aan afdelingen die niet optimaal is voor hun herstel, lege bedden, moeilijkheden met het verwerken van spoedeisende patiënten, een hoger risico op sterfte, hogere failure-to-rescure rates, een lagere werktevredenheid en een hogere kans op burn- out van verpleegkundigen.
De studie levert een beslissingsinstrument aan dat de vereiste bedvraag ten gevolge van het huidige master surgery schedule kwantificeert en stelt alternatieve MSS-en voor die naar verwachting aanzienlijk beter presteren.
Onderzoeksaanpak
Voor het uitvoeren van dit onderzoek is Vanberkel's model gebruikt dat het verband legt tussen de werklast die gemoeid gaat met herstellende chirurgische patiënten en het master surgery schedule.
In dit onderzoek wordt de term OR-block (OK-blok) gedefinieerd als een shift (ochtend of middag) in een van de operatiekamers op een van de 10 dagen binnen een MSS-cyclus (dus voor De Weezenlanden zijn er 10 (OK’s) keer twee (verschuivingen per dag) maal 10 (dagen) = 200 OK-blokken. De heuristiek zoals ontwikkeld in dit onderzoek wisselt alle mogelijke paren OK-blokken en vergelijkt de berekende verwachte werklast.
De prestaties van een MSS wordt bepaald op drie dimensies, die elk wordt beschouwd als een belangrijk onderdeel van de werklast: de variabiliteit van de verwachte vraag naar bedden, die van het verwachte aantal opnames, en van het verwachte aantal ontslagen.Het model legt de best mogelijke wisselingen vast. Na de implementatie van een verandering kan het proces herhaald worden. Elke herhaling wordt gedefinieerd als een iteratie.
Resultaten
Twee interventies worden getest: het beperken van de hoeveelheid patiënten die geopereerd mogen worden tijdens een OK-blok, en het veranderen van het MSS. Beperking van de hoeveelheid operaties per OK-blok levert geen consistente resultaten op. Het wijzigen van het MSS levert wel aanzienlijke verbeteringen op. Het model is toegepast op de twee ziekenhuislocaties van de Isala Klinieken, te weten: De Weezenlanden (WL) en Sophia (SZ).
- 8 -
Resultaten op het niveau van individuele verpleegafdelingen
De situatie op de individuele afdelingen als gevolg van de veranderingen is ook onderzocht. Het blijkt dat voor de locatie Weezenlanden de prestaties voor de specifieke afdelingen verbetert. Voor de locatie Sophia is de netto werklast voor de individuele afdelingen is ongeveer hetzelfde als voor de interventie.
Conclusies
De beste swaps voor de Weezenlanden locatie zijn: het omwisselen van urologie van de eerste woensdag met een lege OK-dag op de laatste vrijdag, daarna het wisselen urologie van de tweede woensdag met een lege OK-dag op de laatste vrijdag van de cyclus, dan het wisselen van KNO vanaf de eerste donderdag met orthopedie van de tweede maandag, dan KNO vanaf de eerste vrijdag met orthopedie vanaf de eerste maandag. Tabellen 5.5 en 5.6 bevatten een compleet overzicht van de beste swaps.
De beste swaps voor de Sophia locatie zijn: het wisselen van neurochirurgie vanaf de eerste maandag met plastische chirurgie van de laatste vrijdag, dan het wisselen van neurochirurgie vanaf de tweede maandag met plastische chirurgie vanaf de eerste vrijdag, dan neurochirurgie vanaf de tweede maandag met algemene chirurgie van de laatste Vrijdag, dan neurochirurgie vanaf de eerste maandag met algemene chirurgie vanaf de tweede maandag. Tabel 5.9 bevat een compleet overzicht.
De optimalisatie-doelfunctie kan worden aangepast. Voorbeelden zijn het minimaliseren van de variantie over alle dagen (zowel week-en weekenddagen), of om de maximale bedvraag te minimaliseren, of het verschillend wegen van de verschillende onderdelen van werklast .
Het is ook mogelijk om te wisselen niet OK-blokken te verwisselen in plaats van OK-dagen.
De werkdruk is aanzienlijk verminderd voor het ziekenhuis in het algemeen, maar nader onderzoek laat zien dat het nodig is om bewust te zijn van veranderingen op specifieke afdelingen. Als gevolg van de vermindering van de werklast presteren sommige afdelingen beter. Er zijn echter een aantal afdelingen die slechter presteren na de interventie, en het is belangrijk om hiervan bewust te zijn.
Aanbevelingen
Het invoeren van de door het model gesuggereerde veranderingen is een delicate zaak. De aanbevelingen ten aanzien van de invoering moeten worden gevolgd. Omdat het MSS voor de nieuwe locatie nog niet vaststaat, is het een enorme kans voor het ziekenhuis om zich te ontdoen van inefficiënties in de planning. Het is aan te bevelen om zorgvuldig de structuur van het nieuwe MSS te bepalen.
Afhankelijk van de doelstelling van de directie voor het nieuwe ziekenhuis zal de heuristiek voor optimalisatie wel of niet leiden tot een gewenst MSS. Als de capaciteit een probleem wordt en het ziekenhuismanagement beslist om het aantal patiënten in de weekenden te verhogen om vermindering van de werkdruk gedurende de week te bewerkstelligen dan zijn de een-stap-wisselingen misschien niet de meest effectieve manier. Traditioneel is de vrijdag een relatief rustige dag voor de operatiekamers. Als bed bezetting moet worden verhoogd in het weekend dan kan men een meer drastische aanpak van het veranderen van de MSS overwegen.
- 9 -
- 11 -
Word of thanks
This research would not have been possible without several persons and I want to take the time to thank them.
First of all I want to extend my gratitude to my supervisor Bernd van den Akker, whose clear perspective has always been of great help. He held the reins but I barely noticed it even if I were paying close attention. As a result I could completely plan my assignment and make major decisions on my own (or so I thought). Still, conversing about bigger issues (the state of health care in the Netherlands, soccer, religion, economics, etc.) or even greater matters (life and amazement about it) was where I derived the most pleasure from.
It has also been a great honour for me to have Erwin Hans as my supervisor. He has been able to solve problems I wasn’t even experiencing yet. His advice would always surprise me because I never see problems coming if they are still 6 months in the future. His advice has allowed me to swiftly avoid pitfalls long before they presented themselves. His wisdom, intelligence and humour were of great aid during the process.
I would like to thank Ingrid Vliegen as well, whose late entrance did not restrain her from urging me to take strides in improving my research.
Furthermore, I could never repay my colleagues at the Isala Klinieken. Numerous lunch breaks, conversations, jokes and stories have been shared. The occasional vrijdag-patat-met will be a pleasant memory I will not forget.
The Kwaliteit & Veiligheid section has made me feel very welcome indeed, always inviting me to their shared activities (meetings, presentations, lunches and drinks). For this I would like to thank them.
Additionally I would like to thank my family for everything they have done for me. And last but very definitely not least, I want to thank my sweet girlfriend. Her love, support and understanding have been crucial for this project. Without her I could have never achieved what I have.
Many more have been conducive for my research. I will not mention you here, but you know who you are. If I can ever return the favour, you know where to find me.
Ronald Vlijm
- 13 -
Table of Contents
1 Introduction ... 19
-1.1 Isala Klinieken Zwolle ... 19
-1.2 Problem ... 20
-1.3 Research questions and approach ... 24
-2 Process analyses: ORplanning versus ward planning and its measurement ... 25
-2.1 System characteristics ... 25
-2.2 Planning methodology ... 28
-2.3 Restrictions for altering MSS ... 29
-2.4 Workload at nursing wards ... 29
-3 Desired situation ... 36
-3.1 Available literature ... 36
-3.2 Master surgery schedule ... 36
-3.3 Integrating bedlevelling into surgery scheduling ... 36
-3.4 Conclusion ... 37
-4 Testing interventions: model ... 38
-4.1 The model: Surgery scheduling and nursing wards ... 38
-4.2 Model description ... 38
-4.3 Input of the model ... 40
-4.4 Model extensions ... 43
-4.5 Model assumptions ... 44
-4.6 Expectations ... 44
-5 Results of experimentation ... 46
-5.1 Workload leveling ... 46
-5.2 Increased performance ... 47
-5.3 Current performance and improvement techniques ... 48
-5.4 Altering the master surgery schedule ... 55
-5.5 Restricting the number of operations within an ORblock ... 66
-- 14 --
5.7 Specific Ward distributions ... 69
-5.8 Defining subspecialties ... 73
-6 Implementation ... 75
-6.1 Swapping ORblocks ... 75
-6.2 Tactics vs. operations ... 76
-6.3 Involved stakeholders ... 76
-6.4 A model for change ... 76
-7 Conclusions ... 79
-7.1 Research questions ... 79
-7.2 Relevance ... 80
-- 15 --
List of Figures
Figure 1.1: Average number of nonsurgery patients per day ... 22
Figure 1.2: Average number of surgery patients per day ... 22
Figure 2.1: The current MSS for the Weezenlanden (a), 2011 ... 26
Figure 2.2: The current MSS for the Weezenlanden (b), 2011... 26
Figure 2.3: The current MSS for Sophia, 2011 ... 27
Figure 2.4: The number of admissions of surgery patients during a typical month ... 30
Figure 2.5: Confidence intervals of the admissions of emergency patients ... 30
Figure 2.6: Statistically significant differences between days for emergency patients ... 31
Figure 2.7: Confidence intervals of admissions of elective patients ... 31
Figure 2.8: Statistically significant differences between days for elective patients ... 31
Figure 2.9: The discharges for all surgery patients on different week days ... 32
Figure 2.10: The confidence interval of the number of discharges of emergency patients ... 32
Figure 2.11: Statistically significant differences between the numbers of discharges for emergency patients .... 33
Figure 2.12: The confidence interval of the number of discharges of elective patients ... 33
Figure 2.13: Statistically significant differences between the numbers of discharges of elective patients ... 33
Figure 2.14: The average beds needed for elective surgery patients at the Weezenlanden ... 34
Figure 2.15: The average beds needed for surgery patients at the Sophia location ... 35
Figure 4.1: Demonstration of overlapping MSS ranges ... 40
Figure 4.2: The frequency of the length of stay for Gynaecology surgery patients ... 42
Figure 5.1: The current MSS of the Weezenlanden location (a) ... 49
Figure 5.2: The current MSS of the Weezenlanden location (b)... 49
Figure 5.3: Bell curve: the mean plus the standard deviation covers about 84 percent of cases ... 51
Figure 5.4: The average bed demand versus the model output for the WL case ... 51
Figure 5.5: The average bed demand versus the model output for the SZ case ... 52
Figure 5.6: The average bed demand versus the model output (times 0.88) for the WL case ... 52
Figure 5.7: The average bed demand versus the model output (times 0.9) for the SZ case ... 53
Figure 5.8: The average number of admissions for WL versus the model output ... 53
Figure 5.9: Average number of admissions for SZ versus the model output ... 54
Figure 5.10: Average number of discharges for WL versus model output ... 54
Figure 5.11: Average number of discharges for SZ versus model output ... 55
Figure 5.12: The model output for the Isala Klinieken ... 55
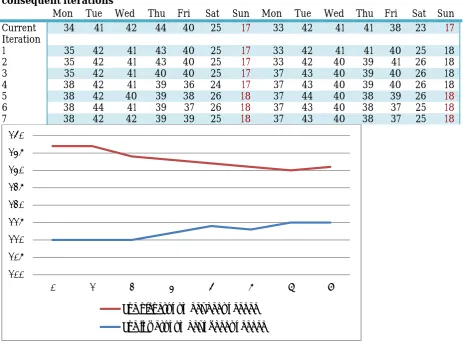
Figure 5.13: The development of the bed demand through iterations ... 57
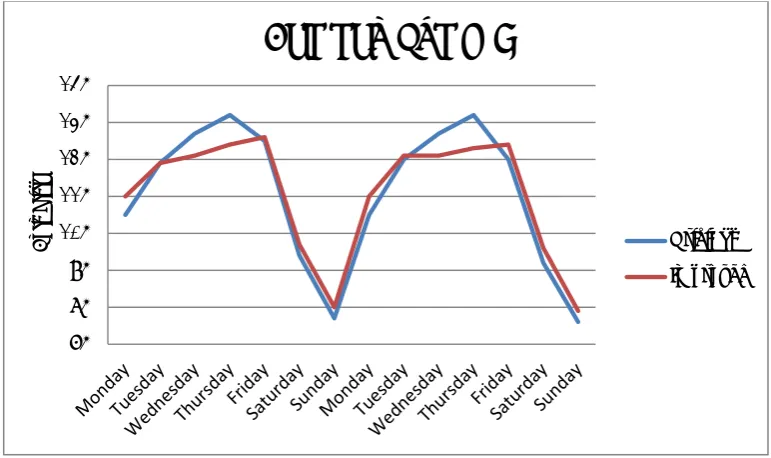
Figure 5.14: A comparison between the current bed performance and an improved solution ... 59
Figure 5.15: A comparison between the number of daily admissions now and after seven iterations ... 59
Figure 5.16: A comparison between the number of daily admissions now and after seven iterations ... 60
Figure 5.17: The evolution of workload through several iteration and the contribution of each factor ... 60
Figure 5.18: An improved version of the MSS of the Weezenlanden location (a) ... 61
Figure 5.19: An improved version of the MSS of the Weezenlanden location (b) ... 61
Figure 5.20: The model output for the current bed demand for the Sophia location ... 62
Figure 5.21: The development of bed demand through iterations ... 63
Figure 5.22: A comparison between the current bed performance and an improved solution ... 64
Figure 5.23: A comparison between the number of daily admissions now and after seven iterations ... 65
Figure 5.24: A comparison between the number of daily discharges now and after seven iterations ... 65
Figure 5.25: The evolution of workload through several iteration and the contribution of each factor ... 66
Figure 5.26: Bed demand for WL ward A2 now versus after implementation of the heuristic ... 72
Figure 5.27: Ward distributions Weezenlanden after seven iterations of the heuristic ... 72
Figure 5.28: An MSS that only includes the subspecialties of general surgery ... 74
Figure 6.1: A possible new distribution for general surgery (a) ... 75
Figure 6.2: A possible new distribution for general surgery (b) ... 75
Figure 6.3: A possible new distribution for general surgery (c) ... 75
Figure 7.1: Bed demand for SZ ward A1 now versus after implementation of the heuristic ... 86
- 17 -
List of tables
Table 1.1: Isala Klinieken: Facts and figures ... 20
Table 1.2: Framework for hospital planning and control... 23
Table 2.1: Weezenlanden: Wards and bed counts ... 25
Table 2.2: Sophia: Wards and bed counts ... 27
Table 4.1: Cjdistributions for urology ... 41
-Table 5.1: Demonstration of how to alter fractions of occurrences of the number of patients operated in an ORblock ... 48
-Table 5.2: The number of beds needed on every day in the cycle for the current situation and consequent iterations ... 56
Table 5.3: The number of daily admissions in the cycle for the current situation and consequent iterations ... 56
Table 5.4: The number of daily discharges in the cycle for the current situation and consequent iterations ... 57
Table 5.5: The top five best swaps and their performance of seven iterations (a) ... 57
Table 5.6: The top five best swaps and their performance of seven iterations (b) ... 58
-Table 5.7: The number of beds needed on every day in the cycle for the current situation and consequent iterations ... 62
Table 5.8: The number of daily admissions in the cycle for the current situation and consequent iterations ... 62
Table 5.9: The number of daily discharges in the cycle for the current situation and consequent iterations ... 63
Table 5.10: The top five best swaps and their performance of seven iterations ... 64
Table 5.11: The maximum number of patients operated in an ORblock for several specialties ... 66
Table 5.12: A possible new distribution for general surgery ... 67
Table 5.13: A possible new distribution for plastic surgery ... 67
Table 5.14: The distributions after the intervention for general surgery ... 68
Table 5.15: Proposed swaps for different percentiles of bed demand ... 69
Table 5.16: Ward distributions Weezenlanden (a) ... 70
Table 5.17: Ward distributions Weezenlanden (b) ... 71
Table 5.18: Ward distributions WL after seven iterations of the heuristic (a) ... 71
Table 5.19: Ward distributions Weezenlanden after seven iterations of the heuristic (b) ... 71
Table 5.20: The most effective swaps of each iteration when considering subspecialties of general surgery .... 74
Table 5.20: Ward distributions for Sophia (a) ... 84
Table 5.21: Ward distributions for Sophia (b) ... 84
Table 5.22: Ward distributions for Sophia (c) ... 84
Table 5.23: Ward distributions for Sophia after seven iterations (a) ... 85
Table 5.24: Ward distributions for Sophia after seven iterations (b) ... 85
- 19 -
1
Introduction
Patients that undergo surgery at one of the operating rooms (OR) at the Isala Klinieken Zwolle have to spend some time at the wards to receive care. The recovery of these patients takes place on the intensive care (IC) and the nursing wards. The nursing wards face a high variability in bed occupancy and hence workload. This variability is partly caused by the OR-planning. The surgeries that take place in operating rooms are governed by the biweekly master surgery schedule (MSS). The MSS prescribes which surgical specialties are operating in particular operating rooms on particular days.
Isala Klinieken Zwolle is on the brink of a new era. In 2013 the hospital is moving to a new location, where the two main locations will merge and move into one building. In this new hospital there will be fewer operating rooms and fewer beds.
Other interesting developments are taking place in the health care sector in the Netherlands. The Dutch population is rapidly ageing, health expenditures are rising, waiting lists are still long, and public opinion with regard to health care is changing. Also, in recent years the Dutch Government decided that reductions in health care costs are necessary, and has consequently implemented changes that would facilitate the intended cost reductions. All of a sudden hospitals compete with one another.
Even though the budgets are tightened, hospitals in general are faced with a growing demand for better care. Patients are getting more knowledgeable and stronger opined. More and more factors such as quality and safety start playing a role. The rules and regulations with regard to these aspects are being updated constantly, thus getting harder and more expensive to adhere to.
In fact, during the years, many constraints have been added to the realm of providing health care, and this has only made delivering proper care tougher. It is for these reasons that health care optimization has never been more relevant.
Section 1.1 introduces the Isala Klinieken, Section 1.2 gives a problem definition and Section 1.3 poses the research objective and research questions.
1.1
Isala Klinieken Zwolle
Isala Klinieken Zwolle is one of the biggest hospitals and the biggest non-academic hospital in the Netherlands. Currently, Isala Klinieken Zwolle has two locations, De Weezenlanden and Sophia, both located in Zwolle. Isala Klinieken has two additional outpatient clinics, one in Kampen and in one in Heerde. Isala has two laboratory locations in Zwolle, one for pathology, and one for microbiology and infection illnesses.
- 20 - Table 1.1: Isala Klinieken: Facts and figures Source: Annual reports Isala Klinieken
2007 2008 2009
Nursing days 263.765 267.078 279.238
Inpatient 42.339 44.334 46.060
Outpatient 471.609 502.294 522.342
Employees 5691 5275 5407
Medical specialists 236 238 250
Turnover 333.146 365.180 401.650
Beds 931 964 994
In addition to the impending migration, the organizational structure is currently being updated. Heading the new organizational structure is the Board of Directors, which forms the Team of Directors together with three Operational Directors. Each of the Operational Directors will be assigned a number of Resultaat Verantwoordelijke Eenheden (RVEs), which are clustered specialities. Each of these RVEs has an RVE-manager who reports to their respective Operational Director.
1.2
Problem
In Section 1.2.1 it is explained why the research was initiated. In Section 1.2.2 the research context and its relevance are explained. In Section 1.2.3 the problem is defined in both qualitative and quantitative terms. In 1.2.4 the problem is put in perspective in order to understand on what level is being operated.
1.2.1
Motivation and goal
Currently there is a suspicion that the performance with regard to bed capacity is not optimal. There is a lot of variability in the amount of patients on the wards on different weekdays. In addition to this, there is a lot of variability in the amount of patient admissions and patients discharged on different days of the week. The fluctuating nature of the amount of patients and amount of work to be done at the wards leads to sub-optimal care. When nurses have too much work on their hands individual care is of a lower quality. On the other hand, on days where too many personnel are present, personnel is not being used effectively. Recent studies show that patient safety is compromised in cases where the workload is either too high or too low (Kc & Terwiesch, 2009). Other studies find that high workload leads to a higher risk of mortality and higher failure-to-rescue rates and that it is likely to cause nurse burn-out and job dissatisfaction (Aiken et al., 2002).
It all boils down to this: because the workload is erratic and predictability is low it is impossible to have excellent personnel planning. The department of Patient Logistics has developed a tool to predict workload more accurately (Vlijm, 2011a). This tool takes the patients that are planned for surgery as input and determines the amount of care individual patients is expected to generate. This allows OR-planners and ward managers to understand the impact of adding a patient to an OR-block. It also makes it easier to plan personnel accordingly. This model is a great example of a tool that works on the operational level. The model proposed in this research operates on the tactical level. Ideally the flow of patients is more stable in order to improve scheduling, performance and the quality of care.
1.2.2
Research context
- 21 -
Lastly, Vanberkel asserts that the length of stay (LOS) of patients can be predicted as soon as the patient is being diagnosed. It is his impression that this knowledge can be used to the hospitals’ advantage.
Presently, when planning the OR the LOS of patients is generally not considered, i.e. nursing wards are ignored. This results in highly variable numbers of patients in the wards on different days of the week. The current variability of the operating rooms is detrimental to the performance of down ward departments, in this case the IC and the nursing wards (Hopp, W.J. & Spearman, M.L., 2008).
1.2.3
Problem definition
To get insight in the nature of the problems some issues with current bed planning are listed. These are concerns that bother ward managers.
• Ward managers feel that there are too few beds available, and they feel that this might be because OR planning does not explicitly consider availability of beds on the wards.
• Last minute alterations in the OR-schedule lead to a high influx of patients at inappropriate times
• On some days many patients from one specialty arrive, at other days only a few. This results in peak workloads at some times and to overcapacity of personnel at other times.
• Emergency patients are not considered in the process of ward planning, which leads to cancellations of elective patients.
The first concern leads to believe that variability on the wards is not leveled, because otherwise this situation would not occur on a regular basis. The second issue suggests that it is possible to operate a lot of patients that need small interventions without notice, causing an unexpected influx of patients to the wards. The third bullet stresses the importance of admissions as being an import consideration in establishing the level of workload on a ward at a given time. The fourth bullet could very well be a consequence of the fact that the elective patient stream is not leveled, because if it were, it would be easier to accommodate emergency patients.
These problems point in the same direction: apparently there is a lack of predictability and an excess of variability for the nursing wards. In this chapter we conduct an initial data analysis to quantify the concerns.
We must consider two types of patients: the first category consists of patients that require surgery, the second one does not. These two types of patients occur in two categories, elective patients (patients that allow planning) and emergency patients.
Non-surgery patients arrive at a stable rate, which is shown in Figure 1.1. In this figure the columns are the average total numbers of non-surgery patients on the different weekdays. The dark-blue part of the columns are the emergency patients and the light blue area comprise elective patients. The lines show the mean plus / minus the standard deviation, and the blue dots the maximum number of patients that occurred during the year.
- 22 -
Figure 1.1: Average number of non-surgery patients per day Source: iZis, 2010, n = 72853
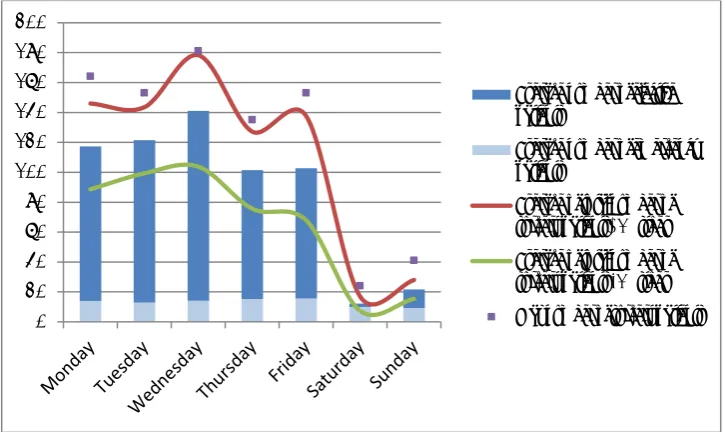
The second category of patients are the surgery patients. Figure 1.2 show that these show more variability and larger standard deviations from the mean. Note however that large fluctuations in emergency patients do not occur (safe from the fact that less emergency patients arrive in the weekend compared to week days).
Figure 1.2: Average number of surgery patients per day Source: iZis, 2010, n = 32225
So far four streams of patients have been analysed. The figures show how there is only one of these that shows high variability, which happens to be the elective surgery patients.. Literature hastens to suggest that in production processes a stable arrival process is favoured over highly variable streams (Hopp, W.J. & Spearman, M.L., 2000). Highly variable arrival streams result in congestion and peak workloads at the nursing wards.
0 50 100 150 200 250 300 350 400 450 500
Average number of emergency patients
Average number of elective patients
Average of total number of nonsurgery patients -1*stdev
Average of total number of non-surgery patients + 1*stdev
Max number of non-surgery patients 0 20 40 60 80 100 120 140 160 180 200
Average number of elective patients
Average number of emergency patients
[image:22.595.70.433.420.636.2]- 23 -
The admission of elective patients is a direct result of the MSS. It is not surprising that empty beds at some times alternate times of high workloads and cancellations of patients. This research focuses on leveling this particular stream by modifying the MSS and adding planning rules to the process of planning elective patients. In other words, we investigate whether altering the MSS results in lower workload variability, and also whether limiting the amount of patients operated in an OR-block achieves this result.
1.2.4
Theoretical framework
After investigation of the problems, the model from Hans et al. (2011) is used to position the area of interest. The authors distinguish four areas of interest and four levels of control (see Table 1.2). The levels are the strategic (long-term), tactical (medium term), and the operational (short term) level. On the operational level a further distinction is made between the offline and online level. The strategic level is the meta-level where the hospital- encompassing, long term decisions are made, such as which costumer groups to cater to, which facilities should be expanded and so on.
On the tactical level the production targets should be translated into OR time. Each specialty gets assigned OR time so that their demand is met and the hospital’s production targets are realized. The third level, the offline operational planning deals with the elective patients in specific OR-blocks. The number of patients and the order in which they are planned take place on this level. The lowest level, the online operational planning concerns ad-hoc changes. If an emergency patient arrives the planning has to be altered in order to allow the emergency patient to be operated. This research is concerned with the tactical level, because the MSS is evaluated and iteratively altered.
Table 1.2: Framework for hospital planning and control Medical Planning Resource
capacity planning
Materials
planning Financial planning
Strategic Research,
development of medical protocols Case mix planning, capacity dimensioning, workforce planning
Supply chain and
warehouse design Investment plans, contracting with insurance
companies
Tactical Treatment
selection, protocol selection Block planning, staffing, admission planning Supplier selection, tendering
Budget and cost allocation
Offline Diagnosis and
planning of an individual treatment Appointment scheduling, workforce scheduling Purchasing, determining order sizes
DRG billing, cash flow analysis
Online Triage,
diagnosing emergencies and complications Monitoring, emergency coordination Rush ordering, inventory replenishing Billing complications and changes
- 24 -
future organizational and economic circumstances. Of the four managerial areas we are specifically concerned with resource capacity planning.
1.3
Research questions and approach
In this paragraph the research question and the accompanying research questions are detailed. The research objective is the following:
Create a decision tool that is able to predict the effects of alterations in the master surgery schedule on the bed demand of the nursing wards. Using this model we are able to recommend alternative configurations of the MSS that perform better.
In order to reach the objective the following research questions will be answered.
1. How is the hospital organized and how does planning take place?
This question is answered in chapter 2. The first part of the question is concerned with the system. It includes a description of the hospital in general, the operating rooms and the nursing wards. The second part of the question deals with the planning of the different departments.
2. What are indicators for the workload and what is the current performance of the hospital?
Section 2.4 gives indicators for workload. To determine the properties of the workload a data analysis is carried out.
3. How can we connect OR planning to ward planning in order to improve performance?
We answer this question in Chapter 3, where literature hands us ideas for interventions we may apply to improve the MSS.
4. How can we model the relationship between the OR and the wards and how do we construct alternative OR-schedules?
In Chapter 4 we deal with the issue of modelling the relationship between the OR-department and the workload at the wards. We will also discuss how we generate alternative configurations.
5. How can we evaluate the performance of a master surgery schedule?
In Chapter 5 we formulate an objective function to aid in evaluating the performance and we analyse the results of the model.
6. How would the hospital perform after implementing the alternative solutions?
After generating new master surgery schedules and constructing performance measures we evaluate the proposed schedules in Chapter 5.
7. What are the main findings and the implications of the research in practice?
- 25 -
2
Process analyses: OR-planning versus ward planning and its
measurement
In Section 2.1 the system and its characteristics are analysed. In Section 2.2 we discuss the OR-planning and the ward OR-planning. In Section 2.3 we discuss the master surgery schedule and in Section 2.4 we consider the performance of the wards.
2.1
System characteristics
2.1.1
Weezenlanden
Weezenlanden has twelve operating rooms available, of which ten are general and two are day care operating rooms. The operating rooms are similar in size and composition. Approximately half of the operating rooms are dedicated ORs. The others are divided over several specialties and are used as is specified in the master surgery schedule.
The following specialties are available at Weezenlanden: orthopaedics, urology, ear, nose and throat surgery, dental surgery, thorax surgery, jaw surgery, eye surgery, cardiology, pulmonology, neurology, and neurosurgery. The wards that are available in the Weezenlanden are located in two separate wings and are of different sizes. The capacity of the wards is given in Table 2.1.
In Figure 2.1 and Figure 2.2 the MSS of the Weezenlanden location is given. The figure shows for the ten ORs how the OR-blocks are divided over the specialties during a typical cycle of two weeks.
The numbering of specialties is as follows:
• Two / green / ORT: Orthopaedics • Four / pink / DS: Jaw surgery • Eight / yellow / URO: Urology
• Fourteen / brown / ENT: Ear nose throat surgery • Fifteen / red / AN: Anaesthetics
• Twenty / blue / THO: Thorax surgery • Twenty-two / purple / JAW: Dental surgery • Forty-two / white: empty / flexible slots
Table 2.1: Weezenlanden: Wards and bed counts Source: Cognos, 2010
Wards
A-wing Number of beds Wards B-Wing Number of beds
A2 39 B1 12
A4 41 B2 24
A5 44 B3 39
A6 33 B4 42
A7 36 B5 39
- 26 -
Figure 2.1: The current MSS for the Weezenlanden (a), 2011
Figure 2.2: The current MSS for the Weezenlanden (b), 2011
2.1.2
Sophia
At the Sophia location of the Isala Klinieken there are ten operating rooms available, two of those are day care operating rooms and eight are general ORs.
The following specialties are hosted at the Sophia location of the Isala Klinieken: orthopaedics, ear nose throat surgery, general surgery, plastic surgery, gynaecology, gastroenterology, neurosurgery, psychiatry, paediatrics, and internal medicine. Table 2.2 and in Figure 2.3 show details with regard to the nursing wards and the MSS of Sophia.
The numbering of specialties in the Sophia MSS are as follows:
• One / yellow / GS: General surgery • Three / purple / PS: Plastic surgery • Nine / blue / GYN: Genealogy WEEZENLANDEN
M A M A M A M A M A
Monday ORT ORT ORT ORT URO URO ENT ENT ORT ORT
Tuesday ORT ORT ORT ORT URO URO ENT ENT ORT ORT
Wednesday ORT ORT ORT ORT URO URO ENT ENT URO URO
Thursday ORT ORT ORT ORT URO URO ENT ENT DS DS
Friday ORT ORT URO URO ENT ENT
Saturday Sunday
Monday ORT ORT ORT ORT URO URO ENT ENT ORT ORT
Tuesday ORT ORT ORT ORT URO URO ENT ENT ORT ORT
Wednesday ORT ORT ORT ORT URO URO ENT ENT ORT ORT
Thursday ORT ORT ORT ORT URO URO ENT ENT URO
Friday URO ENT ENT
Saturday Sunday
OR 1 OR 2 OR 4 OR 5 OR 6
WEEZENLANDEN OR 7 OR 8 OR 9 OR 10 OR 11
M A M A M A M A M A
Monday DS DS AN THO THO THO THO THO THO THO
Tuesday JAW JAW THO THO THO THO THO THO THO THO
Wednesday JAW JAW THO THO THO THO THO THO THO THO
Thursday JAW JAW THO THO THO THO THO THO THO THO
Friday JAW JAW THO THO THO THO THO THO
Saturday Sunday
Monday JAW AN THO THO THO THO THO THO THO
Tuesday JAW JAW THO THO THO THO THO THO THO THO
Wednesday URO URO THO THO THO THO THO THO THO THO
Thursday JAW JAW THO THO THO THO THO THO THO THO
Friday JAW JAW THO THO THO THO THO THO
- 27 - • Eighteen / green / NEU: Neurosurgery • Twente-three / pink / EM: Emergency OR • Forty-two / white: empty / flexible slots
Table 2.2: Sophia: Wards and bed counts Source: Cognos, 2010
Wards
A-wing Number of beds Wards B-Wing Number of beds Wards Number of beds
A1 10 B1 43 D3 30
A1P 15 B2 41 H0 27
A3 42 B3 44 K1B 16
A5 18 B4 44 K2 8
A5C 9 B5 13 K3 30
A6 17 B5G 17 M5 12
B6 21 NEO 14
Figure 2.3: The current MSS for Sophia, 2011
2.1.3
The new hospital
A standard ward in the new hospital will have 24 beds twice. There are eight four-person rooms, one two-person room and fourteen one-person rooms in each nursing ward (Bureau Nieuwbouw, 2009). This amount totals to about 500 regular beds. Next to the regular beds there will be around 200 ‘heavy’ beds (ICU, MCU, CCU etcetera). There are also about 200 day care beds and about 50 beds for psychiatry patients.
The new location will have 8 general operating rooms and 6 dedicated operating rooms. There will also be 4 day-care ORs. As of now the OR-schedules are empty ones. It is important to realize that filling an empty OR-schedule is a different matter than altering a current schedule. (Merely altering an existing master surgery schedule generates a far smaller solution space than comparing all possible solutions.)
2.1.4
Nursing wards process
In this section we discuss the patient flow of surgery patient types. SOPHIA
M A M A M A M A M A M A M A M A
Monday NEU NEU GS GS EM EM GS GS NEU NEU GS GS GYN GYN PS PS
Tuesday GS GS GS GS EM EM GS GS NEU NEU GYN GYN GYN GYN PS PS
Wednesday GS GS GS GS EM EM GS GS NEU NEU PS PS GYN GYN PS PS
Thursday NEU GS GS EM EM GS GS NEU NEU GS GS GYN GYN GS GS
Friday GS GS GS GS EM EM PS PS NEU NEU EM EM GYN GYN PS PS
Saturday Sunday
Monday NEU NEU GS GS EM EM GS GS NEU NEU 1 1 GYN GYN PS PS
Tuesday GS GS GS GS EM EM GS GS NEU NEU GYN GYN GYN GYN PS PS
Wednesday GS GS GS GS EM EM GS GS NEU NEU PS PS GYN GYN PS PS
Thursday NEU GS GS EM EM GS GS NEU NEU GS GS GYN GYN GS GS
Friday GS GS GS GS EM EM PS PS NEU NEU EM EM GYN GYN PS PS
Saturday Sunday
OR 7 OR 8
- 28 -
2.1.4.1 Elective patients
Elective patients typically enter the hospital after being directed there by a general practitioner. The patient then sees a specialist or a nurse practitioner that diagnoses the patient and finds a suitable treatment. If surgery is necessary the patient is send to pre-operative screening. When the patients is informed and deemed ready for surgery an appointment for surgery is planned. Patients that undergo surgery will be checked in the wards, at least two hours before surgery takes place. The patients are made ready for surgery, and then they are operated. Afterwards the patients can go to PACU if necessary and then to the nursing wards (either via the IC or directly).
After the operation, generally, the patients receive medication and treatment according to their needs. When the patient is ready to go home the patient6 is discharged from the hospital.
2.1.4.2 Emergency patients
Emergency patients arrive either by ambulance or, in some cases, report at the outpatient clinic. Emergency patients that do not require immediate surgery go to the patient wards. Other emergency patients may go to the Intensive Care or to an OR. If required the patient goes from the OR to either the PACU or the IC and then to the nursing wards. When the patients are done receiving hospital care they can be discharged.
2.2
Planning methodology
2.2.1
OR-planning and surgery planning
In the strategic assignment the case-mix planning is defined. In this phase it should be estimated how much OR-time each specialty needs. However, at the Isala Klinieken the case-mix planning has not been altered for years. RVE’s are hard-pressed to accept a lower amount of OR-time, even when prognosis dictates they should be able to do with less. Should they ever meet an increasing influx of patients they are afraid they will not be reassigned the necessary OR-time (Vlijm, 2011b).
On the tactical level the specific OR-blocks need to be assigned to specific specialties. The result of this is the master surgery schedule. Section 2.3 describes which factors play a role in designing an MSS. In the operational level of OR-planning specific patients are planned in the OR-blocks. We can distinguish between two types of planning required for two types of patients. The planning of elective patients is called offline planning of patients, whereas the planning of emergency patients is called online planning.
2.2.2
Hospitalization planning
Now that patients are planned in the specific time-slots they are being hospitalized. The elective patients are asked to check in at a certain time and date and are also inserted in the hospital information system iZIS, according to their diagnosis / treatment relation. The ward planners get the required information from this system and make the ward planning. The information is often only available one day before actual hospitalization takes place.
- 29 -
Another reason why ward managers are not happy to accept patients from other specialties is that they simply occupy their own scarce resources. For these reasons it is beneficial to keep the number of patients being nursed at a ward different than their preferred nursing ward to a bare minimum.
2.3
Restrictions for altering MSS
The master surgery schedule is the cyclic OR-block plan for a hospital. The MSS is reviewed every three months and is organized according to current demand. In practice this means that for the most part the previous MSS are copied without too much ado. Sessions are planned (i.e. specialties are planned in OR-blocks) and finally specific patients are planned in the operational phase.
2.3.1
Level of control
In the Isala Klinieken Zwolle a biweekly master surgery schedule exists. The MSS repeats itself every two weeks, bar periods where fewer personnel are available. In the latter case a reduced MSS is made available. The design of a MSS is a complex matter since many RVE’s are competing for the same resources. Also, different specialists might only be available part of the time, because they may have responsibilities elsewhere.
2.3.2
Performance of an MSS
It is difficult to actually asses the quality of the performance of an MSS. The performance is often measured using performance measures such as patient waiting time, utilization, leveling, makespan, patient deferrals and so on (Cardoen et al., 2010).
An MSS can be optimized locally on some of these performance measures (i.e. without considering downward departments such as the intensive care and the nursing wards), using mathematical programming for instance. The fact is, that many additional constraints are introduced, e.c. some operations may not be allowed to be planned on consecutive days because the cleaning of certain crucial equipment may preferably not be done overnight, but during office hours.
2.3.3
Optimization constraints
When optimizing an MSS many constraints enter the equation. Examples of these types of constraints are: physicians may not be able for operating on some days, materials may not be present on certain days, and there are not enough IC beds available for certain operations and so on. A benefit of omitting constraints is that they can be removed once they are spotted, e.g. if a certain sequence of OR-blocks is impossible because the IC-department is unable to meet the increased demand, one can compare the costs of increasing capacity at the IC-department and compare these to the expected reward of the suggested OR-block sequence.
2.4
Workload at nursing wards
2.4.1
Admission of patients
First we examine the average number of admissions for surgery patients. In the first chapter the capriciousness of the average admissions was already mentioned. In this paragraph the numbers are put under closer inspection.
- 30 -
Figure 2.4: The number of admissions of surgery patients during a typical month Source: iZIS, October (2010), n = 2590
The average admissions of patients are displayed in the Figure 1.2. In Figure 2.5 show the confidence intervals for the admission of emergency patients. The figure shows the confidence intervals of the admission of emergency patients on the weekdays and in the weekend. The arrivals during the week do not show significantly different results, as can be seen in Figure 2.6. However, during the weekend significantly fewer emergencies arrive.
Figure 2.5: Confidence intervals of the admissions of emergency patients Source: iZIS, 2010, n = 4734
0 20 40 60 80 100 120 140 160
1 3 5 7 9 11 13 15 17 19 21 23 25 27 29 31
N
r. o
f a
dmi
ss
io
ns
Day of the month
- 31 -
Figure 2.6: Statistically significant differences between days for emergency patients
Regarding the number of admissions of elective patients are inspected as well. Here we do find significant difference between working days, as is shown in Figures 2.7 and 2.8. The suspicion that the number of admissions for elective patients vary largely over the days can be deemed correct. This supports the qualitative concerns of head of wards and nursing personnel, which were discussed at an I-Lean workshop on 14 February 2011.
Figure 2.7: Confidence intervals of admissions of elective patients Source: iZIS, 2010, n = 27491
Figure 2.8: Statistically significant differences between days for elective patients Monday Tuesday Wednesday Thursday Friday Saturday Sunday
Monday no no no no ye s ye s
Tuesday no no no ye s ye s
Wednesday no no ye s ye s
Thursday no ye s ye s
Friday ye s ye s
Saturday no
Sunday
Monday Tuesday Wednesday Thursday Friday Saturday Sunday
Monday no ye s ye s no ye s ye s
Tuesday ye s ye s ye s ye s ye s
Wednesday ye s ye s ye s ye s
Thursday no ye s ye s
Friday ye s ye s
Saturday ye s
- 32 -
2.4.2
Discharges of patients
[image:32.595.71.413.518.721.2]In this section we explore the discharges of patients. Just like patient admissions, patient discharges are labour intensive, they are a measure of workload. On the day of discharge, patients need to be visited, paperwork needs to be prepared, etc. Figure 2.9 shows the discharge statistics for all surgery patients.
Figure 2.9: The discharges for all surgery patients on different week days Source: iZIS, 2010, n = 32225
To examine the discharges we distinguish between emergency patients and elective patients. The goal of this exercise is to find out whether for different patient groups a significant difference exists between the different days.
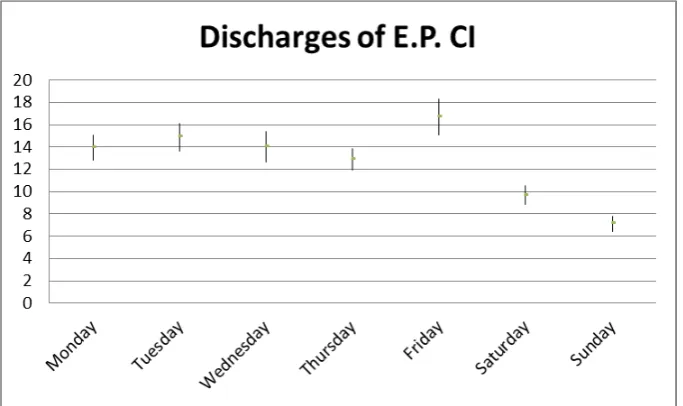
The discharges of emergency patients seem to be spread evenly over the week. Figure 2.10 shows the confidence intervals for the different weekdays.
- 33 -
Here we can see that not all days have overlapping amounts of discharges. Figure 2.11 provides an overview of this phenomenon.
Figure 2.11: Statistically significant differences between the numbers of discharges for emergency patients
Figure 2.12 shows that most notably on Friday significantly more emergency patients are discharged compared to Monday and Thursday. Why this is the case is something that should be addressed. It is plausible that emergency patients are sent home for the weekend to be taken care of by family if at all possible. It is also convenient for staff to have fewer patients in the nursing wards in the weekends.
Figure 2.12: The confidence interval of the number of discharges of elective patients Source: iZIS, 2010, n = 27491
Figure 2.13: Statistically significant differences between the numbers of discharges of elective patients
Monday Tuesday Wednesday Thursday Friday Saturday Sunday
Monday no no no ye s ye s ye s
Tuesday no no no ye s ye s
Wednesday no no ye s ye s
Thursday ye s ye s ye s
Friday ye s ye s
Saturday ye s
Sunday
Monday Tuesday Wednesday Thursday Friday Saturday Sunday
Monday ye s ye s ye s ye s ye s ye s
Tuesday ye s no ye s ye s ye s
Wednesday ye s no ye s ye s
Thursday ye s ye s ye s
Friday ye s ye s
Saturday ye s
- 34 -
There is a lot of variance for discharges for the patients in total. Especially on Wednesdays and Fridays a lot more discharges take place. It stands to reason that while on Wednesdays structurally more patients enter the system; it is also likely to be true that more patients exit the system. This is especially true when wards are full and old patients need to make room for newly arriving patients.
As is evident from Figure 2.12 and Figure 2.13 the number of discharges for elective patients are subject to a lot of variance. It is striking that more discharges occur on Fridays and fewer in weekends. The reason for this is the same as for the emergency patients.
2.4.3
Bed occupancy
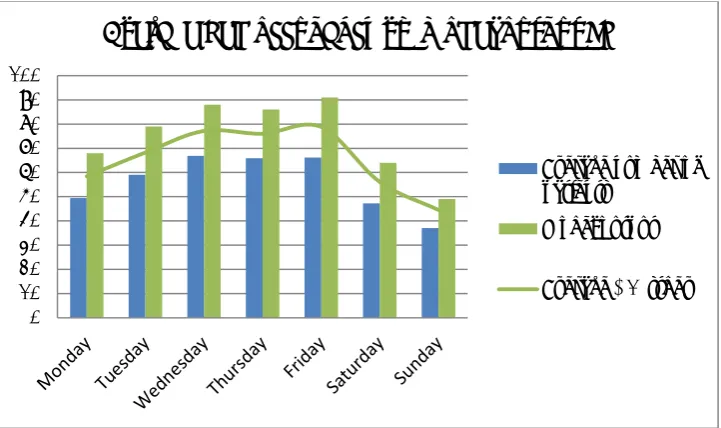
The bed occupancy is also an important measure of workload. The bed occupancy as displayed in Figure 2.14 contains all elective surgery patients. Emergency patients are left out of the equation for two reasons. The first reason is that they are not a great source of variability. The second reason is that it is impossible to influence this patient stream. (However, the criteria for defining emergency patients can be debated. In some cases the term ‘urgent’ may be more appropriate.)
Figure 2.14: The average beds needed for elective surgery patients at the Weezenlanden Source: iZIS, 2010, n = 17318
As is evident from the figures the bed demand rises slowly through the week at the Weezenlanden location and decreases slowly when the weekend comes around. Essentially the wards start the week with low occupancy and then more and more patients are entering the system through the week. As Friday nears the hospital is emptied out to prepare for the weekend.
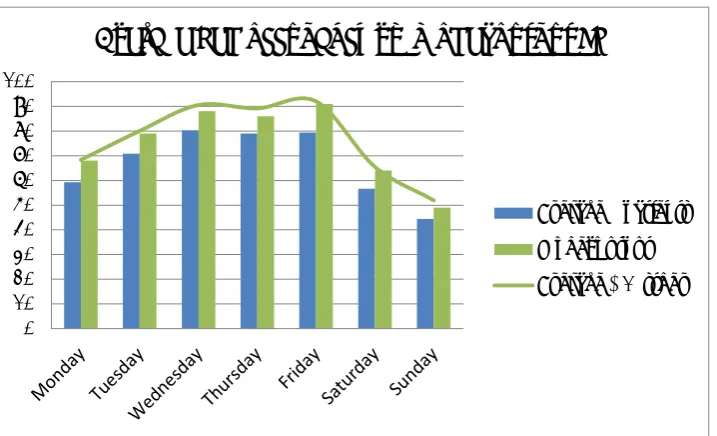
At the Sophia location there is a different trend. On Thursdays there is a dip in bed occupancy but the bed occupancies is relatively high. Still, a lot of patients leave the hospital on Fridays.
0 20 40 60 80 100 120 140
Average bed occupancy WL
- 35 -
Figure 2.15: The average beds needed for surgery patients at the Sophia location Source: iZIS, 2010, n = 14904
2.4.4
Length of stay
Current planning ignores the length of stay of patients. Current planning even ignores the number of available beds at the wards. Even if wards are completely full online changes in the operating schedule might cause in influx of patients that have to be moved elsewhere. This is an example of operational, local decisions that cause problems at downward departments. We suggest that the solution to this problem lies in the tactical level. If the workload of elective patients is levelled the arrival of emergency patients can be handled / anticipated better.
The LOS of patients is dependent on several factors. It depends on which type of surgery the patient has undergone, which medication the patient receives, the patient’s age, and the probabilities of having an infection and so on.
To determine the LOS per patient type iZIS is consulted. The LOSs are grouped by specialty. Some treatments have a better LOS prediction, which depends largely on standardisation and patient category.
2.4.5
Connecting OR-planning and the nursing wards
To get a clearer understanding of the system the number of operations per OR-block is inspected. If we want to use information with regard to the MSS to estimate the number of patients in the nursing wards, we need to know how many patients are operated in an OR-block. For every specialty there is a different distribution of patients. Since it is impossible to determine the real averages of numbers of patients per specialty the number is approximated by the distribution over the year 2010.
0 10 20 30 40 50 60 70 80 90 100
Average bed occupancy SZ
- 36 -
3
Desired situation
As is evident from the first chapters a large amount of the variability on the wards can be attributed to the planning of the ORs. In Section 3.1 we will consider the literature available on the subject. In Section 3.2 we will deal with the concept of master surgery schedule. In Section 3.3 we will determine which parts of the literature optimizes multiple hospital departments, focus on stochastic data and which performance measures can be used to measure performance. In Section 3.4 we will round up this chapter.
3.1
Available literature
Two recent literature reviews help us evaluate the literature available on OR-planning, more specifically OR-planning that acknowledges the actual relationship between OR-planning and ward planning. One of the literature reviews refers to over 120 articles (Cardoen, B. 2010). This literature review finds that 27 articles explicitly recognize the relationship between the OR planning and the ward planning. Of these 27 articles only seven strive to level workload at downward departments. Of these seven there are two that incorporate uncertainty in the sense that they define patient arrivals and the duration of operations to be stochastic variables.
A second literature review conducted by Vanberkel, P.T. et al. (2010) reviews quantitative health care models and examines to what extent the models consider multiple departments. They argue that a focus on single departments yield suboptimal results. Vanberkel et al. (2010) conclude that at the time of their writing 88 articles consider more than one hospital department. Most of these are included in the literature review of Cardoen et al. The researcher contributes to the OR-planning literature as well by developing a model that relates patient workload at the wards to the master surgical schedule.
Since these two literature reviews a couple of new papers have appeared that acknowledge the relation between the OR and the wards. An example would be (Tanfani, E., & Testi, A. 2010). This paper involves many more variables, like collective labour agreements, available OR equipment and the number of surgeons available. Another example is (Adan et al. 2011).
3.2
Master surgery schedule
A master surgery schedule is often mentioned in surgery planning and scheduling literature as a way to optimise OR-utilisation, level resource utilisation and create a robust schedule. An MSS is positioned on the framework of Hans et al. (2011) as resource capacity planning on a tactical level. There are several definitions of what to schedule in an MSS. Van Oostrum et al (2009) define an MSS as a cyclical schedule of recurrent surgery types, while Beliën and Demeulemeester (2007) define an MSS as a cyclical schedule of blocks of OR-time that are assigned to surgeons or specialisms. For the remainder of this report, we use the MSS definition of Van Oostrum et al. (2009). The cyclic execution of an MSS structures the workload of the OR department and the wards because they can better anticipate on demand. Van Houdenhoven et al. (2008) show that the effectiveness of the MSS approach depends on the case-mix of surgery types. Fewer surgery types can be scheduled within an MSS when a high percentage of surgery types occur infrequently. The percentage of surgeries that can be scheduled within an MSS also depends on how well the surgeries are clustered. In another of paper, Van Oostrum et al. (2008) propose an approach to cluster surgeries.
A disadvantage of the MSS approach is that it has little flexibility because it assumes the same resource capacity for each period. The MSS can be updated to account for these changes in resource capacity, but frequent changes contradict with the cyclical nature of an MSS.
3.3
Integrating bed-levelling into surgery scheduling
- 37 -
hospital solutions. Other authors stress the importance of considering more than one department, striving for an integral, holistic approach to deal with health care planning (Vanberkel, P.T. etal., 2010).
To accurately evaluate planning strategies for health care processes it is vital that the inherent uncertainty of health care processes is accounted for. Many models have ignored uncertainty and have opted for a deterministic approach, e.g. (Adan, I. & Vissers, J., 2002). Others have a big scope but do not account for the fact that the LOS of patients is specialty-specific, such as (Akcali, E. et al., 2006). Still others do consider the LOS to be dependent on (sub) specialty, but limit their efforts to only one specialty (Adan, I., 2007).
One approach that connects the OR to the nursing wards is developed by Beliën, J. & Demeulemeester, E. (2007). The authors propose a two-stage model that connects the operating theatre to the nursing wards. They say that the artificial variability that is introduced by the surgery schedules should be avoided if possible. The model uses stochastic arrival rates and procedure durations. Another approach developed by (Beliën, J. et al. 2009) presents a decision support system for cyclic master surgery scheduling and levels bed occupancy at the wards.
Van Oostrum et al., (2008) optimizes room utilization at the OR centre and levels the workload at the downstream departments, such as the IC and the nursing wards. The model generates cyclic MSSs within acceptable time bounds. Their two stage model assumes stochastic durations for surgery procedures but deterministic durations for the LOSs. Also, they only model elective procedures that occur frequently. This subsection of elective procedures accounts for around eighty percent of the patients.
Vanberkel et al. developed a method to project the ward occupancy distributions that follow from the MSS, hence providing us with a method to evaluate minor alterations in the MSS (Vanberkel, P.T. et al., 2011).
3.3.1
Performance measures
In the literature review of Cardoen, Demeulemeester and Beliën, they distinguish between eight main performance measures. These performance measures include patient waiting times, throughput, utilization, leveling, makespan, patient deferrals, financial measures and preferences (Cardoen B., 2010).
3.4
Conclusion
Literature offers many single department models which provide suboptimal solutions, while only a few papers focus on multi-department optimization. Furthermore, to reduce complexity deterministic or partially stochastic data is used. The literature offers many simulation studies and little analytical models, but most papers use mathematical programming in combination with simulation study.
- 38 -
4
Testing interventions: model
4.1
The model: Surgery scheduling and nursing wards
To evaluate the performance of alternative MSSs a model for the tactical level is required. It is clear that the goal of this exercise is not necessarily to try and find an absolute optimal solution. Nevertheless, to evaluate different configurations there is a need for a model that is able to adequately analyse scenarios.
The most important performance measure is the leveling of workload. Workload consists of three factors: bed occupancy, number of admissions and number of discharges. Also, the scope of the model should reach beyond a single department, because it should incorporate the OR-planning and its result on the nursing wards. Furthermore, the model deals with stochastic data rather than deterministic data, in order to predict workload accurately. Vanberkel’s model serves all these purposes and is the model of choice. In this chapter the model is fleshed out and altered to fit our purpose.
4.2
Model description
Vanberkel’s model complete and detailed description can be found in (Vanberkel, P.T. et al., 2009). In this chapter the model is summarized. The model consists of three steps:
1. Distribution of recovering patients from specialty j following from a single OR block 2. Aggregate distribution of recovering patients following from a single MSS cycle 3. Steady-state distribution of recovering patients
The result of the three steps is a calculation of the number of beds needed on each day within an MSS. The steps are discussed in detail in this paragraph.
4.2.1
Step I: Distribution of recovering patients from specialty j following from
a single OR block
In the first step the individual specialties will be considered and the MSS is ignored for now. During an OR-block a certain number of patients receive surgery. The amount of patients that undergo surgery in one OR-block differs and can be described by a probability distribution cj. After surgery each patient
still on the ward on day n has the probability 𝑑𝑛𝑗of being discharged that day. In the following we
compute the probability ℎ𝑛𝑗(𝑥) that n days after carrying out a block of specialty j, x patients of the
block are still in the hospital. Note that n∈{0,1,…,Lj} and 𝑥 ∈{0,1, … ,𝐶𝑗} and that, for example ℎ 3𝑗(5) =
0.25 means that for specialty j, 3 days after surgery there is a 25 percent chance that 5 patients are still recovering in the hospital.
Day n = 0 is defined as the day of surgery and it is assumed that patients occupy a bed all day on the day of surgery even though they may physically be in the OR. This is consistent with practice where patients have a bed reserved for them before surgery. As such the number of patients in the hospital from specialty j on day n = 0 is by definition the number of surgeries performed that day by specialty j. It follows that the distribution for the number of recovering patients on day n = 0 is ℎ0𝑗= cj.
Note that on day n, each patient still in the hospital has a probability dnj of being discharged that day
and (1 − dnj) of staying. If there are k patients in the hospital on day n, then the probability of s patients
in the hospital (where s ≤ k) on day n + 1 is computed using the binomial distribution, (dnj) k−s (1 − dnj)
- 39 -
Summarizing, the distribution for the number of recovering patients on day n is recursively computed by:
So the inputs in this step are cj(x), which is the probability distribution of specialty j completing x
surgeries in one OR-block and dnj which is the probability that a patient who is still present on day n
will be discharged on that specific day, which is calculated from the length of stay per specialty using the following formula:
The output of the first step of the algorithm is thenℎ𝑛𝑗(𝑥) which is the probability distribution of x
patients of a single OR-block of specialty j still present in the ward n days after surgery.
4.2.2
Step 2: Aggregate distribution of recovering patients following from a
single MSS cycle
In this step we consider the previously computed probability distribution ℎ𝑛𝑗 and a given MSS as input.
Although the MSS is cyclical and repeats after Q days, in this subsection we consider only a single MSS cycle in isolation. The MSS defines when each specialty is assigned an OR block and thus the days on which patients of specialty j arrive to the ward. Based on these, we compute the total number of patients in the hospital by means of discrete convolutions.
To calculate the overall distribution of recovering patients, we first identify for each block bi,q (where I
ranges from 1 through I and q ranges from 1 through Q) the impact that this block has on the number of recovering patients in the hospital on days (q, q+1, … ). If z denotes the specialty assigned to block
bi,q which follows from the MSS, then the distributionℎ𝑖,𝑞𝑚 for the number of recovering patients of
block bi,q on day m (𝑚 ∈{1,2, … ,𝑄,𝑄+ 1,𝑄+ 2, … }) is given by:
where 0 means𝑃�ℎ�𝑚𝑖,𝑞> 0�= 0. Note that specialties index j is no longer needed as specialties are
accounted for by their designated OR block(s).
Let HM be a discrete distribution for the total number of recovering patients on day m resulting from a
single MSS cycle. Since recovering patients do not interfere with each other we can simply iteratively add the distributions of all the blocks impacting day m to get HM. Adding two independent discrete
distributions is done by discrete convolutions which we indicate by *. Let A and B be two independent discrete distributions. Then C = A*B, is computed by:
P
(
h
nj=
x
) =
P
(
c
j=
x
)
when n
= 0
k
x
e o
k=x Cj
/
(
d
nj-1)
k-x(1 -
d
nj-1)
xP
(
h
nj-1=
k
)
otherwise
*
d
<