Richard S. Pinto' Wendy A. Cohen' Irvin I. Kricheff' Rowland W. Redington2 Walter H. Berninger2
This article appears in the September / Octo-ber 1982 issue of AJNR and the November 1982 issue of AJR.
Received October 21, 1981; accepted after revision March 12, 1982.
Presented at the annual meeting of the Ame ri-can Society of Neuroradiology, Chicago, April
1981.
This work was supported in part by E. R. Squibb & Sons, Inc., Medical Development Department, and by General Electric Corp.
I Department of Radiology, New York Unive
r-sity Medical Center, 560 First Ave., New York, NY 10016. Address reprint \equests to R. S. Pinto.
2 General Electric Research and Development Center, Schenectady, NY 12301.
AJNR 3:495-499, September/October 1982 0195-6108/82/0305-0495 $00.00 © American Roentgen Ray Society
Giant Intracranial
Aneurysms:
Rapid Sequential
Computed Tomography
495
Giant intracranial aneurysms often present as mass lesions rather than with sub-arachnoid hemorrhage. Routine computed tomographic (CT) scans with contrast ma-terial will generally detect them, but erroneous diagnosis of basal meningioma is possible. Rapid sequential scanning (dynamic CT) after bolus injection of 40 ml of Renografin-76 can conclusively demonstrate an intracranial aneurysm, differentiating it from other lesions by transit-time analysis of the passage of contrast medium. In five patients, the dynamics of contrast bolus transit in aneurysms were consistently differ-ent from the dynamics in pituitary tumors, craniopharyngiomas, and meningiomas, thereby allowing a specific diagnosis. Dynamic CT was also useful after treatment of the aneurysms by carotid artery ligation and may be used as an alternative to angio-graphic evaluation in determining luminal patency or thrombosis.
Giant intracranial aneurysms are defined as those aneurysms larger than 1.5 cm in diameter. Neurologic presentation often is consistent with multiple scler o-sis, dementia, degenerative disease, or an intracranial mass with focal neurologic symptoms. Before computed tomography (CT), angiography was required to demonstrate the lumen of the aneurysm, with the true size estimated only by vascular displacement [1]. With CT it is now possible to demonstrate the entire aneurysm. However, routine CT studies of giant aneurysms have demonstrated that nonthrombotic aneurysms may be confused with either a intra-or extraaxial mass [1].
Dynamic CT using a bolus intravenous injection of contrast medium followed by rapid sequence CT scanning has been used for transit studies of brain blood flow in patients with cerebral vascular disease [2]. The behavior and appearance of various lesions, including arteriovenous malformations, aneurysms, and benign and malignant tumors, using dynamic CT have been described [3, 4]. We report our experience with dynamic CT in giant intracranial aneurysms before and after carotid ligation.
Subjects and Methods
Five patients known to have giant aneurysms by prior studies were evaluated by dynamic CT. Two were nonthrombosed, two partially thrombosed, and one completely thrombosed.
Three studies were performed after treatment by carotid ligation. One patient with a meningioma is included for comparison. Dynamic CT results in meningioma, pituitary adenoma, and craniopharyngioma (reported elsewhere) are commented on [5, 6].
All scans were performed on a GE CT
I
T
8800 using graphic data analysis capabilities available in experimental software and imaging programs supplied by General Electric Corp. (GEDIS 6.16-6.21). Initial noncontrast CT through the aneurysmal mass was per-formed to determine the levels of interest for subsequent dynamic CT. Dynamic CT scans 10 mm thick were obtained at two levels using a 4.8 sec scan time with an interscan time of 1.5 sec. Eight scans per level were obtained.496
PINTO ET AL. AJNR:3, September/October 1982A
B
Fig. 1 .-Nonthrombosed giant ophthalmic artery aneurysm. A, Axial pro-jection. Enhancing lesion obliterates suprasellar cistern and compresses inferior orbital gyrus on right. Small high-density areas (arrows) represent aneurysmal wall calcification. B, Dynamic CT scan with graphic analysis of
antecubital vein via a short 18 gauge catheter. Initially, a bolus of 40 ml delivered over a 3-4 sec interval was used; however, because
of an extravasation of contrast medium into the soft tissues of the
upper arm in some patients, the injection time was increased to 5-6 sec. This did not significantly change the contrast density-time
curves. The total contrast load was 80 ml (29 g I). Renal function in all patients was within normal limits at the time of the study, and no changes were noted subsequently.
Graphic analyses of the change in the CT attenuation with time were performed for specific regions of interest (transit time anal y-sis). In all cases the aneurysm lumen, thrombus, and normal arterial structures were compared. Graphic analyses were accomplished by both point-to-point plotting and gamma variant fitting of the data.
All illustrations are point-to-point plots, since the recirculation peak
of contrast transit is best demonstrated in this way. In all cases aneurysm lumen transit analyses were compared to density-time
transit analyses of the largest normal arterial structure
demon-strated. After the contrast medium injections for dynamic CT, routine
axial scans were obtained.
Results
Regions identified as the lumen of the aneurysm showed an average change in CT number of 200 H (60-376 H) (figs. 1 and 2). One patient with a small, almost thrombosed, aneurysm lumen demonstrated a change in CT number of only 60 H. Large vessels such as the main trunk of the middle cerebral artery displayed an average maximum change in CT number of 115 H (60-125 H), having rapid washin and washout phases. The washin peak occurred
transit time of contrast medium. Peak value about three times that of right middle cerebral artery. 1 = aneurysm; 2 = middle cerebral artery. Shallow recirculation peak between 16 and 24 sec.
between 6 and 11 sec, and washout cleared by 23 sec (figs.
1 and 2). The drop in CT number was to near baseline
levels. The aneurysm lumens demonstrated washin and
washout phases with similar timing as large vessels (figs. 1
and 3), except in one completely thrombosed aneurysm. A
small recirculation peak was present in all aneurysms with
a patent lumen and in all density plots of intracranial vessels
(figs. 1, 3, and 4), but was absent in a hypervascular
tentorial meningioma (fig. 5) and in other suprasellar lesions
as reported elsewhere [5, 6].
Four patients had aneurysms with significant intraluminal
thrombus. In none was there a change in CT number within the clot (fig. 2C).
Four patients had enhancing aneurysm walls. One of the four showed significant change in CT number within the wall during dynamic CT (30 H), but this did not approach the magnitude of the change within the lumen. One supraclinoid carotid aneurysm had two separate areas of wall enhance-ment: one outside an outer ring of hypodensity and one between this ring and an inner ring of hyperdensity. Dynamic
CT was performed on this patient after placement of a Selverstone clamp on the common carotid artery, and the findings suggested a completely thrombosed aneurysm (fig. 4). Repeat angiography was not performed.
Discussion
Dynamic CT with its ability to demonstrate rapid change
[image:2.613.57.562.79.339.2]AJNR:3, September/October 1982 DYNAMIC CT OF INTRACRANIAL ANEURYSMS
497
A
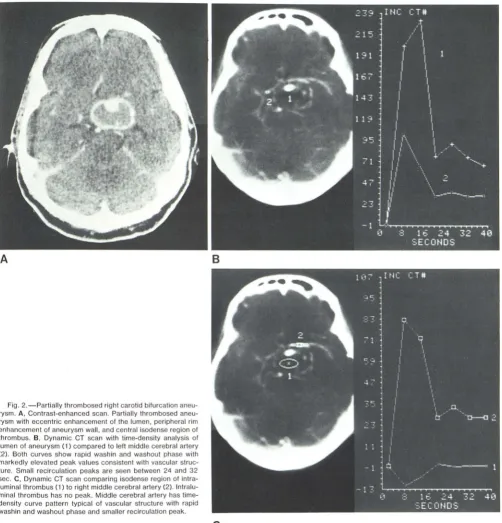
Fig. 2.- Partially thrombosed right carotid bifurcation an eu-rysm. A, Contrast-enhanced scan. Partially thrombosed aneu-rysm with eccentric enhancement of the lumen, peripheral rim enhancement of aneurysm wall, and central isodense region of thrombus. B, Dynamic CT scan with time-density analysis of lumen of aneurysm (1) compared to left middle cerebral artery (2). Both curves show rapid wash in and washout phase with markedly elevated peak values consistent with vascular stru c-ture. Small recirculation peaks are seen between 24 and 32 sec. C, Dynamic CT scan comparing isodense region of intra -luminal thrombus (1) to right middle cerebral artery (2). Intra lu-minal thrombus has no peak. Middle cerebral artery has time -density curve pattern typical of vascular structure with rapid wash in and washout phase and smaller recirculation peak.
B
c
useful in those cases where the diagnostic possibilities are
aneurysm, meningioma, craniopharyngioma, or hematoma.
Arterial transit is typified by a rapid washin and washout of
contrast medium characterized by a steep upslope and
downslope on transit-time analysis of the CT attenuation
values. A smaller peak of recirculation of contrast media occurs between 32 and 48 sec.
Difficulty may arise in evaluating thin-walled aneurysms
on routine infusion-contrast-enhanced CT scanning,
be-cause these present as slightly hyperdense lesions with
uniform enhancement similar to basal meningiomas. Often
in aneurysms tITat are partially thrombosed, both lumen and
wall display contrast enhancement, while the thrombus itself
is seen as an area of isodensity. In acute thrombosis of an
aneurysm, the clot is hyperdense, and a small residual
lumen may be difficult to identify using routine noncontrast
and contrast-enhanced CT.
[image:3.613.55.557.78.600.2]aneu-498 PINTO ET AL. AJNR:3, September/October 1982
A
B
Fig. 4.-Completely thrombosed left supraclinoid carotid aneurysm. A, Contrast-enhanced CT scan 3 weeks after common carotid clamping. Hyper-dense aneurysm with peripheral enhancement and area of hypodensity
rysm from meningioma and resolve the questions that arise between patent lumen, aneurysm wall, or intraluminal clot
[1 -3]. It also will allow treated and untreated partially throm -bosed aneurysms to be followed by repeated studies (fig. 3).
Since an aneurysm lumen is an extension of the parent intracranial arterial vessel, transit-time analysis of both lu
-Fig. 3.- Left ophthalmic artery aneurysm (status post carotid
ligation). Graphic analyses curves demonstrate rapid washin and washout phases (1), with higher peak value than corr e-sponding basilar artery (2). Small recirculation peak between 24 and 32 sec. These results indicate persistent patent aneu-rysm lumen.
posterolaterally. B, Dynamic CT. Hyperdense aneurysm (1) has flat tim e-density curve when compared to basilar artery (2), indicative of thrombosis.
men and vessel are similar, except that the aneurysm lumen
will display a greater amplitude (peak value) when it occ
u-pies a larger volume of the CT slice than the comparison
vessel (figs. 1 and 3). When the size of the aneurysm
approaches that of a comparable vessel, no difference should be expected in the time-density curves or peak
[image:4.612.54.565.85.611.2]AJNR:3, September/October 1982 DYNAMIC CT OF INTRACRANIAL ANEURYSMS 499
Fig. 5.- Tentoriat meningioma. Hypervascutar tentoriat men
-ingioma shows rapid washin and washout phases in early part
of the time-density curve (2). Recirculation peak absent on this
curve and present on curve plotted from pericallosal artery (1).
Absence of recirculation peak inconsistent with aneurysm.
Common carotid ligation is a prevalent conservative trea
t-ment for giant aneurysms, particularly if they arise from the
cavernous or supraclinoid segments of the internal carotid
artery. Acute intraluminal thrombosis may follow and the conventional CT study will demonstrate a hyperdense ce
n-trum, with enhancement being difficult to determine. If the
lumen is eccentric and small and if aneurysmal wall ca
lcifi-cation is present, difficulty will arise in determining luminal
patency or thrombosis. On dynamic CT, the hyperdense
intraluminal clot shows a markedly diminished peak value
and a flat transit-time curve indicative of the absence of flow of contrast medi,um within the thrombotic aneurysm (fig.
48).
In our opinion, angiography after carotid ligation may be
less successful than dynamic CT to conclusively eliminate
lumenal patency, since the parent vessel is occluded and
the aneurysm fills by collateral flow through the circle of
Willis [7]. Although corroborative angiography has not been
performed in our series, it is our experience that dynamic
CT time-density curves easily determine luminal patency or
thrombosis (figs, 3 and 4).
The recirculation peak of contrast transit in all intracranial
vessels and aneurysms with a patent lumen aids in the
differentiation from a hypervascular tumor (fig. 5). The a
b-sence of a recirculation peak in hypervascular tumors [5] is
believed to be due to masking of its presence by
superim-position of the tumor enhancement plateau during the time
period of our imaging. Whatever the mechanism, its absence
aids in differentiating a hypervascular lesion from an intra
-cranial aneurysm.
Of concern is the possibility of not scanning through a
patent lumen. If a single series of scans through one level
were performed, this could be a factor; however, it is
pos-sible to perform at least three series of dynamic CT scans on a single patient with normal renal function and by so
doing ensure that all parts of the aneurysm are imaged.
Dynamic CT measures a change in CT number so that
vascular regions continue to be defined as such with minimal damping effect, despite the presence of prior contrast
ma-terial.
In summary, we found dynamic CT capable of
differen-tiating a giant aneurysm from other parasellar masses. Intra
-cranial giant aneurysms demonstrate a pattern of contrast medium transit typical of vascular structures, but with
greater amplitude except when thrombosed. These higher
peak values of large lumen aneurysms are explained by
partial vo,ume effects. The status of an aneurysm lumen
may be followed by repeat dynamic CT after either carotid
ligation or antihypertensive therapy. A decrease in peak
value and flattening of the density-tir,le curves indicates
thrombosis, thereby probably obviating angiography.
REFERENCES
1. Pinto RS, Kricheff II, Butler A, Murali R. Correlation of CT,
angiographic and neuropathologic changes in giant cerebral
aneurysms. Radiology 1979; 132: 85-92
2. Axel L. Cerebral blood flow determination by rapid-sequence computed tomography. Radiology 1980; 137: 679-686 3. Wing SO, Anderson RE, Osborne AG. Dynamic cranial co
m-puted tomography. AJNR 1980; 1 : 1 35-1 39
4. Dobben GO, Valvassori GE, Mafee MF, Berninger WHo Evalu -ation of brain circulation by rapid rotational computed tomog -raphy. Radiology 1979; 133: 1 05-111
5. Cohen WA, Pinto RS, Kricheff II. Dynamic CT scanning for
visualization of the parasellar carotid arteries. AJNR
1982;3: 1 85-1 89
6. Braun IF, Pinto RS, Epstein F. Dense cystic craniopharyn -giomas. AJNR 1982;3: 1 39-1 41
7. Kricheff II, Chase NE, Lin JP, Ransohoff JE. Brachial angi
og-raphy for the evaluation of carotid artery occlusion in the
treatment of "posterior communicating" aneurysm. Radiology