1
The relations between learner characteristics
and guidance during inquiry learning.
Author: Leonie Brummer
S0197203 University of Twente
Faculty: Behavioural Sciences
Department: Instructional Technology
Examination committee: Dr. T.H.S. Eysink
Dr. P. Wilhelm
2 Index
Abstract p. 3
Introduction p. 3
Inquiry learning p. 3
Difficulties in inquiry learning p. 4
The role of guidance in inquiry learning p. 4
Purpose of the study p. 5
Characteristics present in children p. 5
Personality p. 5
Motivation p. 6
Learning styles p. 7
Self-esteem p. 8
Curiosity p. 8
Other learner characteristics p. 10
Method p. 10
Participants p. 10
Materials p. 10
Nederlandse Persoonlijkheidsvragenlijst-Junior p. 10
Prestatiemotivatietest voor Kinderen p. 11
The Learning Style Inventory p. 11
Competentie Belevingsschaal voor Kinderen p. 11
The Science Curiosity Scale p. 12
Other learner characteristics p. 12
The inquiry learning task p. 12
Procedure p. 13
Guidance during the orientation phase p. 14
Guidance while generating hypotheses p. 15
Guidance during experimentation p. 15
Guidance during the interpretation and conclusion phase p. 16
Analyses learning task and guidance p. 16
Results p. 18
Results questionnaires first session p. 18
Preparing the data file for further analysis p. 19
Preparation data for regression analyses p. 20
Correlations and regression analyses with guidance
and learner characteristics p. 20
Regression analyses p. 21
Discussion p. 24
Practical value p. 25
Limitations p. 26
Further research p. 26
References p. 27
Appendix 1 p. 30
3 Abstract
Inquiry learning can be an effective, but challenging instructional method for children. The present study was aimed at determining whether learner characteristics influence the amount of guidance necessary during inquiry learning. Children (N= 36) from an elementary school in the Netherlands
conducted an experiment to determine which characteristics of objects, like weight and size, influences the buoyancy of objects. Questionnaires investigating learner characteristics were administrated: the Nederlandse Persoonlijkheidsvragenlijst-Junior (NPV-J), Prestatiemotivatietest voor Kinderen (PMT-K 83), Learning Style Inventory (LSI), Competentie Belevingsschaal voor Kinderen
(CBSK), and the Science Curiosity Scale (SCS). Results did show some significant (but weak) correlations between learner characteristics and the amount of guidance during the inquiry learning
task. Additionally, the characteristics appeared weak predictors of the amount of guidance necessary. Debilitating anxiety appeared a predictor when other characteristics were present. Despite the significant correlations, learner characteristics barely had an influence on the amount of guidance during inquiry learning. It is suggested that research should focus on instructional methods,
rather than on individual differences.
Keywords: inquiry learning, learner characteristics, elementary school, guidance.
Introduction Inquiry learning
In primary education, more emphasis is placed on inquiry learning as a learning method (Van Deur, 2010). The National Science Education Standards (1996, p. 23, in: National Research Council, 2000) propose the following definition of inquiry (learning): ‘’Inquiry is a multifaceted activity that involves making observations; posing questions; examining books and other sources of information to see what is already known; planning investigations; reviewing what is already known in light of experimental evidence; using tools to gather, analyze, and interpret data; proposing answers, explanations, and predictions; and communicating the results. Inquiry requires identification of assumptions, use of critical and logical thinking, and consideration of alternative explanations.’’ Children learn best when they engage in the materials necessary to explore and investigate the phenomena and when they are driven by things they want to know (Kuhn & Pease, 2008; NRC, 2000). Materials in the natural world are studied as if the person is a scientist and he or she proposes explanations for evidence is derived from experiments (NRC, 2000).
Klahr (2000, in: Zimmerman, 2007) proposed an inquiry cycle which captures similar aspects of generating, testing and revising information. The inquiry cycle contains: (a) generating research questions after observing situations that are involved in the research topic, (b) designing
experiments, (c) analyzing the gathered data, and (d) drawing valid conclusions (Klahr, 2000, in: Zimmerman, 2007; NRC, 2000; Woolf et al., 2002).
For both models (basis from NRC and inquiry cycle from Klahr), the first component of inquiry learning is about posing questions that are suitable for empirical testing. These questions and
4 processes are needed, like classifying, analyzing, drawing inferences and making predictions (NRC, 2000; Klahr, 2000, in: Zimmerman, 2007). Finally, results should be communicated in a way that the experiment can be reproduced by other researchers. This requires a clear articulation of questions, what materials are required, what is done (procedure), what the results were (evidence), appropriate explanations based on the results and whether alternative explanations are possible (NRC, 2000).
Difficulties in inquiry learning
Recent studies have shown that inquiry learning is an effective way of learning (e.g., Alfeiri, Brooks, Aldrich, & Tenenbaum, 2010; Lee, 2011; Eysink et al., 2009). However, children often find it a challenging way of learning (Zimmerman, 2007), as each step in inquiry learning involves different pitfalls. Generating research questions is often recognized as a difficult step (Chinn & Brewer, 1993). According to Schauble, Glaser, Raghaven, and Reiner (1991), successful learners propose hypotheses, where unsuccessful learners do not. This is probably due to not knowing what an hypothesis looks like (De Jong & Van Joolingen, 1998).
Experimentation can be challenging and there are some situations in which a child does not design a valid experiment. Learners can be strongly influenced by confirmation bias. They design experiments which are comprehensive or are designed to test no hypotheses at all (De Jong & Van Joolingen, 1998). They can also engage in inefficient experimentation behavior, like designing the same experiment several times (Kuhn, Schauble, & Garcia-Mila, 1992). Evaluating explanations could result in eliminating explanations or revising them. It is essential that the connection between the results gathered and the scientific knowledge presented in books and journals is appropriate (NRC, 2000). Successful learners are better able to discover regularities in the data in comparison with unsuccessful learners (Schauble et al., 1991).
During the interpretation of data (data-reading), children often heavily rely on prior knowledge (Chinn & Malhotra, 2002a). Communicating research findings involves regulative processes, such as monitoring and planning. These skills are applied systematically by successful learners. Unsuccessful learners work in an unsystematic way (e.g., Lavoie & Good, 1988; Simmons & Lunetta, 1993). One factor that reflects a systematic way of working is making notes (Lavoie & Good, 1988). Making notes enables a learner to follow a plan about how experiments should be conducted in order to collect data. Therefore, a more systematic way of conducting experiments is achieved (e.g., Glaser, Schauble, Raghaven, & Zeitz, 1992, in: De Jong & Van Joolingen, 1998). Communicating results also describes the necessity of reflective skills. According to Wilkening and Sodian (2005), this is only possible if reflective skills (towards the knowledge gained) are fully developed, which is often not the case in young children.
The role of guidance in inquiry learning
5 Supportive guidance is influential for the learning process (Feldon, Timmerman, Stowe, & Showman, 2010). Therefore, it is essential to know which elements of the presented study materials can help and support learners to foster knowledge building and acquisition (Boekaerts et al., 2000, in: Van Deur, 2010).
Purpose of the study
Information about the differences among children is essential in order to provide the necessary guidance during a child’s exploration activities. With the awareness of different characteristics, the type and the amount of guidance can be tailored differently according to specific characteristics. Previous studies have shown that children of certain ages have difficulties with inquiry learning (e.g., Zimmerman, 2007). Alfieri, Brooks, Aldrich and Tenenbaum (2010) showed that children of different ages benefit from different instructional approaches. The aim of the current study is whether learner characteristics influence the need for guidance during inquiry learning. Which learner characteristics are taken into account are discussed next.
Characteristics present in children
In this study, we explore the differences among children. Personality is a characteristic that often comes to mind when differences among children are mentioned. Second, children can be better, or less, motivated to achieve a specific goal. The desire to achieve something, whether it is receiving a physical object (e.g., a present) or knowledge about a phenomenon, can direct behavior differently. Third, information about new or already known phenomena can be approached with different attitudes or styles. This style reflects preferences and the most suitable methods for that person in handling information. Thus, styles towards learning can provide information about preferences, strengths and weaknesses that can be helpful during learning. Therefore, in this study the following characteristics are selected: (a) personality, (b) motivation, (c) learning styles, (d) self-esteem, and (e) curiosity. Based on learning behaviors in children with particular characteristics, instructional
methods can be tailored regarding the amount of guidance they need. Dunlap et al. (1994, in: Heal & Hanley, 2007) showed that children’s preferences for instructional contexts (e.g., color versus black-white pictures) are essential because it could result in less off-task and disruptive behavior.
Personality.
Studies investigating the relationship between personality and learning are considered essential (Swanberg & Martinsen, 2010) because several personality characteristics lead to different
approaches in situations (Eley, Young, & Przybeck, 2009), like school or the workplace. For example, a characteristic indicating how persistent one is can determine how well one can focus on a task or how eager one is to finish a task with good results. On the other hand, other characteristics could illustrate how easily one is distracted from a task or how the involvement of other people would influence his/her behavior.
A well-known personality model is the Big Five model. Diseth (2003) conducted a study to investigate the relationship between Big Five domains (Openness to experience, Conscientiousness, Extraversion, Agreeableness, and Neuroticism) and academic achievement. In this study, academic achievement was determined according to open ended essay questions computed to a single grade (Diseth, 2003). Results of the study showed a positive correlation between the domains
6 learning, Glaser et al. (1991, in: De Jong & Van Joolingen, 1998) proposed the significance of
persistence in the regulation process of the inquiry learning cycle. The degree of persistence distinguishes successful from unsuccessful learners, in which successful learners appear to be more persistent.
In the present study, the Nederlandse Persoonlijkheidsvragenlijst Junior (NPV-J; Luteijn, van Dijk, & Barelds, 2005) was used as a measure of personality. The test distinguishes five domains: (a) Inadequacy, (b) Persistence, (c) Social inadequacy, (d) Recalcitrance, and (e) Dominance. Inadequacy is a domain that corresponds with a global view of oneself and what one can achieve. Children who score high on Inadequacy are concerned, sensitive, tensed, and susceptible. They do not have an independent working attitude and are less able to focus on their work (Luteijn, van Dijk, & Barelds, 2003). Persistence is shown as a domain corresponding with a view of being able to work hard. Children with high scores are often characterized as conscientious, calm, cooperative, and competitive. Socialinadequacy illustrates how a child interacts with others. Children with a high score are often restrained in having contact with others, are shy and reserved, and have a tendency to isolate themselves. Recalcitrance is characterized by the degree in which children are critical towards others. A high score corresponds with laziness, egoism and hostility. They tend to be
dissatisfied with school and they do not like to go to school. Dominance corresponds with the degree of controlling the surroundings and other people. High scoring children are not shy, confident, and less controllable (Luteijn, van Dijk, & Barelds, 2003). With regard to the present study, it is expected that no or a negative correlation will be found between Inadequacy scores and the amount of guidance during the inquiry learning task (Hypothesis 1.1). High scores on inadequacy indicate a dependent attitude towards a task, which will require more guidance. It is also expected that children who score high on persistence require less guidance during the inquiry learning task (Hypothesis 1.2). These children work hard to achieve a goal and are willing to achieve that without help from other people. No correlation or a negative correlation is expected with the domains Social Adequacy, Recalcitrance and Dominance (respectively hypothesis 1.3, 1.4, and 1.5). These three domains are involved in interactions with other children and not specifically with approaching a task or a related assignment.
Motivation.
7 (d) the Social Desirability (SW) scale, which is referred to as a tendency to search for social
appreciation (Hermans, 1983).
As Swinger et al. (2009) proposed motivation regulation as a meaningful mediator of performance, it is expected that a higher achievement motive (P scale) and a higher facilitating anxiety (F-plus scale) are positively correlated with the guidance during inquiry learning (Hypothesis 2.1 and 2.2) because both motives are involved in performing well on a given task. In other words: a higher achievement motive and a higher facilitating anxiety require less guidance. Debilitating anxiety (F-min scale) and social desirability (SW scale) are expected to show no or a negative correlation with guidance during an inquiry task (Hypothesis 2.3 and 2.4). Debilitating anxiety restrains the child from achieving, performance on a certain task then does not correspond with the abilities of a child. As a result, more guidance is required to utilize the potential abilities of the child. Social desirability involves acting according to expectations of other people, which indicates a more dependent and help-seeking attitude. Thus, more guidance is required.
Learning styles.
The learning styles (as described by Kolb, 1984) emphasize elements that are also visible in the inquiry cycle. Kolb’s learning styles (1984) can be compared with the inquiry cycle from Klahr (2000, in: Zimmerman, 2007). The learning styles and the inquiry cycle contain a basis of observation, reflections, experiences, concepts, and judgments. With regard to this basis, four learning styles are distinguished (Kolb, 1984), namely: (a) a Convergent learning style, (b) a Divergent learning style, (c) an Assimilating learning style, and (d) an Accommodating learning style. All learning styles are based on observing, reflecting, experiencing, forming concepts, and judging. The styles help learners to handle problems. Each learning style has an approach for handling problems and is measured with the Learning Style Inventory (LSI; Kolb, 1984). The Convergent style focuses on
hypothetical-deductive reasoning (Kolb, 1984) and people with this style think only one answer is correct to each problem (Torrealba, 1972; Kolb, 1976, in: Kolb, 1984). They find solutions to problems in a practical way and they may feel uncomfortable when feelings and social interactions are related to problems (Kolb & Kolb, 2009). Someone with a Divergentlearningstyle prefers using brainstorming in solving a problem (Kolb, 1984). These learners prefer concrete situations and like to gather new information. Also included are a wide range of feelings and different interests (Kolb & Kolb, 2009). A person with an Assimilatingstyle considers theories that appear logic and precise more essential than its practical values (Kolb, 1984). They focus on abstract ideas and not specifically on interactions with people involved in those concepts. A tendency to work alone is often associated with this learning style (Kolb & Kolb, 2009). Finally, the Accommodativeorientation uses trial-and-error in solving a problem (Grochow, 1973, in: Kolb, 1984). These learners can handle uncertain and ambiguous situations with efficiency and rely on intuition in their analyses (Kolb & Kolb, 2009). Based on these approaches to problems, it is expected that children with an Converging learning style and the Assimilating learning style require less guidance on an inquiry learning task (Hypothesis 3.1 and 3.2). Learners with a Converging learning style approach situations in a practical way and experimentation requires practicality. Learners with an Assimilating learning style prefer to work alone and this attitude is accompanied with a tendency to avoid guidance in any form. For the remaining learning styles (Divergent style and Accommodative style), it is expected that they have no influence on the amount of guidance necessary during an inquiry learning task (Hypothesis 3.3 and 3.4). Both styles emphasize a broader view on the task and have a overview of the obtained information. Therefore, this
8 Self-esteem.
Studies that investigate the relation between self-esteem and academic performance seem to indicate that self-esteem improves academic achievement (e.g., Covington, 1984; Hersey & Blanchard, 1993; Liu, Kaplan, & Risser, 1992; State of California, 1986, in: Ross & Broh, 2000). According to Battle (1981), adolescents who have a high self-esteem perform better in school in comparison with adolescents with a low esteem. However, results on the influence of self-esteem appear controversial and other researchers propose that self-self-esteem is misplaced in education. Self-esteem seems to replace understanding as a goal in education (e.g., Edwards, 1995; Hewitt, 1998; Kramer, 1991, in: Ross & Broh, 2000). Two components of the self-image are involved: (a) self-esteem and (b) sense of control. The former is the perception of self-worth and the latter refers to being an effective person. In daily activities the two of them operate together.
Nevertheless, conceptually the two terms are distinct (Ross & Broh, 2000). Academic
achievement itself is not fostered by high self-esteem. Again self-esteem influences effort and effort enhances academic achievement (Hewitt, 1998, as written by Ross & Broh, 2000). Ross and Broh (2000) conclude that sense of control influences academic achievement and not self-esteem. Phan (2010) suggested that individuals with higher self-esteem have greater chances to be successful in learning. If someone has a feeling of perceived competence (part of self-esteem), they are more likely to be involved in challenging goals and they spend more time and effort to realize those goals (e.g., Greene & Miller, 1996; Miller et al., 1996, in: Phan, 2010). A Dutch test which measures perceived competence in children is the Competentie Belevingsschaal voor Kinderen (CBSK;
Veerman, Straathof, Treffers, Van den Bergh, & Ten Brink, 1997). Two concepts are involved, namely perception of control and perceived competence and the CBSK has these concepts as basic
assumptions (Veerman, Straathof, Treffers, Van den Bergh, & Ten Brink, 1997). Veerman et al. (1997) proposed a schema to organize the different concepts involved in perceived competence. The perception of oneself consists of a process, namely ‘information processing’, and a product called ‘self-concept’. The self-concept can be further separated into a descriptive part, called self-image and an evaluative part, called self-esteem. Although the two parts of the self-concept are distinct, the two influence each other. Someone’s self-esteem consists of the perceived competence, which is specific. A feeling of self-respect is a more general feeling. Again the influence of those two concepts is bidirectional (Veerman et al., 1997). If self-esteem influences effort and this influences
performance, it is expected that children with a higher self-esteem, regardless of the domain of that self-esteem, require less guidance from the researcher during an inquiry learning task (Hypothesis 4). This accounts for all subscales in the CBSK, namely: (a) Scholastic competence, which pertains to how a child perceives him- or herself at school; (b) Social acceptance, which pertains to whether the child thinks he/she has enough friends and how easily he/ she can make friends; (c) Athletic competence, which refers to the degree to which the child thinks he or she is capable in sports, gymnastics and playing outside; (d) Physical appearance, refers to how a child thinks about his or her physical appearance; (e) Behavioral conduct, which pertains to behaving appropriately and according to expectations; and (f) Global self-worth, which refers to a general opinion of oneself. The subtest correspond with respectively Hypotheses 4.1; 4.2; 4.3; 4.4; and 4.5.
Curiosity.
9 2004). This leads a person towards specific situations or actions with a tendency to experience rewards (Loewenstein, 1994). According to personality theorists, curiosity is a personality trait in which individuals differ in expressing and experiencing the things they want to know (Litman & Jimerson, 2004). Curiosity can also refer to two contrasting feelings regarding the acquisition of knowledge, namely: (a) a feeling of pleasure when someone has access to certain information or (b) a feeling of deprivation, in which someone does not have access to certain information (Litman & Jimerson, 2004). Maw and Maw (1970) have captured these elements into a concept of curiosity, in which individuals (a) have a positive attitude towards novel, strange or ambiguous elements in their environment which attracts individuals to those elements and appeals to explore or manipulate the elements; (b) hold a need or desire to gain knowledge about oneself and/or the environment; (c) search for new experiences; and/ or (d) continue their desire to examine or explore stimuli to gain more knowledge. With the elements of the inquiry cycle given by Kuhn & Pease (2008) and the NRC (2000), it is clear that curiosity is essential for inquiry learning (Maw and Maw, 1970) in the active attitude of individuals (Zimmerman, 2007) and the engagement in materials driven by questions they seek answers to (Kuhn & Pease, 2008). Curiosity is, in the present study, measured with the Science Curiosity Scale which was originally designed to measure curiosity in a scientific context with elementary school children (Harty & Beall, 1984). Children who are curious are often attracted by new stimuli or knowledge that they want to explore. Therefore, it is expected that children who score high on science curiosity (questionnaire) require less guidance during an inquiry learning task (Hypothesis 5).
10 Figure 1. An overview of hypotheses examined during the study concerning learning styles,
personality domains, motivation scales, self-esteem, and curiosity and inquiry learning.
Other learner characteristics.
The present study is an exploratory study in which the influence of learner characteristics on the need for guidance in inquiry learning is investigated. In addition to the learning characteristics and measures already described several other variables were included. Considering the steps of the inquiry cycle (as proposed by Klahr, 2000, in: Zimmerman, 2007), the researcher associated certain concepts with inquiry learning.For example, the preference to solve puzzles. Puzzles can be seen as a specific type of problem (Robertson, 2001). To solve this specific type of problem, one must apply different skills (e.g., planning and acting while keeping the goal in mind). If a child likes to solve puzzles, he/she likes to apply certain skills (e.g., planning) which can result in requiring less guidance. The questionnaire also included questions whether a child likes to go to school, and what the
hobbies are of the child. The former could illustrate a thirst of knowledge and the latter could indicate if the kind of activities and skills of a child is influential in the need for guidance. Questions were formulated about these concepts. Other questions included a measure of the personality trait honesty (Ashton & Lee, 2009). In the study of Vries, De Vries, and Born (2010), Honesty-Humility appears to be a strong predictor in academic criteria (measured by Grade Point Average and
Counterproductive Academic Behavior). It is suggested that academic criteria can be predicted more accurately by the specific traits of Honesty-Humility and Conscientiousness (De Vries, De Vries, & Born, 2010). Finally, questions regarding family composition were included (e.g., like how many brothers or sisters a child has). No hypotheses were stated with regard to these characteristics.
Method Participants
The participants were fifth-graders from a Dutch elementary school. All pupils (N= 40) in the 5th grade received an informed consent. In total, 36 children returned the informed consent with permission from their parents and these children were tested in order to collect the data. From the sample of 36 children, 22 (61 %) were girls and 14 (39 %) were boys. The mean age was 10.28 years (SD= .51), ranging from 9 to 11 years. All children received a small gift after each test session as a reward for their participation.
Materials
The questionnaires used in this study were: (a) Nederlandse Persoonlijkheidsvragenlijst-Junior (NPV-J), (b) Prestatiemotivatietest voor Kinderen (PMT-K 83), (c) a Dutch and simplified version of the Learning Style Inventory (LSI), (d) Competentie Belevingsschaal voor Kinderen (CBSK), and (e) a translated version of the Science Curiosity Scale (SCS). An inquiry learning task was designed to study the investigating behavior of the children. The inquiry learning task addressed the buoyancy of objects. An additional (and second) curiosity measure was introduced, in which children had to answer whether they wanted to know the content of a ‘mystery-box’.
Nederlandse Persoonlijkheidsvragenlijst-Junior.
three-11 point Likert scale and scores on each item were either 0 (‘No’), 1 (‘?’) or 2 (‘Yes’). To complete all items, 25 minutes were required. This corresponds with scores ranging from 0 to 56 for Inadequacy, scores from 0 to 50 for Persistence, from 0 to 16 for Social inadequacy, from 0 to 48 for
Recalcitrance, and for Dominance the scores ranged from 0 to 30.
Prestatiemotivatietest voor Kinderen.
The Prestatiemotivatietest voor Kinderen (PMT-K 83) determines which motive a child has while learning. The test is divided into four motives: (a) Achievement motive (P scale), (b) Debilitating anxiety (F-min scale), (c) Facilitating anxiety (F-plus scale), and (d) Social desirability (SW scale). The test had 89 items in total, which could be completed in 30 minutes. An item had to be answered by choosing one of the three following options: (a) it is alwayscomfortable, (b) it is sometimes
comfortable, and (c) it is nevercomfortable. For each motive a total score was computed.
The Learning Style Inventory.
In order to make the LSI (originally meant for adults) suitable for Dutch primary school children, the existing Dutch test had to be translated and simplified. In order to adapt the Dutch test for adults to a version appropriate for children, a group of five sixth graders were asked whether the Dutch adult test contained difficult words. They read all items and marked which words considered difficult. For these words, synonyms were searched. To discover whether the simpler words were clear, two children in the same age group were asked again if they understood all questions in the test. This was achieved by asking them directly if they understood words. A pilot study was conducted to test if the Dutch version II of Kolb’s Learning Style Inventory measured the same learning styles as the version for children, which was created from this version. The pilot study included five adult participants, who filled out the adult version of the Dutch LSI and the created version for children. The scores for each style were calculated and correlations had been calculated next to investigate whether the child version was suitable. For three out of four learning styles, the correlation was above .70, which was acceptable to continue. One learning style had a lower correlation (.50); however, this could be due to test effects because two almost identical questionnaires were completed (Kaplan & Saccuzzo, 2008). The only difference was the degree of difficulty in words. Considering these effects and the correlations, the created questionnaire was considered appropriate for children.
The Dutch child version used in this study contained 12 items. The child had to indicate whether a sentence was true for him or her while using four answer categories: (a) nottrueatall, (b) sometimestrue, (c) oftentrue, or (d) alwaystrue. For each style, a score was computed based on the answers given and a higher score represents a higher preference for a certain learning style. Based on the answers learners can be placed in one of the four learning styles: (a) Convergent learning style (‘doing’), (b) Divergent learning style (‘thinking’), (c) Assimilating (‘watching’), and (d)
Accommodative learning style (‘feeling’). It took 15 minutes to complete all statements.
Competentie Belevingsschaal voor Kinderen.
12 self-esteem: (a) Scholastic competence, (b) Social acceptance, (c) Athletic competence, (d) Physical appearance, (e) Behavioral conduct, and (f) Global self-worth. Each domain consisted of a score ranging from 6 to 24. A more competent answer on an item corresponds with a higher score. Thus, answers stated with more confidence received a higher score.
The Science Curiosity Scale.
The Science Curiosity Scale (SCS) designed by Harty and Beall (1984) measures generic curiosity factors in seventh graders, presented in a science learning context. To complete the questionnaire, 30 items were presented which had to be rated on a 5-point Likert-scale, ranging from strongly agree (score 5), agree (score 4), uncertain (score 3), disagree (score 2), and stronglydisagree (score 1). Completing the questionnaire produced a score ranging from low curiosity (score 30) to high curiosity (score 150). In general, a higher score on the SCS corresponds with a higher degree of curiosity. Ten to fifteen minutes were necessary to complete all questions.
The SCS was translated in Dutch, without simplifying items, because it was initially designed for children. Therefore, the language was assumed to be appropriate for children. A pilot study was conducted to discover whether both tests, the translated Dutch version and the original English test, measured the same concept, namely science curiosity. The pilot study included five (adult)
participants who completed both the English and Dutch version of the SCS. The correlation between scores on the English SCS and the Dutch SCS was .67. This was considered acceptable with respect to test influences (see Kaplan & Saccuzzo, 2008) and the age of the participants.
Other learner characteristics.
The questionnaire (created by the researcher) contained 23 questions, which could be divided into three parts: (a) personal ideas from the researcher, (b) questions from the domain Honesty- Humility (Ashton & Lee, 2009), and (c) questions related to family composition. The questionnaire is
considered as exploratory, in which ideas are mentioned to be linked to inquiry learning. The first part consisted of questions that could be relevant for inquiry learning (e.g., the preference to solve puzzles and hobbies), as well as an additional curiosity measure (the ‘mystery’-box). Questions from the second part of this questionnaire are also considered relevant for inquiry learning, but these questions were based on literature. The questions measure the personality trait honesty. The questions from the domain Honesty- Humility were translated from the HEXACO-60 (Ashton & Lee, 2009) and correspond with questions 10 to 19 from the questionnaire. Due to the questionnaire’s exploratory purpose, no pilot study was conducted. The third part of this questionnaire consisted of questions regarding family composition, like the number of siblings.It contained open and closed questions and took about 10 to 15 minutes to complete. See Appendix 1 for the complete
questionnaire.
The inquiry learning task.
13 1,0 x 1,0 x 1,0 cm); and four balls varying in diameter (1,2; 1,7; 1,9 and 3,3 cm). These objects were made of either a kind of metal, wood or glass. In total, 20 objects could be used by the children during the experiment and each object was marked with a specific color and pattern. The rationale behind this was to indicate the difference in objects and it served as a cue for the researcher to know what material the child was testing. A child could easily name the color of the cue, whereas a
description of the object was more difficult.
Other materials necessary to conduct the experiment were: (a) weighing scale, (b) water tank filled with water, (c) pen and paper, (d) a ruler, (f) worksheet, (e) recording equipment, (g) towels, and (h) the ‘mystery’-box.
The worksheet contained a table with eight columns; the number of rows could be expanded by the child. The first four columns indicated the object tested and was defined by color, shape, size and weight. The fifth column was called ‘I think…’ and was used to indicate whether the child thought an object would sink or float (‘’I think’’, see Appendix 2). In the sixth column, the child could indicate the result of an experiment (‘’I see’’, see Appendix 2). The seventh column was used to state any conclusions and in the final column an explanation could be given for each hypothesis while combining the ‘’I think’’ and ‘’I see’’ columns. Each column had to be filled out. See Appendix 2 for the worksheet.
Before the task, a smaller questionnaire was completed with three questions. The
questionnaire contained questions (a) whether the child wanted to know what the contents were of a red box, which was standing on the table during the task, (b) the reason why a child wanted to know (or not), and (c) how the child was feeling at that moment, which had to be answered on a 5-point Likert-scale with smileys. The first two questions of this questionnaire were considered as an additive, non-official measure of curiosity. The third question was to explore whether feelings of the child would influence the need for guidance.
Procedure
The study consisted of two test sessions. The first session took three hours and the second 45 minutes. In the first session children filled out the learner characteristics questionnaires. The questionnaires were completed in the following sequence: (a) the LSI, (b) the NPV-J, (c) the PMT-K 83, (d) the CBSK, (e) the SCS, and (f) the exploratory questionnaire. The tests were completed in a classical setting. The children started with the next questionnaire when all children had completed the previous questionnaire.
The inquiry learning task was conducted in the second test session, which took place six or seven weeks after the first session. It was completed by each child individually with the researcher. The purpose was to determine the amount of guidance necessary for the child to successfully complete the task. This session was audio recorded; the child had to think-aloud. At the beginning of the experiment, the smaller questionnaire of three questions had to be completed. After the
14 If the child finished within ten minutes by stating explicitly he or she was ready, the second part was directly introduced. If the child did not finish within ten minutes, the researcher (carefully) interrupted the child to introduce the second part of the study. This part could be roughly divided into four phases: (a) orientation, (b) generating hypotheses, (c) experimentation, and (d)
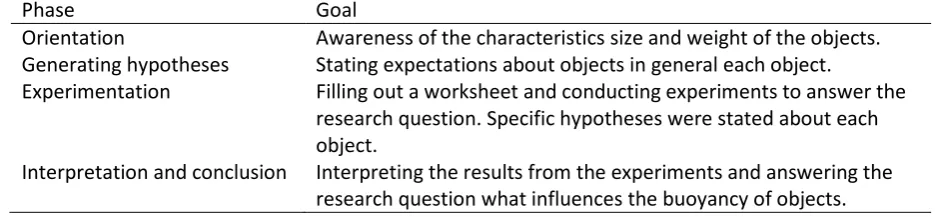
interpretation and conclusion. The children had to work through each phase. However, in this part of the study, they had to achieve specific goals in order to continue to the next phase (see Table 1): (a) during the orientation phase, the children had to become aware that the presented objects differed or matched in size and weight; (b) while hypothesizing, children had to form at least one general hypothesis that could be tested during experimentation; (c) during the experiment children had to pose specific hypotheses, based on their general hypothesis and on the number of available objects, that could be tested; and (d) while stating conclusions for each hypothesis, a general conclusion had to follow while mentioning the concepts size and weight.
A child could continue the investigation if the goals for each phase were achieved. If a child did not achieve those goals on their own, guidance was provided to guide the child to those goals. Guidance was provided when a child did not know what to do or conducted non-relevant steps with regard to the assignment (e.g., conducting experiments twice or stating irrelevant hypotheses with no contribution to the assignment). The necessity was determined according to one of the following criteria: (a) explicitly stating that one does not know what to do; (b) gestures indicating that one does not know what to do next, like shrugging or frowning; and/or (c) a silence of 30 seconds.
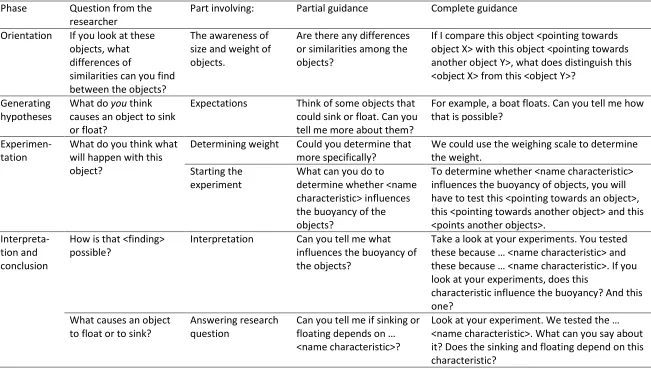
[image:14.595.60.528.444.556.2]Table 2 displays the questions asked by the researcher, which part it is involved with, and partial and complete guidance.
Table 1
Goals of each phase during the first part of the second session
Phase Goal
Orientation Awareness of the characteristics size and weight of the objects. Generating hypotheses Stating expectations about objects in general each object.
Experimentation Filling out a worksheet and conducting experiments to answer the research question. Specific hypotheses were stated about each object.
Interpretation and conclusion Interpreting the results from the experiments and answering the research question what influences the buoyancy of objects.
Guidance during the orientation phase
15 Guidance while generating hypotheses
Generating hypotheses, either general or specific, were goals of the second phase. In order to capture the general hypotheses of the child, the following question was asked: ‘’What do you think causes an object to sink or float?’’ This question led to a general hypothesis. Examples of general hypotheses were: ‘’Wood floats’’ or ‘’Heavy things sink’’. If a child proposed a specific hypothesis about one single object, the researcher referred to the objects in the bucket and the child was asked the same question again. This was not considered as guidance. Partial guidance was provided if a child did not know an answer to this question (by saying this explicitly or gesturing that they did not know what to do) or after a silence of 30 seconds. After providing partial guidance, complete guidance was provided while applying the same rules with partial guidance.
Guidance during experimentation
To conduct experiments, a worksheet had to be used with a table that was not finished. The child filled the table with results of his or her experiments. This forced the children to write down what they thought, what they saw as a result of the experiments, what they concluded and what explanations they provided for the results. To indicate the importance of this information, the researcher explicitly told the child it was essential for the study to write things down.
For selecting the objects for the experiments, the child was asked which objects should be tested in order to investigate which characteristics influences whether an object sinks or floats. The researcher referred to the general hypothesis which was given by the child earlier. This question was asked for each of the characteristics mentioned in the orientation phase. Thus, this question had to be asked at least twice because the child had to mention size and weight because both
characteristics are relevant to the buoyancy of objects. However, the question was asked with a maximum of four times because four characteristics (size, weight, shape, and material) were relevant in the present study. The colors of the objects or markings on the objects were not taken into
consideration. If a child mentioned it, it was said to have no influence on the buoyancy and that the child had to focus on other aspects.
The worksheet provided no other choice than thinking about what happened to a single object. The worksheet was given to the child after the orientation phase. To follow the child’s steps during the experiment, when the child was filling out the ‘’I think’’-column, he or she was asked: ‘’What do you think what will happen with this object?’’. This did not count as guidance because it served as a starting point for the child to think about what could happen to the objects.
If a child asked whether something had to be filled out or marked with a cross, guidance was not provided. The researcher responded with ‘’Yes, that is correct’’.
On the worksheet the column with ‘Weight’ could require guidance. Children could spontaneously mention the weighing scale for the exact weight of an object. If they did not know how to determine the weight, guidance was provided.
16 Guidance during the interpretation and conclusion phase
The question central to this phase was whether children were able to interpret the results, and draw valid conclusions. Guidance was provided when the child did not spontaneously interpret the data.
In the end, the child had to know what influences objects to sink or float. If a child did not spontaneously tell what characteristics were influential, the question whether a characteristic influences whether an object sinks or floats was asked for each characteristic (weight, size, shape, and material). This counted as partial guidance while taking into consideration the time necessary (30 seconds) and whether a child knows what to do. Complete guidance was provided after partial guidance. If a child explicitly stated that he/she did not know what to do or gesturing this, and/or after 30 seconds
Analyses learning task and guidance
Scoring of the inquiry learning task was based on the audio files and notes from the researcher, and informs how much guidance was provided during the investigation.
For each phase, a score was attached to ‘no guidance necessary’, ‘partial guidance’ and ‘complete guidance’. ‘No guidance necessary’ for a specific element indicated a score of 2, whereas partial guidance was indicated with a score of 1. When complete guidance was necessary, a score of 0 was provided. The partial guidance was provided first and, if necessary, complete guidance could follow. Regardless of the partial guidance, a score of 0 was provided to an element when complete guidance was necessary. For each characteristic (size, shape, material, and weight) a guidance score could be computed based on none, partial or complete guidance. Therefore, scores for the
orientation, experimentation and conclusion/interpretation phase could range from 0 to 8. The minimum score for the hypothesis phase and the determination of the weight was 0 and the maximum score was 2.
17 Table 2
Overview of phases and the provided partial and complete guidance Phase Question from the
researcher
Part involving: Partial guidance Complete guidance Orientation If you look at these
objects, what differences of
similarities can you find between the objects?
The awareness of size and weight of objects.
Are there any differences or similarities among the objects?
If I compare this object <pointing towards object X> with this object <pointing towards another object Y>, what does distinguish this <object X> from this <object Y>?
Generating hypotheses
What do you think causes an object to sink or float?
Expectations Think of some objects that could sink or float. Can you tell me more about them?
For example, a boat floats. Can you tell me how that is possible?
Experimen-tation
What do you think what will happen with this object?
Determining weight Could you determine that more specifically?
We could use the weighing scale to determine the weight.
Starting the experiment
What can you do to determine whether <name characteristic> influences the buoyancy of the objects?
To determine whether <name characteristic> influences the buoyancy of objects, you will have to test this <pointing towards an object>, this <pointing towards another object> and this <points another objects>.
Interpreta-tion and conclusion
How is that <finding> possible?
Interpretation Can you tell me what influences the buoyancy of the objects?
Take a look at your experiments. You tested these because … <name characteristic> and these because … <name characteristic>. If you look at your experiments, does this
characteristic influence the buoyancy? And this one?
What causes an object to float or to sink?
Answering research question
Can you tell me if sinking or floating depends on … <name characteristic>?
18 Results
Results obtained from questionnaires during the first session
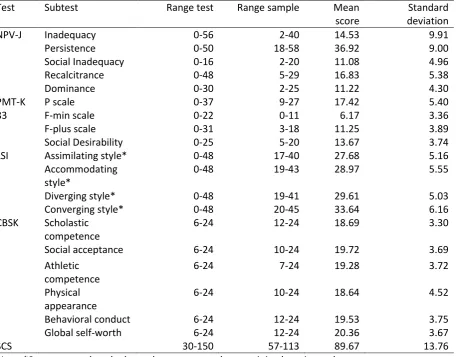
[image:18.595.75.532.179.536.2]Table 3 summarizes the mean scores and standard deviations of respectively the NPV-J, the PMT-K 83, the LSI, the PMT-K, and the SCS during the first test session.
Table 3
Mean scores and standard deviations (N = 36) during the first test session on the five questionnaires
Test Subtest Range test Range sample Mean
score
Standard deviation
NPV-J Inadequacy 0-56 2-40 14.53 9.91
Persistence 0-50 18-58 36.92 9.00
Social Inadequacy 0-16 2-20 11.08 4.96
Recalcitrance 0-48 5-29 16.83 5.38
Dominance 0-30 2-25 11.22 4.30
PMT-K P scale 0-37 9-27 17.42 5.40
83 F-min scale 0-22 0-11 6.17 3.36
F-plus scale 0-31 3-18 11.25 3.89
Social Desirability 0-25 5-20 13.67 3.74
LSI Assimilating style* 0-48 17-40 27.68 5.16
Accommodating style*
0-48 19-43 28.97 5.55
Diverging style* 0-48 19-41 29.61 5.03
Converging style* 0-48 20-45 33.64 6.16
CBSK Scholastic competence
6-24 12-24 18.69 3.30
Social acceptance 6-24 10-24 19.72 3.69
Athletic competence
6-24 7-24 19.28 3.72
Physical appearance
6-24 10-24 18.64 4.52
Behavioral conduct 6-24 12-24 19.53 3.75
Global self-worth 6-24 12-24 20.36 3.67
SCS 30-150 57-113 89.67 13.76
Note. *Scores on each style depend on scores on the remaining learning styles.
Table 4 summarizes the average scores of guidance provided by the researcher during the learning session with the inquiry learning task.
Table 4
Mean guidance scores and standard deviations of the inquiry phases (N = 36)
Phase Mean score Standard deviation
Orientinga 5.47 1.30
Hypothesizingb 1.94 .23
Determining weightb 1.00 1.00
Experimentinga 4.61 1.81
Concluding/ Interpretinga 5.81 1.37
Totalc 18.80 3.52
19 Preparation of the data for further analyses
Pearson correlations were used to see whether significant correlations existed between subscales. Before further analysis of the data, each subscale was investigated whether outliers appeared among the sample. After displaying the scores (of all participants) on a subscale in a box plot, scores outside the range of the sample (see Table 3) were visible. These scores were eliminated and Pearson correlations were used to investigate whether significant correlations existed between scores on subscales after eliminating the outliers. Differences in the strength and significance of the
correlations were compared using all scores of the participants and using the remaining scores after eliminating outliers to investigate whether (significant) correlations changed. The correlations with all scores could indicate that illusory correlations exist, whereas the correlations with the elimination of outliers would show the influence of those outliers on the correlations. Therefore, it was decided to further analyze the subscales with the eliminated outliers. Displaying a box plot for the guidance-score during the generation of hypotheses, it became clear that it showed no variance in guidance-scores and, therefore, this score was eliminated for further analysis.
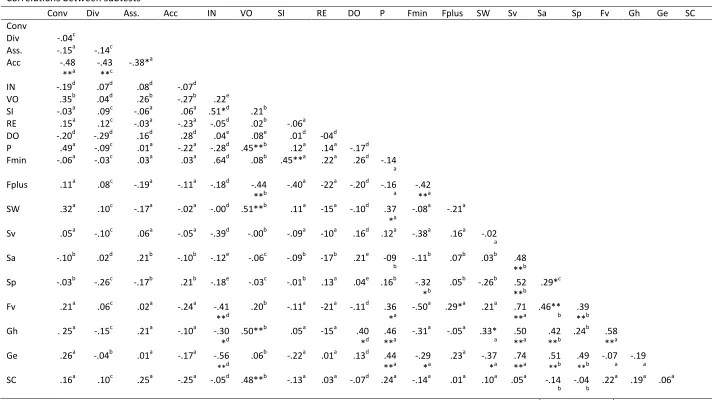
To reduce the number of subscales in the study, significant correlations above .50 were considered acceptable to reduce two subscales to one subscale (see Table 6). All significant correlations between two subscales were carefully interpreted to discover an underlying concept, which would explain why the two subscales are correlated. Interpreting these correlations reduced the number of subscales from 20 to 17 subscales.The following subscales were eliminated for further analyses: (a) CBSK Physical appearance, (b) CBSK Behavioral conduct, and (c) Global self-worth. With regard to self-esteem, the subscales Scholastic competence and Social acceptance could replace the other three subscales (Physical appearance, Behavioral conduct, and Global self-worth). With
Scholastic competence the correlations were respectively r = .71 (p < .01), r = .50 (p < .01), and r = .74 (p < .01). For Social acceptance these correlations were respectively r = .46 (p < .01), r = .42 (p < .01), and r =.51 (p < .01). Subscales from the CBSK are all involved in self-esteem, but self-esteem refers to different situations (e.g., how children feel about their looks and sports). The reason why Scholastic competence could eliminate other CBSK subscales could be due to the occurrence of self-esteem (in their physical appearance, in sports and how children feel in general) because those situations also occur at school. Maybe children associate concepts like physical appearance and sports performance with how confident they are at school. The same reason is applicable to Social acceptance, which could replace (to a lesser degree) Athletic competence, Physical appearance, Behavioral conduct, and Global self-worth.
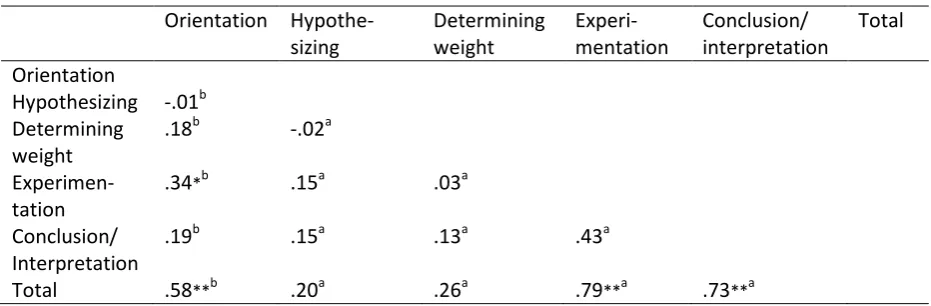
20 Table 5
Correlations between guidance scores during phases of the inquiry cycle and the total score Orientation
Hypothe-sizing
Determining weight
Experi-mentation
Conclusion/ interpretation
Total Orientation
Hypothesizing -.01b Determining
weight
.18b -.02a
Experimen-tation
.34*b .15a .03a
Conclusion/ Interpretation
.19b .15a .13a .43a
Total .58**b .20a .26a .79**a .73**a
Note. **Correlation significant at the .01 level (one-tailed). *Correlation significant at the .05 level (one-tailed). aN = 36. bn = 35
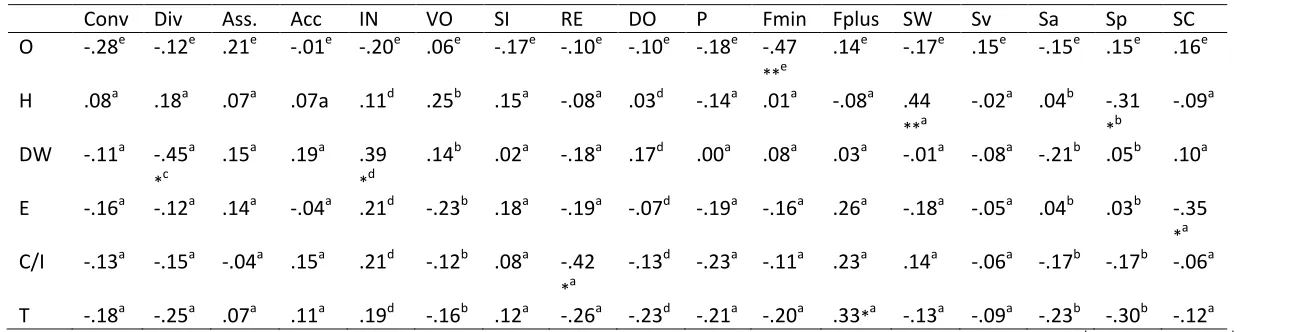
Table 7 summarizes correlations between subtests and guidance scores (during the phases of the inquiry cycle and the total guidance score).
Preparation data for regression analyses
The selection of subscales for a hierarchical regression analyses was based on correlations between the subscales and a specific guidance score (e.g., during orientation, hypothesizing, determination of the weight, experimentation, conclusion/interpretation, and total). Correlations below .20 were excluded from regression analyses. The basic model for the regression analysis consisted of the significant correlation between a subscale and a specific guidance score. The extended model consisted of correlations above .20 between subscales and guidance scores (see Table 7). For example, with regard to the orientation phase, the basic model consisted of Debilitating anxiety scores. The extended model included the scores of the Converging learning style and Inadequacy scores.
Correlations between guidance and learner characteristics
With regard to personality characteristics, a positive correlation was expected between Persistence and Inquiry learning (hypothesis 1.2) and no correlation or negative correlation between Inadequacy, Social inadequacy, Recalcitrance, and Dominance (respectively hypotheses 1.1, 1.3, 1.4, and 1.5) and guidance during inquiry learning. The hypotheses (1.1, 1.2, 1.3, 1.4, and 1.5) were not confirmed. To investigate whether correlations existed in more specific phases of the cycle, correlations between guidance scores in these phases were calculated. A significant (and positive) correlation was found between Inadequacy and the amount of guidance provided during the determination of the weight of the objects (r = .39, p < .05, n = 33). Another significant, but negative correlation was found between Recalcitrance and the amount of guidance during the conclusion and interpretation phase (r = -.42, p < .01, N = 36).
21 the sub hypotheses were not found. Investigating the specific phases resulted in a significant
correlation between scores on Debilitating anxiety and guidance during the orientation phase (r =-.47, p < .01, n = 32). Social Desirability scores showed a significant correlation with guidance scores while hypothesizing (r = .44, p < .01, N = 36).
With regard to learning styles (hypothesis 3), it was expected that a Converging learning style and an Assimilating learning style show a positive correlation with the amount of guidance during the inquiry learning task (hypotheses 3.1 and 3.2). For a Diverging and Accommodative learning style, it was expected to show no or a negative correlation with the amount of guidance during the inquiry learning task (hypotheses 3.3 and 3.4). These hypotheses were not confirmed. While looking
specifically at the phases of the inquiry cycle, a significant negative correlation was found between a Converging learning style and the guidance to determine the weight (r = -.45, p < .01, n = 34).
Hypothesis 4 proposed that children with a higher self-esteem, regardless of the domain, require less guidance from the researcher during an inquiry learning task. The subscales Physical appearance, Behavioral conduct, and Global self-worth were excluded for further analyses. Scores on Athletic competence showed a significant correlation with guidance scores while hypothesizing (r = -.31, p < .05, n = 35). No significant correlations were found between scores on the remaining subscales and guidance scores.
Hypothesis 5 stated that children who scored high on science curiosity also require less guidance during an inquiry learning task. A significant correlation was found between SCS scores and guidance during the experimentation phase (r = -.35, p < .05, N = 36).
Other learner characteristics, as measured with the extra questionnaire, showed no significant results. The questionnaire was excluded for further measures.
Regression analyses
R squared change was used to determine whether additional subscales had an added value to the basic model. Hierarchical regression analysis showed that the basic model (Debilitating anxiety) accounted for 25 % (R2 = .25) of the variance in the guidance score during the orientation phase (F change(1,28)= 9.41, p< .01). The extended model with the Converging learning style had no added value to this model (F change(1,27)= 2.92, p > .05). Inadequacy had also no added value (F
change(1,26)= .22, p> .05). The basic model with Debilitating anxiety appeared to have little predictive value in the orientation phase (B = -.14, p < .05).
With regard to the hypothesizing phase, the basic model with Social Desirability and Athletic competence accounted for 23 % (R2= .23) of the variance in the guidance scores while hypothesizing (F change(1,31)= 4.64, p < .05). The extended model with Persistence scores had no added value (F change(1,30)= .13, p > .05). The predictive value of Social Desirability (B = .02, p < .05) and Athletic competence (B = -.02, p < .05) appeared significant but extremely weak.
22 Table 6
Correlations between subtests
Conv Div Ass. Acc IN VO SI RE DO P Fmin Fplus SW Sv Sa Sp Fv Gh Ge SC
Conv
Div -.04c
Ass. -.15a -.14c Acc -.48
**a
-.43 **c
-.38*a
IN -.19d .07d .08d -.07d VO .35b .04d .26b -.27b .22e
SI -.03a .09c -.06a .06a .51*d .21b
RE .15a .12c -.03a -.23a -.05d .02b -.06a DO -.20d -.29d .16d .28d .04e .08e .01d -04d P .49a -.09c .01a -.22a -.28d .45**b .12a .14a -.17d Fmin -.06a -.03c .03a .03a .64d .08b .45**a .22a .26d -.14
a
Fplus .11a .08c -.19a -.11a -.18d -.44 **b
-.40a -22a -.20d -.16
a -.42
**a SW .32a .10c -.17a -.02a -.00d .51**b .11a -15a -.10d .37
*a
-.08a -.21a
Sv .05a -.10c .06a -.05a -.39d -.00b -.09a -10a .16d .12a -.38a .16a -.02
a
Sa -.10b .02d .21b -.10b -.12e -.06c -.09b -17b .21e -09
b -.11
b .07b .03b .48
**b Sp -.03b -.26c -.17b .21b -.18e -.03c -.01b .13a .04e .16b -.32
*b
.05b -.26b .52 **b
.29*c
Fv .21a .06c .02a -.24a -.41 **d
.20b -.11a -21a -.11d .36 *a
-.50a .29*a .21a .71 **a
.46**
b .39
**b Gh . 25a -.15c .21a -.10a -.30
*d
.50**b .05a -15a .40 *d
.46 **a
-.31a -.05a .33*
a .50
**a
.42 **b
.24b .58 **a Ge .26a -.04b .01a -.17a -.56
**d
.06b -.22a .01a .13d .44 **a
-.29 *a
.23a -.37 *a .74 **a .51 **b .49 **b -.07
a -.19 a
SC .16a .10c .25a -.25a -.05d .48**b -.13a .03a -.07d .24a -.14a .01a .10a .05a -.14
b -.04 b .22 a
.19a .06a
23 Persistence. SI= Social Inadequacy. RE= Recalcitrance. DO= Dominance. P= Achievement scale. Fmin= Debilitating anxiety. Fplus= Facilitating anxiety. SW= Social Desirability. Sv= Scholastic competence. Sa= Social acceptance. Sp= Athletic competence. Fv= Physical appearance. Gh= Behavioral conduct. Ge= Global self-worth. SC= Science curiosity.
Table 7
Correlations between subtests and guidance scores
Conv Div Ass. Acc IN VO SI RE DO P Fmin Fplus SW Sv Sa Sp SC
O -.28e -.12e .21e -.01e -.20e .06e -.17e -.10e -.10e -.18e -.47 **e
.14e -.17e .15e -.15e .15e .16e H .08a .18a .07a .07a .11d .25b .15a -.08a .03d -.14a .01a -.08a .44
**a
-.02a .04b -.31 *b
-.09a DW -.11a -.45a
*c
.15a .19a .39 *d
.14b .02a -.18a .17d .00a .08a .03a -.01a -.08a -.21b .05b .10a E -.16a -.12a .14a -.04a .21d -.23b .18a -.19a -.07d -.19a -.16a .26a -.18a -.05a .04b .03b -.35
*a C/I -.13a -.15a -.04a .15a .21d -.12b .08a -.42
*a
-.13d -.23a -.11a .23a .14a -.06a -.17b -.17b -.06a T -.18a -.25a .07a .11a .19d -.16b .12a -.26a -.23d -.21a -.20a .33*a -.13a -.09a -.23b -.30b -.12a
Note. **Correlation significant at the .01 level (one-tailed). *Correlation significant at the .05 level (one-tailed). aN = 36. bn = 35. cn = 34. dn = 33. en = 32. Meaning of abbreviations for the columns: Conv= Converging learning style. Div= Diverging learning style. Ass.=Assimilating learning style. Acc=
24 For the experimentation phase, the basic model with Science Curiosity accounted for 15 % (R2= .15) of the variance in the guidance scores during the determination of the weight (F
change(1,30)= 5.24, p < .05). The extended model with Inadequacy (F change(1,29)= 2.44, p > .05) had no added value. The same can be stated about Persistence scores (F change(1,28)= 1.28 , p > .05). Facilitating anxiety added value to the basic model (F change(1,27)= 4.61, p > .05). The predictive value of the Science curiosity scale (B = -.06, p <.05) and Facilitating anxiety (B = .20, p < .05) appeared significant but weak.
With regard to the conclusion and interpretation phase, the basic model (consisting of Recalcitrance scores) accounted for 17 % (R 2= .17) of the variance in the guidance scores during the conclusion and interpretation phase (F change(1,34)= 7.12, p < .05). The extended model with Inadequacy(F change(1,33)= 1.80, p > .05), Achievement motive (F change(1,32)= .29, p > .05), and Facilitating anxiety (F change(1,31)= 1.52, p > .05).
Finally, a hierarchical regression analyses was used with eight predictors and the total amount of guidance. The eight predictors (Diverging learning style, Inadequacy, Recalcitrance, Facilitating anxiety, Debilitating anxiety, Social Desirability, Athletic competence, and Science Curiosity) showed a significant correlation with guidance during a specific phase of the inquiry cycle or with the total amount of guidance. The model with all these predictors showed that it accounted for 40 % (R 2= .40) of the variance in guidance score during the task. Debilitating anxiety had a significant influence (B = -.65, p < .05) on the total amount of guidance using this model with
predictors. Other predictors (Diverging learning style, Inadequacy, Recalcitrance, Facilitating anxiety, Social Desirability, Athletic competence, and Science Curiosity) had no significant predictive value. A model with only Debilitating anxiety as a predictor did not appear significant (B = -.21, p > .05) and accounted for only 4 % (R2= .04) of the variance in the total guidance score.
Discussion
Inquiry learning can be challenging for fifth grade students (Zimmerman, 2007) and improvements in their approaches to conducting an experiment can be achieved with appropriate guidance (Alfieri, Brooks, Aldrich, & Tenenbaum, 2011; Lee, 2011). The goal of this study was to investigate the amount of guidance necessary to reach a certain level of inquiry behavior and the influence of learner characteristics on that guidance. Information about children’s inquiry learning behavior was collected with an inquiry learning task divided into two parts. During part one children conducted experiments themselves to explore the materials. Part two involved guidance of the researcher when necessary when the child conducted the experiment again.
The inquiry cycle (as proposed by Klahr, 2000) served as the basis for determining the goal the child had to achieve (with or without guidance) before continuing their investigation. Guidance was divided into three types: (a) none, (b) partial guidance, and (c) complete guidance. Partial and complete guidance were provided when the child did not reach the goal set by the researcher in each phase. The two types of behavior, namely spontaneous or guided (partial or complete), were linked to five characteristics: (a) personality, (b) motivation, (c) learning styles, (d) self-esteem, and (e) curiosity.
25 Although significant correlations existed between learner characteristics and guidance, predictive values of the amount of guidance during inquiry learning appeared weak. As a result, it can be concluded that learner characteristic are not as influential as hypothesized. This emphasizes a shift of focus from individual differences to instructional methods. An additional analysis with the strongest predictors (scores with significant correlations with a guidance score) of the total amount of guidance showed that Debilitating anxiety could predict the total amount of guidance when other predictors (e.g., Diverging learning style, Inadequacy, and Recalcitrance) were present. Debilitating anxiety alone could not predict the total amount of guidance. This illustrates that more guidance is necessary when Debilitating anxiety scores increase while taking other learner characteristics into consideration. As mentioned earlier, Debilitating anxiety is often associated with test anxiety. Cognitive components of test anxiety are usually negative thoughts arising during the examinations or assignments, like a fear of failure (Putwain, Connors, & Symes, 2010). Studies have shown that test anxiety debilitates the performance of students (e.g., King, Ollendick, & Gullone, 1991). It reduces the achievement and inner motivation, and makes it difficult for someone to focus their attention (Stöber & Pekrun, 2004). In the present study, these feelings could result in asking more guidance. Hermans (1983) defined Debilitating anxiety as the degree in which a child has dysfunctional feelings about his/her achievements, it is possible that these feelings are present in other situations (e.g., in social situations). In general, the child experiences feelings of guilt, insecurity, and his/her
self-esteem is lower (Conroy, 2001, 2003). This could explain why other characteristics have to be present in predicting the total guidance score. However, if Debilitating anxiety is not only limited to
(academic) achievements, more correlations between other characteristics would be visible. For example, with Inadequacy or self-esteem, a child could be shy, withdrawn, and insecure about him- or herself.
Practical value
Children need different amounts of guidance and there is no ideal behavior pattern while
investigating certain phenomena. Although it is not necessary for children to behave according to an ideal pattern, certain aspects of conducting experiments should be taught or be mentioned during classes. Especially with several learner characteristics, such as shyness (measured with Inadequacy), behaviors during an experiment are focused on a few aspects wherein guidance could be provided (e.g., generating many hypotheses). To foster the knowledge on other aspects of experiments, like discovering the characteristics of objects (orienting) and concluding, an integrative and complete lesson could be scheduled to highlight the essential aspects. Children with certain preferences for an approach could become aware of the importance of other aspects. For example, if children do not state hypotheses, guidance could support them in becoming aware of other essential aspects. Studies show that inquiry learning is effective for knowledge acquisition about materials (e.g., clay) in creative courses (Mui, 2010) and for developing reflective thinking (Winters, 2011). Also with other subjects, such as music (Chen, Chen, & Hsiao, 2010) or learning in general (Prince, 2004), inquiry learning appears to have positive effects on knowledge acquisition. As an additional advantage, children are appealed to be involved in inquiry learning practices (Murphy, Varley, & Veale, in press). However, findings suggest that guidance or instruction is necessary to optimize the effectiveness of inquiry learning (Van Aalst & Truong, 2011; Prince, 2004).
26 phenomena (e.g., in a lesson) can be provided by teachers (Gürses, Kaya, Doğar, Günes, & Yolcu, 2010).
Limitations
No large influences of learner characteristics on inquiry learning were found. Regression analyses showed only small predictable values of the amount of guidance. These findings could be due to the fact that individual differences (e.g., learner characteristics) are not relevant for the amount of guidance. With the total amount of guidance, Debilitating anxiety appeared only significant in the presence of other predictors. Second, the inquiry learning task lacked a clear protocol when providing guidance. Although rules concerning when guidance should be provided were explicitly stated beforehand, it was not as clear as it should be. For future studies, clear protocols should be developed to increase its (interrater)reliability. The protocol should also include how to score the learning task based on the audio files, which was not as clear in the present study.
Third, the study captured the entire inquiry cycle but Zimmerman (2007) stated that research often involves one component (e.g., designing experiments or data-reading). Studying the entire inquiry cycle involves complexities with each phase, such as those experienced with experimentation skills and skills of evaluating results. Difficulties arise with designing experiments, but also with drawing conclusions and providing explanations for the findings. This means that children face more challenges when they are involved in the entire inquiry cycle compared with the challenges when they are involved in one phase of the cycle.
Fourth, differences among children indicated that there is no ideal approach during inquiry learning. With investigations, children apply different approaches and some approaches are more effective to achieve a goal. However, the different approaches could lead to the goal (or the right answer) and with inquiry learning, these approaches could all be correct. With inquiry learning there is no clear ‘’right or wrong’’; only the effectiveness of approaches differs. This illustrates how difficult it is to capture inquiry learning as a process. Several approaches could lead to the right experiments, evaluations, and conclusions. Thus, the phenomenon of inquiry learning has one problem with many different (but correct) solutions. As a result, inquiry learning is difficult to capture into a single score or task.
Finally, children already had experience during the second part on the inquiry task, which could have influenced the necessity of guidance. They already knew which materials could be tested and which objects sink or float as they have seen during part one.
Further research