2017, Vol. 5, No. 4 DOI: 10.15678/EBER.2017.050401
Competitiveness, Technology Licensing, and Ease
of Paying Taxes: A 30-Country Study
Michael Troilo, Michał Zdziarski, J. Markham Collins
A B S T R A C T
Objective: The objective of this article is to explore the impact of a regulatory con-straint: the ease of paying taxes, on the likelihood of technology licensing and the sub-sequent impact on the sales of firms acquiring such licences across 30 countries. Research Design & Methods: In a comparative, longitudinal study design we apply ran-dom effects panel logit, and ranran-dom-effects GLS regression models. The World Bank Enterprise Surveys panel data for Central Europe for 2008 to 2013 is the source data for the analysis. Surveys of firms from 30 countries in Central and Eastern Europe and Central Asia constitute the panel.
Findings: Increasing regulatory burden in the form of tax compliance reduces the likelihood of technology licensing. Technology licensing has only modest effects on sales. Foreign ownership of firms increases both the likelihood of technology licensing and revenues.
Implications & Recommendations: All manner of political entities, from towns to entire nations, revise their tax policies to woo investment. Our current analysis of the marginal effects suggests that the impact of these improvements is under-whelming. Attracting foreign ownership is recommended to increase technology licensing, sales and competitiveness.
Contribution & Value Added: While tax holidays are a common device to woo in-vestment, the interaction of tax regimes with technology licensing, specifically the regulatory burden of preparing and paying taxes, is scarcely studied. It is a gap we strive to fill in this manuscript.
Article type: research paper
Keywords: competitiveness; technology transfer; licensing; ease of paying taxes; stages of economic development; international business
JEL codes: F23, E62, L26
Received: 17 July 2017 Revised: 16 November 2017 Accepted: 15 December 2017
Suggested citation:
INTRODUCTION
Competitiveness at the national level is understood to be a phenomenon involving both firms that are world-class performers in their specific industry as well as a busi-ness environment that rewards innovation (Porter, 1990). Part of that environment is the regulatory regime which includes taxation. While tax holidays are a common de-vice to woo investment, the interaction of tax regimes with technology licensing, spe-cifically the burden of preparing and paying taxes, is scarcely studied. To our knowledge, there is no precise study of the effects of ease of paying taxes on technol-ogy transfer. It is a gap we strive to fill in this manuscript.
The motivation for our work is the increased focus of policymakers and firms on com-petitiveness, particularly in emerging and emergent markets, and how institutional con-straints affect decisions to adopt competitive measures. As we elucidate in our discussion below, nations develop by obtaining more advanced technology from other nations, hence enhancing their competitiveness by lowering production costs/increasing output, improving quality, or both. While policymakers sketch the broad strokes of technology transfer, firms are the entities acquiring the technology from foreign companies, with a view to improving their own competitiveness and hence their financial and operational performance. The “rules of the game” (North, 1990) that policymakers design and enforce, such as tax codes, will naturally have bearing on the attractiveness of sourcing technology from abroad.
Acquiring technology can occur when a firm purchases it from another firm, when a firm buys the entire company owning the technology, or when the firm licenses the technology. While all of these ways are important, we concentrate upon the latter in this article. Using a panel of nearly 5 500 firms across 30 countries for the period 2009-2013, we examine the impact of tax compliance (an instance of regulatory burden) on technology licensing. The sample of firms from World Bank survey which we use for this study is composed in 70% of small, entrepreneurial firms. We use measures of the number of tax payments required, the hours of tax preparation required, and the tax rate itself on the likelihood of a firm licensing technology from a foreign company. We then analyse the effect such licensing has on annual sales, grouping the firms initially by national stage of development (Innovation, High Effi-ciency, Low EffiEffi-ciency, and Factor), and then by country. In a comparative, longitudinal study design we apply quantitative research methods including random effects panel logit, and random-effects general least squares regression models.
and social services. These benefits may outweigh the costs of higher rates, so the expected negative effect on obtaining technology licensing is not observed in this environment
We anticipate that technology licensing will be a boon for annual sales. This is the case for firms in Innovation economies, but the overall results are not impressive. On the other hand, foreign ownership of a firm bodes well for both technology licens-ing and for sales. There are robust, positive correlations across the overall sample and subsamples for foreign ownership and both the likelihood of licensing technology as well as annual revenues. At the national level, both technology licensing and for-eign ownership tend to be significant for firm sales in countries at the Low Efficiency stage of development. Ten of the fourteen nations in the Low Efficiency category show significant results for technology licensing, foreign ownership, or both.
The remainder of the article is organised as follows. Our literature review encompasses separate sections on the germane topics of competitiveness, technology transfer, and regula-tory burden. We then describe the data and methods in detail prior to sharing our results. A discussion of those results, limitations, and future research avenues conclude the article.
LITERATURE REVIEW
International Competitiveness and Firm-level Performance
International competitiveness is subject to policy discussions, public debate and govern-mental actions based on rankings and comparative statistic (Fagerberg, 1988), yet the the-oretical grounding of this concept is not well established (Krugman, 1996). Czako (2003) proposes that competitiveness research should offer a paradigm stimulating the modifi-cation and reinterpretation of traditional boundaries between economics and manage-ment. Based upon a critical review of classic competitiveness studies, she mentions a com-mon multi-level approach linking firm level and macroeconomic observations, as well as the use of comparative international data to formulate conclusions.
These studies suggest that national competitiveness begins at the level of the firm; for a country to be competitive, its enterprises need to be competitive and productive (Czakó, 2003). This multilevel nature of competitiveness closely relates to that of the World Eco-nomic Forum (Porter, 2005). The multilevel approach linking competitiveness of an economy with firm level decisions of individual entrepreneurs and managers is rather rare in manage-ment and economics literature. Wood, Bylund and Bradley (2016) suggest there is a gap in studying behavioural aspects of decision making by entrepreneurs related to public policy initiatives, such as taxes which influence the competitiveness of an economy. Mottner and Johnson (2000, p. 186) claim that the majority of earlier research into international licensing has focused on large firms, while smaller firms may be more inclined to license technology due to financial constraints in choosing an alternative of own technology development. We address this gap by examining technology licensing in the unique sample of firms from the World Bank survey. More than 70% of the sample are small, entrepreneurial firms.
should upgrade from competing on low-cost labour and/or natural resources to more so-phisticated, technology-driven competitive advantages (Puślecki, 2010). Technology adap-tation via licensing or other means is critical for upgrading the abilities of employees, productivity, and efficiency (Damijan, Jaklič, & Rojec, 2006).
Figure 1. Determinants of productivity growth
Source: authors’ depiction based on Porter (2005, p. 3).
A variety of global, regional, country, industry and cluster level benchmarking studies serve as th basis for competitiveness research (Lall, 2001). Out of these studies, two have had the greatest impact so far: The Global Competitiveness Report of the World Economic Forum from Geneva, and The World Competitiveness Report published by IMD Business School from Lausanne. We describe both studies briefly, before describing selected as-pects of competitiveness which we are planning to examine in depth in this article.
The World Economic Forum (WEF) defines competitiveness as: “the set of institutions, policies, and factors that determine the level of productivity of a country” (Browne, Corrigan, Crotti, Di Battista, Drzeniek, Hanouz, Galvan, & Sala-i-Martín, 2016). The WEF’s approach maintains that the level of total factor productivity determines the level of prosperity that can be reached by an economy, and their report has been published from 2005. There are 12 pillars of competitiveness, or broad categories that the WEF uses to compare across coun-tries. They include: institutions, infrastructure, macroeconomic environment, market size, innovation, business sophistication, technological readiness, financial market development, labour market efficiency, goods market efficiency, higher education and training, health & primary education. These categories are aggregated into three sub-indices: basic require-ments, efficiency enhancers, and innovation and sophistication factors, with simple average scores from the measurements yielding the country score on each of the 12 pillars.
capita in USD. For example, innovation and sophistication factors account for 5% weight in the total score for factor-driven economies (per-capita GDP < 2 000 USD), 10% for efficiency-driven countries (between 2 000 USD – 16 999 USD), and 30% for innovation-efficiency-driven econo-mies (17 000 USD and above) (Browne et al., 2016). Implicit in this approach is a comparative advantage perspective, and an assumption that for emerging and recently developed econo-mies the ability to increase productivity in a competitive world relies on different factors. The effect the factors have on the score vary among categories of countries, but is standard for countries in the same category. In consequence, the potential for an emerging country to as-cend to the next level depends primarily on its ability to adapt technologies from other econ-omies. Economic development literature (see Lall, 2001) supports this trajectory. In summary, the approach of the WEF takes into account that effective shifts in competitiveness at the country level depend on its current stage of development (Collins & Troilo, 2015).
The World Competitiveness Report (WCR), published by IMD Business School from Lau-sanne (IMD), also acknowledges the multilevel nature of international competitiveness, and ranks countries based on the ability to create and to maintain an environment in which com-panies can compete. As such, the report pays particular attention to the quality of national institutions and national economic factors, upon which the firms in that country can build global competitive advantage. The WCR divides the national environment into four catego-ries: economic performance, government efficiency, business efficiency, and infrastructure. Each of these is further divided into five subcategories, operationalised further by 340 measures. IMD uses equal weights for each of the 20 sub-categories that have 5% individual weights in the overall competitiveness index (IMD World Competitiveness Center, 2016). The model assumes the impact of these sub-categories across countries at different levels of eco-nomic development is equal, unlike the WEF index. On the contrary, the approach taken by IMD implies that each sub-category measured in its report equally impacts competitiveness of any country in the global economy. While the WEF index is easily accessible, the assump-tion of sub-category assumpassump-tion has been criticised as lacking rigour (Lall, 2001). The practi-cal consequence is that policymakers have little guidance on which factor, or a group of fac-tors, merit their attention, even though the index is easy to use.
Technology Transfer
The issue of technology transfer is of critical importance in the world, in which speed of technology development in developed countries increases, while inequalities and pov-erty are persistent phenomena of concern across many emerging economies (Mottner & Johnson, 2000; Seven & Coskun, 2016). Total factor productivity increases over time mainly due to technology change. For example, Solow (1957) shows that gross output per employee almost doubled in the US from 1909 to 1949, and he attributes over 87% of this increase to technical change (Eggertson, 2009). Technology which enables productivity enhancement is the key driver influencing most factors measured in the WEF and IMD rankings. A country’s capacity to adapt and to improve technologies de-veloped in other nations is a core issue debated in many policy documents on national innovation and competitiveness (Lall, 2001; Ajitabh & Momaya, 2004).
of their industries. Developing proprietary technology is costly and time-consuming, there-fore, efficient technology transfer from other countries is critical for industrialisation of emerging economies (Lall, 2001; Lopez, 2008). Technology transfer has been identified as almost synonymous with international licensing (Mottner & Johnson, 2000).
The monetary value of technology licensing has increased quite substantially over time. In the thirty years from 1975 to 2005, the global value of royalties and licence fees increased 25 times from 4 to 100 USD billion (Lopez, 2008). Further growth in technology licensing is expected due to globalisation, shortening technology life cycles, and the in-creasing cost of research and development (Aulakh, Jiang, & Pan, 2010). In addition, there have been major institutional improvements in the whole regions of transition and emerg-ing economies, e.g. Central and Eastern Europe (Collins & Troilo, 2015). As a result, the internalisation of technological advantage and direct investment in these economies be-comes less efficient relative to the more flexible alternative of technology licensing to local firms (Aulakh, Jiang, & Pan, 2010). The trade-off between setting up a subsidiary and in-ternalising technological advantage versus licensing with an indigenous firm is well estab-lished in international business theory (Chen, 2005). Firms will have incentives to internal-ise if they can achieve relative advantage from hierarchy, where transaction costs are high and market mechanisms are not efficient (Dunning, 1981).
Ease of Paying Taxes and Regulatory Burden
Technology transfer requires two parties, the proprietor of the technology and the technology customer who applies the technology. National regulations and the appli-cation of the rule of law affect both parties in the same way. The literature is robust with respect to the effects that regulatory characteristics have on the cost of interna-tional transfers from the perspective of the technology proprietors; however, most of this work concerns the technology proprietors, not the recipients.
A related body of research concerns regulatory burden and entrepreneurship. Moreno (2015) reviews many recent empirical studies and concludes that “most empirical analysis finds a negative relationship between regulatory restrictions and entrepreneur-ship.” This stream starts from at least the beginning of the millennium and includes the results of Djankov, LaPorta, Lopes-de-Silanes and Shleifer (2002), Demirguc-Kunt, Love and Maksimovic (2006), Klapper, Laeven and Rajan (2006), Troilo (2011). On the other hand, Bowen and DeClercq (2008) find no effect of regulatory burden on entrepreneurial firms, while Gentry and Hubbard (2005) claim that the effect of taxation on entrepreneurs in innovative industries is indeterminate. In contrast to the majority, Levie and Autio (2011) demonstrate a statistically positive relationship between higher strategic and non-strate-gic entrepreneurial entry and lighter regulatory burden. They find these effects are some-what mitigated if the country enforces the rule of law. Some of these differences are a function of how the various researchers define and measure entrepreneurship.
and the tax preparation and payment burdens indirect costs similar to other regulatory bur-dens. Therefore, the amount of tax, the amount of time spent in tax preparation, and the number of times a year taxes must be paid all constitute regulatory expenses.
Although there is a lack of scholarship on the impact of ease of paying taxes on technol-ogy transfer per se, it seems likely that regulatory burden in the form of greater demands for paying taxes would have a deleterious effect on technology transfer. Additionally, the expec-tation of greater reward in the form of higher revenues is the impetus for acquiring technol-ogy (see Dess, Covin, & Lumpkin, 1997; Guo, 2008; Troilo, 2014), whereas higher tax rates would have a dampening effect. We propose the following hypotheses for testing:
H1: The number of tax payments will correlate negatively with obtaining a tech-nology licence.
H2: The number of hours of tax preparation will correlate negatively with ob-taining a technology licence.
H3: Higher tax rates will correlate negatively with obtaining a technology licence. H4: Obtaining a technology licence will correlate positively with sales revenue.
The points of interest in these hypothesis are the magnitudes of the effects, as well as the variation across nations and stages of development (Figure 1). We summarise the hy-potheses and citations of relevant literature (Table 1).
Table 1. Summary of hypotheses and relevant literature
Hypotheses Relevant literature
H1, H2, H3 – higher regulatory burden in the form of tax compliance will reduce the like-lihood of obtaining a technology licence.
- Existence of distortionary effects of taxation and related exter-nalities (Baumol, 1972; McGrattan, 1994).
- Deleterious effects of such distortions on entrepreneurship and in-novation (Djankov et al., 2002; Moreno, 2015; Wood et al., 2016).
H4 – Acquiring technology has a positive ef-fect on firm outcomes such as sales revenue
Empirical evidence corroborating the positive effect of technol-ogy acquisition on firm performance (Dess et al., 1997; Guo, 2008; Troilo, 2014)
Source: own study.
MATERIAL AND METHODS
The World Bank Enterprise Surveys panel data for Central Europe for 2008 to 2013 is the source data for the analysis. Surveys of firms from 30 countries in Central and Eastern Europe and Central Asia constitute the panel. The World Bank surveyed firms in several countries in 2008 and revisited them in 2012, but most firms were queried in 2009 and again in 2013. In terms of time, the sample is balanced; each firm appears twice. There is a total of 5 458 observations (2 729 firms x 2) in our analysis.
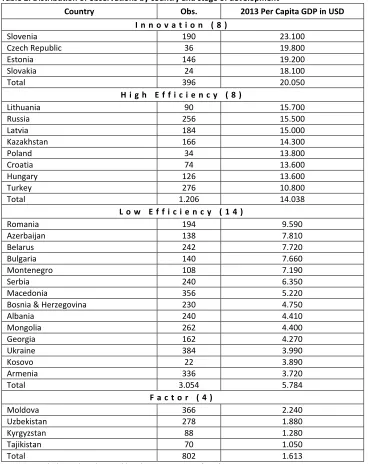
Using per-capita GDP for 2013, we sort the 30 countries into categories of develop-ment roughly based upon the WEF criteria. We differentiate between “High Efficiency” and “Low Efficiency” economies because the data seems to merit it (Table 2).
Table 2. Distribution of observations by country and stage of development
Country Obs. 2013 Per Capita GDP in USD I n n o v a t i o n ( 8 )
Slovenia 190 23.100
Czech Republic 36 19.800
Estonia 146 19.200
Slovakia 24 18.100
Total 396 20.050
H i g h E f f i c i e n c y ( 8 )
Lithuania 90 15.700
Russia 256 15.500
Latvia 184 15.000
Kazakhstan 166 14.300
Poland 34 13.800
Croatia 74 13.600
Hungary 126 13.600
Turkey 276 10.800
Total 1.206 14.038
L o w E f f i c i e n c y ( 1 4 )
Romania 194 9.590
Azerbaijan 138 7.810
Belarus 242 7.720
Bulgaria 140 7.660
Montenegro 108 7.190
Serbia 240 6.350
Macedonia 356 5.220
Bosnia & Herzegovina 230 4.750
Albania 240 4.410
Mongolia 262 4.400
Georgia 162 4.270
Ukraine 384 3.990
Kosovo 22 3.890
Armenia 336 3.720
Total 3.054 5.784
F a c t o r ( 4 )
Moldova 366 2.240
Uzbekistan 278 1.880
Kyrgyzstan 88 1.280
Tajikistan 70 1.050
Total 802 1.613
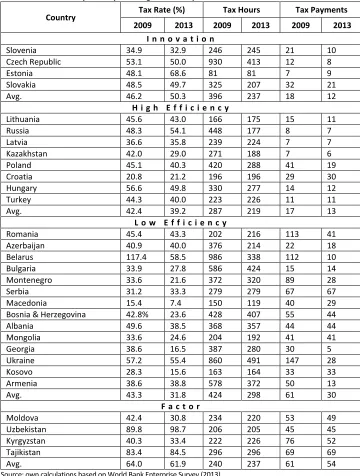
Table 3. Tax metrics by country and stage of development
Country Tax Rate (%) Tax Hours Tax Payments 2009 2013 2009 2013 2009 2013
I n n o v a t i o n
Slovenia 34.9 32.9 246 245 21 10
Czech Republic 53.1 50.0 930 413 12 8
Estonia 48.1 68.6 81 81 7 9
Slovakia 48.5 49.7 325 207 32 21
Avg. 46.2 50.3 396 237 18 12
H i g h E f f i c i e n c y
Lithuania 45.6 43.0 166 175 15 11
Russia 48.3 54.1 448 177 8 7
Latvia 36.6 35.8 239 224 7 7
Kazakhstan 42.0 29.0 271 188 7 6
Poland 45.1 40.3 420 288 41 19
Croatia 20.8 21.2 196 196 29 30
Hungary 56.6 49.8 330 277 14 12
Turkey 44.3 40.0 223 226 11 11
Avg. 42.4 39.2 287 219 17 13
L o w E f f i c i e n c y
Romania 45.4 43.3 202 216 113 41
Azerbaijan 40.9 40.0 376 214 22 18
Belarus 117.4 58.5 986 338 112 10
Bulgaria 33.9 27.8 586 424 15 14
Montenegro 33.6 21.6 372 320 89 28
Serbia 31.2 33.3 279 279 67 67
Macedonia 15.4 7.4 150 119 40 29
Bosnia & Herzegovina 42.8% 23.6 428 407 55 44
Albania 49.6 38.5 368 357 44 44
Mongolia 33.6 24.6 204 192 41 41
Georgia 38.6 16.5 387 280 30 5
Ukraine 57.2 55.4 860 491 147 28
Kosovo 28.3 15.6 163 164 33 33
Armenia 38.6 38.8 578 372 50 13
Avg. 43.3 31.8 424 298 61 30
F a c t o r
Moldova 42.4 30.8 234 220 53 49
Uzbekistan 89.8 98.7 206 205 45 45
Kyrgyzstan 40.3 33.4 222 226 76 52
Tajikistan 83.4 84.5 296 296 69 69
Avg. 64.0 61.9 240 237 61 54
Source: own calculations based on World Bank Enterprise Survey (2013).
number of observations by stage of development are: 396 observations and 198 firms in In-novation, 1 206 observations and 603 firms in High Efficiency, 3 054 observations and 1 527 firms in Low Efficiency and 802 observations and 401 firms in Factor, respectively.
Table 3 offers details for the tax regimes of the countries in the sample, along with av-erages by stage of development, which is compiled from the World Bank Doing Business In-dicators. As explained more completely below, Tax Rate is the overall rate of taxation for corporations, Tax Hours is the number of labour hours needed to comply with the tax code, and Tax Payments is the number of payments necessary to fulfil all tax obligations.
According to Table 3, the tax rate for Innovation economies actually climbed from 46.2% in 2009 to 50.3% in 2013 for an increase of 9.0%.1 The number of tax hours for the Innovation category fell by a whopping 40%, though it is interesting to note that in absolute terms the average number of tax hours in 2013 is equal to that for Factor econ-omies (237) and greater than for High Efficiency countries (219). The Czech Republic shaved 56% of its tax compliance hours, yet remains the highest at 413. The number of tax payments declined by one-third from 18 to 12.
The High Efficiency grouping made strides in all three measurements from 2009 to 2013. Tax rates fell by 7.7%, tax hours declined 23.6%, and tax payments were reduced by 22.0%. At the country level, Poland made notable improvement in tax payments, going from 41 to 19 for a decrease of nearly 54%. Russia’s tax hours dropped 60.5% from 448 to 177.
Of the development categories, the Low Efficiency bucket showed the greatest improve-ment in both tax rates and tax payimprove-ments. They dropped by 26.6% in the former and 51.6% in the latter. The number of tax hours also decreased by 29.7%, second only to the Innovation category. The most improved country across the board is Belarus, with declines in rates, hours, and payments of 50.2%, 65.7%, and 91.1%. Georgia, Armenia, Montenegro, and Ukraine also registered dramatic success, particularly in the realm of the number of payments.
The Factor grouping also improved over time, but its gains were modest at best. Tax rates fell 3.3%, hours dropped 1.1%, and payments decreased 11.5%. Kyrgyzstan had the most impressive overall gains, with rates falling 17% and number of payments declining 32%. Moldova’s tax rate fell 27.4% during the period.
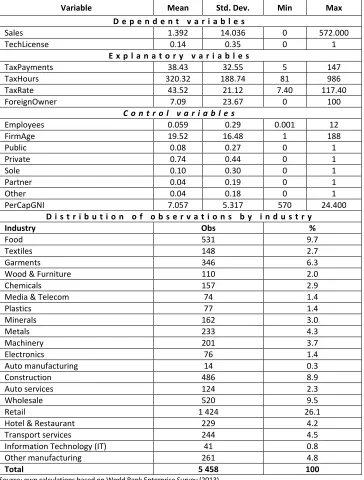
Variable definitions appear in Table 4, and descriptive statistics are in Table 5. There are two dependent variables, each of which is estimated separately as described below. Sales is a continuous variable capturing annual sales in millions of local currency units. TechLicense is a dichotomous variable; firms were asked if they have technology licensed from a foreign company. The “Yes” answer is coded as 1 and the “No” is a 0. The average annual sales amount is 1.4 billion LCUs, and 14% of firms licensed technology from a for-eign enterprise during the period. In terms of industry, Retail represents the largest sector at 26.1%, followed by Food (9.7%), Wholesale (9.5%), and Construction (8.9%).
As indicated, there are three variables of interest regarding taxation, and these were collected from the World Bank Doing Business Indicators.2 TaxRate is the total tax rate the firm bears as a share of its commercial profit after accounting for any
1 Calculations relating to Table 2 generally use this equation: (Begin-End)/Begin, though for this calculation it is actually (End-Begin)/Begin so (50.3-46.2)/46.2 = 0.0899 = 9%. The numbers are percentage changes from the beginning base, including the changes in tax rates.
allowable deductions and exemptions (World Bank, 2016). It includes income, sales, labour, and infrastructure taxes. TaxHours is the amount of time in hours per year needed to prepare, file, and pay income taxes, sales and/or value-added taxes (VAT), and labour taxes including social contributions (World Bank, 2016). TaxPayments is the number of payments needed to satisfy all tax obligations. It reflects the total number of taxes paid, the method of payment, the frequency of payment, the fre-quency of filing, and the number of government agencies involved (World Bank, 2016). An additional variable of interest is the percentage of foreign ownership, which ForeignOwner represents. On average, 7.1% of the firm’s equity is in the hands of a foreign enterprise.
Table 4. Variable definitions
Variable Definition
D e p e n d e n t v a r i a b l e s
Sales Annual sales in millions of local currency units (LCUs)
TechLicense “Does the firm have technology licensed from a foreign company?” (Yes=1, No=0)
E x p l a n a t o r y v a r i a b l e s
TaxPayments The number of annual tax payments
TaxHours The number of hours spent annually to comply with tax codes. TaxRate The total tax rate, expressed as a share of commercial profits. ForeignOwner The percentage of the firm owned by a foreign enterprise.
C o n t r o l v a r i a b l e s
Employees The number of full-time employees of the firm, in thousands FirmAge The age of the firm in years
Public Legal status: Firm is publicly listed. (Yes=1)
Private Legal status: Firm is a private limited liability corporation. (Yes=1) Sole Legal status: Firm is a sole proprietorship. (Yes=1)
Partner Legal status: Firm is a partnership. (Yes=1)
PerCapGNI Per-capita Gross National Income in nominal US dollars. Source: own study.
Firm-level controls include the number of employees, firm age, and the legal status of the firm. The Employees variable is in thousands of full-time workers, and on average firms employed 59 labourers. The average age of firms in the sample is 19.5 years, with a stand-ard deviation of 16.5 years. Nearly three quarters of firms register as privately held con-cerns, whereas 10% are sole proprietorships and 8% are publicly traded. In terms of indus-try, Retail represents the largest sector at 26.1%, followed by Food (9.7%), Wholesale (9.5%), and Construction (8.9%). These five segments, plus Hotel & Restaurant and Transport Services, have categorical variables as industry controls.
Table 5. Descriptive statistics
Variable Mean Std. Dev. Min Max D e p e n d e n t v a r i a b l e s
Sales 1.392 14.036 0 572.000
TechLicense 0.14 0.35 0 1
E x p l a n a t o r y v a r i a b l e s
TaxPayments 38.43 32.55 5 147
TaxHours 320.32 188.74 81 986
TaxRate 43.52 21.12 7.40 117.40
ForeignOwner 7.09 23.67 0 100
C o n t r o l v a r i a b l e s
Employees 0.059 0.29 0.001 12
FirmAge 19.52 16.48 1 188
Public 0.08 0.27 0 1
Private 0.74 0.44 0 1
Sole 0.10 0.30 0 1
Partner 0.04 0.19 0 1
Other 0.04 0.18 0 1
PerCapGNI 7.057 5.317 570 24.400
D i s t r i b u t i o n o f o b s e r v a t i o n s b y i n d u s t r y
Industry Obs %
Food 531 9.7
Textiles 148 2.7
Garments 346 6.3
Wood & Furniture 110 2.0
Chemicals 157 2.9
Media & Telecom 74 1.4
Plastics 77 1.4
Minerals 162 3.0
Metals 233 4.3
Machinery 201 3.7
Electronics 76 1.4
Auto manufacturing 14 0.3
Construction 486 8.9
Auto services 124 2.3
Wholesale 520 9.5
Retail 1 424 26.1
Hotel & Restaurant 229 4.2
Transport services 244 4.5
Information Technology (IT) 41 0.8
Other manufacturing 261 4.8
Total 5 458 100
These estimates are performed using one of the variables of interest, e.g. TaxRate along with the controls. The regression equation has the following form:
Pr ℎ = + +
+ ∑&#' "# $% #+ ∑&)' ()* +, % )+ * + -
(1) where:
- is TaxPayments, TaxHours, and TaxRate in turn.
These estimates are performed for the total sample and for each development cate-gory for each of the three tax variables. For purposes of comparison, “Other” is the omit-ted category for legal status. After estimation, marginal effects of the key explanatory var-iables are calculated for those varvar-iables that are statistically significant.
In the second step, a random-effects panel generalised least squares (GLS) re-gression estimates the impact of having a technology license on annual sales. The equation is similar to (1) above:
. = ℎ + +
+ ∑& "# $% #
#' + ∑&)' ()* +, % )+ * + -
(2) Because this is a linear regression, the value of the coefficients are the marginal ef-fects. Note that there are no country-level fixed effects because the tax burden is a coun-try-level phenomenon that the regression analyses are trying to capture.
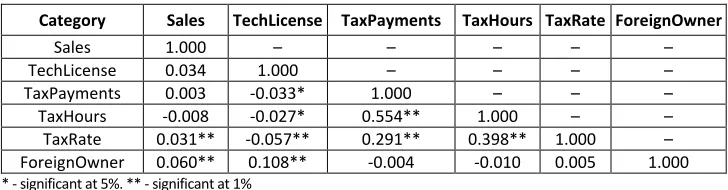
Table 6. Correlation matrix
Category Sales TechLicense TaxPayments TaxHours TaxRate ForeignOwner
Sales 1.000 – – – – –
TechLicense 0.034 1.000 – – – –
TaxPayments 0.003 -0.033* 1.000 – – –
TaxHours -0.008 -0.027* 0.554** 1.000 – –
TaxRate 0.031** -0.057** 0.291** 0.398** 1.000 – ForeignOwner 0.060** 0.108** -0.004 -0.010 0.005 1.000 * - significant at 5%. ** - significant at 1%
Source: own calculations based on World Bank Enterprise Survey (2013).
Table 6 contains the correlation matrix of the main variables. As a check for collinear-ity, the matrix is reviewed for correlations with an absolute value greater than 0.700. No such value is found, so collinearity does not appear to be a concern. The highest correla-tion exists between TaxHours and TaxPayments at 0.55. The use of a Baltagi-Wu test (Levie & Autio, 2011; Baltagi & Wu, 1999) revealed no serial autocorrelation in the data.
RESULTS AND DISCUSSION
The next step is to analyse marginal effects for TaxPayments for the overall sample as well as the Innovation and Low Efficiency categories. According to Woolridge (2013), the assumption of serial independence of observations in a correlated random-effects panel data model is a strong one, and can be problematic for calculating average partial (mar-ginal) effects. An alternative is to pool the data and estimate the dependent variable using a probability unit (probit) model, then calculate the marginal effects of the variables from this equation. The marginal effects from a pooled probit estimate will be nearly identical to that of correlated random-effects panel model, are easier to calculate, and are as sta-tistically robust (Woolridge, 2013; Arulampalam, 1996). This is the method employed for all marginal effects reported in this article, but we do not show the pooled results for brev-ity. These effects cannot be discerned from the coefficients displayed in the tables.
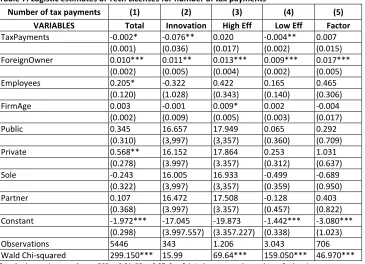
Table 7. Logistic estimates of Tech Licenses for number of tax payments
Number of tax payments (1) (2) (3) (4) (5) VARIABLES Total Innovation High Eff Low Eff Factor
TaxPayments -0.002* -0.076** 0.020 -0.004** 0.007
(0.001) (0.036) (0.017) (0.002) (0.015) ForeignOwner 0.010*** 0.011** 0.013*** 0.009*** 0.017***
(0.002) (0.005) (0.004) (0.002) (0.005)
Employees 0.205* -0.322 0.422 0.165 0.465
(0.120) (1.028) (0.343) (0.140) (0.306)
FirmAge 0.003 -0.001 0.009* 0.002 -0.004
(0.002) (0.009) (0.005) (0.003) (0.017)
Public 0.345 16.657 17.949 0.065 0.292
(0.310) (3,997) (3,357) (0.360) (0.709)
Private 0.568** 16.152 17.864 0.253 1.031
(0.278) (3.997) (3.357) (0.312) (0.637)
Sole -0.243 16.005 16.933 -0.499 -0.689
(0.322) (3,997) (3,357) (0.359) (0.950)
Partner 0.107 16.472 17.508 -0.128 0.403
(0.368) (3.997) (3.357) (0.457) (0.822)
Constant -1.972*** -17.045 -19.873 -1.442*** -3.080***
(0.298) (3.997.557) (3.357.227) (0.338) (1.023)
Observations 5446 343 1.206 3.043 706
Wald Chi-squared 299.150*** 15.99 69.64*** 159.050*** 46.970*** Standard errors in parentheses: *** p<0.01, ** p<0.05, * p<0.1. Industry controls not shown for brevity.
Source: own calculations based on World Bank Enterprise Survey (2013).
likelihood by 8%. For Low Efficiency countries, the effects are -0.4% and -4%, respectively. ForeignOwner has a positive marginal effect of 0.1%, so a 10% increase in the foreign own-ership of a firm increases the likelihood of that firm licensing technology by just 1%.
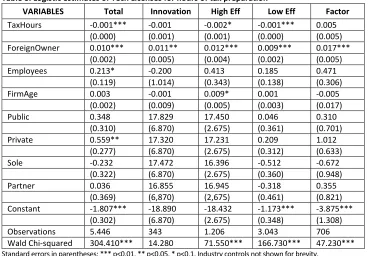
Table 8. Logistic estimates of Tech Licenses for hours of tax preparation
VARIABLES Total Innovation High Eff Low Eff Factor
TaxHours -0.001*** -0.001 -0.002* -0.001*** 0.005
(0.000) (0.001) (0.001) (0.000) (0.005) ForeignOwner 0.010*** 0.011** 0.012*** 0.009*** 0.017***
(0.002) (0.005) (0.004) (0.002) (0.005)
Employees 0.213* -0.200 0.413 0.185 0.471
(0.119) (1.014) (0.343) (0.138) (0.306)
FirmAge 0.003 -0.001 0.009* 0.001 -0.005
(0.002) (0.009) (0.005) (0.003) (0.017)
Public 0.348 17.829 17.450 0.046 0.310
(0.310) (6.870) (2.675) (0.361) (0.701)
Private 0.559** 17.320 17.231 0.209 1.012
(0.277) (6.870) (2.675) (0.312) (0.633)
Sole -0.232 17.472 16.396 -0.512 -0.672
(0.322) (6.870) (2.675) (0.360) (0.948)
Partner 0.036 16.855 16.945 -0.318 0.355
(0.369) (6,870) (2,675) (0.461) (0.821) Constant -1.807*** -18.890 -18.432 -1.173*** -3.875***
(0.302) (6.870) (2.675) (0.348) (1.308)
Observations 5.446 343 1.206 3.043 706
Wald Chi-squared 304.410*** 14.280 71.550*** 166.730*** 47.230*** Standard errors in parentheses: *** p<0.01, ** p<0.05, * p<0.1. Industry controls not shown for brevity.
Source: own calculations based on World Bank Enterprise Survey (2013).
Table 8 displays the results for TaxHours. Here TaxHours has the expected effect for both the overall sample as well as for High Efficiency and Low Efficiency nations. TaxHours is neg-ative and significant at 1% for both the overall sample and for Low Efficiency economies, and is negative and significant at 10% for High Efficiency countries. These results support H2. As may be expected, the marginal effect of a single hour is infinitesimal. An additional 100 hours of tax preparation would only reduce the likelihood of obtaining a technology license by a scant 0.08% for the sample as a whole. For the subsamples, the effects are more pro-nounced. An additional 100 hours reduces the likelihood of technology licensing in High Ef-ficiency economies by 3% and in Low EfEf-ficiency economies by 1%.
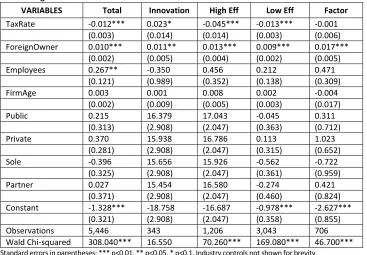
therefore lowers the probability of licensing by 1.0%. Such an increase reduces the likeli-hood of licensing by 4% in High Efficiency countries and by 1% in Low Efficiency countries, but increases the likelihood in Innovation economies by 2%.
Table 9. Logistic estimates of Tech Licenses for tax rate
VARIABLES Total Innovation High Eff Low Eff Factor
TaxRate -0.012*** 0.023* -0.045*** -0.013*** -0.001
(0.003) (0.014) (0.014) (0.003) (0.006) ForeignOwner 0.010*** 0.011** 0.013*** 0.009*** 0.017***
(0.002) (0.005) (0.004) (0.002) (0.005)
Employees 0.267** -0.350 0.456 0.212 0.471
(0.121) (0.989) (0.352) (0.138) (0.309)
FirmAge 0.003 0.001 0.008 0.002 -0.004
(0.002) (0.009) (0.005) (0.003) (0.017)
Public 0.215 16.379 17.043 -0.045 0.311
(0.313) (2.908) (2.047) (0.363) (0.712)
Private 0.370 15.938 16.786 0.113 1.023
(0.281) (2.908) (2.047) (0.315) (0.652)
Sole -0.396 15.656 15.926 -0.562 -0.722
(0.325) (2.908) (2.047) (0.361) (0.959)
Partner 0.027 15.454 16.580 -0.274 0.421
(0.371) (2.908) (2.047) (0.460) (0.824) Constant -1.328*** -18.758 -16.687 -0.978*** -2.627***
(0.321) (2.908) (2.047) (0.358) (0.855)
Observations 5,446 343 1,206 3,043 706
Wald Chi-squared 308.040*** 16.550 70.260*** 169.080*** 46.700*** Standard errors in parentheses: *** p<0.01, ** p<0.05, * p<0.1. Industry controls not shown for brevity.
Source: own calculations based on World Bank Enterprise Survey (2013).
Because of the strong assumptions underlying the random-effects panel model mentioned earlier, we perform some robustness checks. Woolridge (2013) describes Generalised Estimating Equations (GEE) as “essentially multivariate, nonlinear least squares” (p. 43). We check the reported results in Tables 7 through 9 with this method and find the same outcomes with regard to statistical significance, direction, and relative magnitude for the key explanatory variables. Moreover, marginal effects can be readily calculated from GEE without losing the time element inherent to the pooled probit approach. The marginal effects are materially identical to those calcu-lated above with the pooled probit.
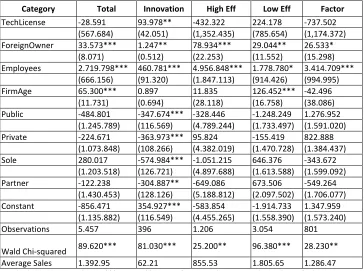
The last two tables present the findings from the second stage of the analysis. The effect of having technology licensed from a foreign company on annual sales appears in Table 10.
Table 10. Generalised least squares estimates of sales and technology license
Category Total Innovation High Eff Low Eff Factor
TechLicense -28.591 93.978** -432.322 224.178 -737.502 (567.684) (42.051) (1,352.435) (785.654) (1,174.372) ForeignOwner 33.573*** 1.247** 78.934*** 29.044** 26.533*
(8.071) (0.512) (22.253) (11.552) (15.298) Employees 2.719.798*** 460.781*** 4.956.848*** 1.778.780* 3.414.709***
(666.156) (91.320) (1.847.113) (914.426) (994.995)
FirmAge 65.300*** 0.897 11.835 126.452*** -42.496
(11.731) (0.694) (28.118) (16.758) (38.086) Public -484.801 -347.674*** -328.446 -1.248.249 1.276.952
(1.245.789) (116.569) (4.789.244) (1.733.497) (1.591.020) Private -224.671 -363.973*** 95.824 -155.419 822.888
(1.073.848) (108.266) (4.382.019) (1.470.728) (1.384.437) Sole 280.017 -574.984*** -1.051.215 646.376 -343.672
(1.203.518) (126.721) (4.897.688) (1.613.588) (1.599.092) Partner -122.238 -304.887** -649.086 673.506 -549.264
(1.430.453) (128.126) (5.188.812) (2.097.502) (1.706.077) Constant -856.471 354.927*** -583.854 -1.914.733 1.347.959
(1.135.882) (116.549) (4.455.265) (1.558.390) (1.573.240)
Observations 5.457 396 1.206 3.054 801
Wald Chi-squared 89.620*** 81.030*** 25.200** 96.380*** 28.230** Average Sales 1.392.95 62.21 855.53 1.805.65 1.286.47 Standard errors in parentheses: *** p<0.01, ** p<0.05, * p<0.1. Industry controls not shown for brevity. Source: own calculations based on World Bank Enterprise Survey (2013).
Since these are linear estimates, the variable coefficients are the marginal effects. The marginal effects of categorical variables demonstrate the impact of whether that variable takes a 1 or a 0 as its value. For firms in Innovation countries, having licensed technology (TechLicense=1) correlates to an increase in sales of nearly 94 million LCUs v. a company that does not (TechLicense=0). As a basis of comparison, the average sales of enterprises in Innovation economies are 62 million LCUs.
The other variables are continuous, so for ForeignOwner each 1% increase in for-eign ownership correlates to an increase of 33.6 million LCUs in sales for the overall sample. The figure is only 1.2 million LCUs for firms in Innovation economies and nearly 79 million LCUs for firms in High Efficiency countries. The table includes a line for Average Sales to give a sense of magnitude. For example, the 79 million LCUs for High Efficiency represents 9.2% of the average sales of 855 million LCUs. Note that Employees are in units of one thousand, so an increase in headcount of 1.000 corre-sponds with an increase of around 2.7 billion LCUs for the overall sample.
in the “TechLicense” and “ForeignOwner” columns, respectively. The “Average Sales” col-umn displays the average annual sales by country as a basis of comparison.
Table 11. Effects by country for tech licenses on annual sales
Country (Obs.) Tech License ForeignOwner Average Sales I n n o v a t i o n
Czech Republic (36) 317* 11*** 390
H i g h E f f i c i e n c y
Russia (256) 388** 9** 255
Latvia (184) . 0.06** 4
Hungary (126) . 402** 7.114
Turkey (276) . 0.25* 11
L o w E f f i c i e n c y
Romania (194) 7* 0.12*** 8
Azerbaijan (138) 2* 0.04* 1
Belarus (242) 22.831* . 14.443
Bulgaria (140) 9*** . 5
Serbia (240) 814* 59*** 1.238
Macedonia (356) . 7*** 197
Bosnia & Herzegovina (230) 5** 0.12*** 5
Albania (240) 1.141** . 380
Mongolia (262) . 190* 4.635
Kosovo (22) 2*** . 1
F a c t o r
Moldova (366) . 1*** 31
Uzbekistan (278) . 103** 3.670
Source: own calculations based on World Bank Enterprise Survey (2013).
The Czech Republic is the only significant result in the Innovation category. TechLi-cense is positive and significant at 10% while ForeignOwner is positive and significant at 1%. Each additional percentage of foreign ownership yields 11 million LCUs more in sales, while having licensed technology correlates with 317 million LCUs in additional sales. This compares to an average of 390 million LCUs for Czech enterprises.
For High Efficiency, ForeignOwner is positive and significant at varying levels for firms in four nations while TechLicense is positive and significant at 5% for Russia. The marginal effect of technology licensing in Russia is 388 million LCUs compared to average sales of 255 million LCUs. Hungary registers the biggest marginal effect of foreign ownership, where each additional percentage of foreign ownership corresponds to an additional 402 million LCUs in sales. This is 5.6% of the average sales of 7.1 billion LCUs.
The Low Efficiency category contains ten countries registering positive, significant ef-fects from technology licensing, foreign ownership, or both. In terms of magnitude, tech-nology licensing correlates with nearly four times average sales in Albania and nearly twice average sales in Belarus. Each additional percentage of foreign ownership correlates with increases of 3% to 5% in sales revenue for Serbia, Macedonia, and Mongolia.
Uzbekistan and again the marginal effect is nearly 3%. For our initial analysis, we only find support for H4 for the Innovation category, but at the country level we have 10 nations where TechLicense is positive and significant.
For convenience, we summarise the results for the hypotheses in the table below:
Table 12. Summary of findings
Hypothesis Result
H1: The number of tax payments will correlate
negatively with obtaining a technology licence. H1 is supported. H2: The number of hours of tax preparation will
cor-relate negatively with obtaining a technology licence. H2 is supported. H3: Higher tax rates will correlate negatively with
obtaining a technology licence.
H3 is partially supported. Innovation economies have a positive correlation.
H4: Obtaining a technology licence will correlate positively with sales revenue.
H4 is partially supported. Positive correlation is ob-served for innovation economies and various countries. Source: own study.
CONCLUSIONS
In this article, we study the impact of the ease of paying taxes on technology transfer. We categorise paying taxes as a type of regulatory burden, anticipating that the greater the bur-den, the lower the likelihood of tech transfer occurring. Such transfer makes firms more competitive in the short term, and nations more competitive in the long term. The immedi-ate benefit of tech transfer should register in increased revenues for the recipient firm.
With these concepts in mind, we structure our analysis in two stages. In the first, we measure the effects of the number of tax payments, the number of hours of tax prepara-tion, and tax rates on the likelihood of obtaining a technology license from a foreign com-pany. The results for all three of these tax metrics are as expected, but the economic im-pact as captured by the marginal effects is scant. It does not seem that reducing the num-ber of tax payment, the hours of tax preparation or the tax rate itself will do much to increase the likelihood of tech licensing. An argument may be offered, based on signalling theory, that reducing any of these measures advertises the locale as business-friendly en-vironment. While this is certainly plausible and indeed all manner of political entities, from towns to entire nations, take such steps to woo investment, our current analysis of the marginal effects suggests that the impact of these improvements is underwhelming.
Concerning sales, the big story is the influence of foreign ownership. While technology li-censing does have the expected effect in Innovation economies, it does not register for the other subsamples or the overall sample. Foreign ownership, however, has both positive, sta-tistically significant correlations, as well as impressive marginal effects based upon the average sales figures in Table 9. These results recommend that both firms and policymakers pursue more foreign shareholding as a general course, but with the caveat that foreign ownership can involve particular trade-offs and hindrances across the thirty different nations in this study.
be, e.g. technical, managerial, etc., or how it interacts with the firm’s existing base of knowledge such that sales increase. Our data does not allow analysis at this level of refinement.
We anticipate that tech transfer will improve sales; naturally, firms seek better technol-ogy in order to make profits. While the effect does not register at the level of stage of devel-opment outside of Innovation, we do observe it at the national level, particularly for countries in the Low Efficiency category. Eight out of the fourteen countries in this category exhibit var-ying degrees of significance for the effect of technology licensing on sales. On the other hand, only the Czech Republic in Innovation and Russia in High Efficiency have the expected result; there are no nations in the Factor stage of development with significant outcomes for tech licensing on sales. Perhaps not as surprising, given the aforementioned observations about foreign ownership, thirteen countries across all stages of development show positive, signifi-cant correlations between foreign ownership and sales.
The question then becomes why does this disparity in number of countries across regions exist for technology licensing and sales? Here we turn to the discussion of competitiveness that began our literature review. It may be that in Innovation econo-mies, it is necessary to have technology just to exist in the market. Conditions here approximate perfect competition more than in other regions, so there is no special effect on sales from tech transfer at the national level. All that firms gain from such transfer is perhaps an increased likelihood of survival.
On the other hand, firms in Factor economies may have potential for tech transfer to drive sales, but the current impact is minimal because markets are less developed. Not only markets, but also other institutions. It may be that firms in this region cannot leverage technology into increased sales (and profits) because they are coping with a number of institutional voids (see Khanna & Palepu, 2010).
The Low Efficiency economies seem to occupy the happy “middle ground” where in-stitutions are robust enough to allow firms to glean benefits from technology licensing, yet markets are not so fierce that the financial advantages of such transfer are competed away. The differences among the stages of development as measured by per-capita GDP in Table 2 are substantial, as are the relative quality of their institutions. It is expected that higher institutional quality generally correlates with economic development (see North, 1990), but the optimal stage of such development for firms to add value from technology licensing is not known. Our analysis suggests Low Efficiency as a start.
Our work is not without limitations. We are measuring correlations; we have not es-tablished causality. Although we employ a number of control variables, we may have omit-ted one that could impact our results. This is particularly true with regard to foreign own-ership, per the above discussion. As is the case with survey data, we are gauging percep-tions, which may or may not correspond with reality. Establishing the stages of economic development as we have is plausible but there can be legitimate disagreements about the countries contained therein. Our work is also exploratory in nature. And thus our contri-butions to the literature are more empirical than theoretical in nature.
licens-ing on other outcomes, such as firm survival. A systematic review of literature on relation-ship among institutional and regulatory rules of the game in emerging economies, and strategic decision of game players will enable to develop theoretical model that will guide competitiveness literature. Future work will grapple with some of these issues.
REFERENCES
Ajitabh, A., & Momaya, K.S. (2004). Competitiveness of firms: review of theory, frameworks and models. Singapore Management Review, 26(1), 45-61.
Arulampalam, W. (1996). A note on estimated coefficients in random-effects probit models. Univer-sity of Warwick working paper. Retrieved on May 5, 2016 from http://homepages.war-wick.ac.uk/staff/Wiji.Arulampalam/papers/renote5.pdf
Aulakh, P.S., Jiang, M.S., & Pan, Y. (2010). International technology licensing: Monopoly rents, trans-action costs and exclusive rights. Journal of International Business Studies, 41(4), 587-605, doi.org/10.1057/jibs.2009.19
Baltagi, B.H., & Wu, P.X. (2009). Unequally Spaced Panel Data Regressions with AR(1) Disturbances. Econo-metric Theory, 15(6), 814-823. Retrieved on May 5, 2016 from http://www.jstor.org/stable/3533276 Baumol, W.J. (1972). On taxation and the control of externalities. The American Economic
Re-view, 62(3), 307-322.
Bowen, H., & De Clercq, D. (2008). Institutional context and the allocation of entrepreneurial effort. Journal of International Business Studies, 39(4), 747-767. Retrieved on May 5, 2016 from http://www.jstor.org/stable/25483297
Browne, C., Corrigan, G., Crotti, R., Di Battista, A., Drzeniek Hanouz, M., Galvan, C., & Sala-i-Martín, X. (2016). World Economic Forum. Retrieved on May 2, 2016 from http://reports.wefo-rum.org/global-competitiveness-report-2015-2016/what-competitiveness-is-and-why-it-matters/
Buckley, P. (Ed.) (2004). What is international business?. Basingstoke: Palgrave.
Center, I.W. (2016, May 30). Methodology. Retrieved on July 2, 2016 from http://www.imd.org/wcc/re-search-methodology/
Chen, S.F. (2005). Extending internalization theory: A new perspective on international technology transfer and its generalization. Journal of International Business Studies, 36(2), 231-245. Re-trieved on March 5, 2016 from http://www.jstor.org/stable/25483277
Collins, J.M., & Troilo, M.L. (2015). National factor effects on firm competitiveness and innovation. Competitiveness Review, 25(4), 392-409. doi.org/10.1108/CR-02-2015-0009
Czakó, E. (2003). Have competitiveness research projects brought a system paradigm shift?. Society and Economy, 25(3), 337-349.
Damijan, J., Jaklič, A., & Rojec, M. (2006) Do External Knowledge Spillovers Induce Firms Innova-tions? Evidence from Slovenia. In A.T. Tavares & A. Teixeira (Eds.), Multinationals, Clusters and Innovation. Does Public Policy Matter? (pp. 27-47). Basingstoke: Palgrave Macmillan.
Demirgüç-Kunt, A., Love, I., & Maksimovic, V., (2006). Business environment and the incorporation deci-sion. Journal of Banking and Finance, 30(11), 2967-2993. doi.org/10.1016/j.jbankfin.2006.05.007
Dess, G., Lumpkin, G.T., & Covin, J. (1997). Entrepreneurial strategy making and firm performance: Tests of contingency and configuration models. Strategic Management Journal, 8(3), 259-277.
Dunning, J. (1981). International Production and The Multinational Enterprise. London: George Allen & Unwin.
Eggertsson, T. (2009). Knowledge and the Theory of Institutional Change. Journal of Institutional Economics, 5(2), 137-150. doi.org/10.1017/S1744137409001271
Fagerberg, J. (1988). International competitiveness. The Economic Journal, 98(391), 355-374. Retrieved on March 5, 2016 from http://EconPapers.repec.org/RePEc:ecj:econjl:v:98:y:1988:i:391:p:355-74
Fan, J.P., Gillan, S.L., & Yu, X. (2013). Property rights, R&D spillovers, and corporate accounting trans-parency in China. Emerging Markets Review, 15, 34-56. doi.org/10.1016/j.ememar.2012.03.001
Guo, B. (2008). Technology acquisition channels and industry performance: An industry-level analy-sis of Chinese large and medium-size manufacturing enterprises. Research Policy, 37, 194-209.
Khanna, T., & Palepu, K.G. (2010). Winning in Emerging Markets: A Road Map for Strategy and Exe-cution. Cambridge, Mass: Harvard Business Press.
Klapper, L., Laeven, L., & Rajan, R. (2006). Entry regulation as a barrier to entrepreneurship. Journal of Financial Economics, 82(4), 591-629. doi.org/10.1016/j.jfineco.2005.09.006
Krugman, P. (1996). Pop Internationalism. New York: The MIT Press.
Lall, S. (2001). Competitiveness indices and developing countries: an economic evaluation of the global com-petitiveness report. World Development, 29(9), 1501-1525. doi.org/10.1016/S0305-750X(01)00051-1
Levie, J., & Autio, E. (2011). Regulatory burden, rule of law, and entry of strategic entrepre-neurs: an international panel study. Journal of Management Studies, 48(6), 1392-1419. doi.org/10.1111/j.1467-6486.2010.01006.x
Lopez, R.A. (2008). Foreign technology licensing, productivity, and spillovers. World Development, 36(4), 560-574. doi.org/10.1016/j.worlddev.2007.04.016
McGrattan, E.R. (1994). The macroeconomic effects of distortionary taxation. Journal of Monetary Economics, 33(3), 573-601.
Meyer, K.E., Estrin, S., Bhaumik, S.K., & Peng, M.W. (2009). Institutions, resources, and entry strate-gies in emerging economies. Strategic Management Journal, 30(1), 61-80.
Moreno, A.M. (2015). Regulation, innovation, and entrepreneurship: A review of the literature. George Washington University Regulatory Studies Center Working Paper. Retrieved on March 5, 2016 from https://regulatorystudies.columbian.gwu.edu/regulation-innovation-entrepre-neurship-review-literature
Mottner, S., & Johnson, J.P. (2000). Motivations and risks in international licensing: A review and implications for licensing to transitional and emerging economies. Journal of World Business, 35(2), 171-188. doi.org/10.1016/S1090-9516(00)00031-6
North, D. (1990). Institutions, Institutional Change and Economic Performance. Cambridge: Harvard University Press.
Peng, M.W., Wang, D.Y., & Jiang, Y. (2008). An institution-based view of international business strat-egy: A focus on emerging economies. Journal of International Business Studies, 39(5), 920-936.
Porter, M. (1990). The competitive advantage of nations. Harvard Business Review, March-April, 73-93.
Porter, M. (2005). Building the microeconomic foundations of prosperity: Findings from the business competitiveness index. World Competitiveness Report. Geneva: World Economic Forum.
Puślecki, Ł. (2010). Wpływ współpracy technologicznej krajów rozwiniętych gospodarczo na ich kon-kurencyjność międzynarodową. Toruń: Grado.
Scott, B.R. (1985). U. S. Competitiveness in the World Economy. Boston: Harvard Business School Press.
Solow, R.M. (1957). Technical change and the aggregate production function. The Review of Economics and Statistics, 312-320. Retrieved on March 5, 2016 from http://www.jstor.org/stable/1926047 Troilo, M. (2011). Legal institutions and high-growth aspiration entrepreneurship. Economic
Sys-tems, 35(2), 158-175. https://doi.org/10.1016/j.ecosys.2010.08.001
Troilo, M. (2014). Collaboration, product innovation, and sales: An empirical study of Chinese firms. Journal of Technology Management in China, 9(1), 37-55.
Woolridge, J.M. (2013). Nonlinear models: Correlated random-effects panel data models. IZA ture. Retrieved on May 13, 2016 from http://www.iza.org/conference_files/SUMS_2013/slides_2_nonlin_iza.pdf
Wood, M.S., Bylund, P., & Bradley, S. (2016). The influence of tax and regulatory policies on entre-preneurs’ opportunity evaluation decisions. Management Decisions, 54(5), 1160-1182. doi.org/10.1108/MD-10-2015-0446
World Bank (2013). Country classifications. Retrieved on March 5, 2016 from http://data.worldbank.org/news/new-country-classifications
World Bank (2013). Doing Business indicators. Retrieved on March 5, 2016 from http://www.doingbusiness.org/data
Authors
The contribution share of authors is equal and amounted to 33% each of them.
Mike Troilo
Wellspring Associate Professor of International Business, Collins College of Business School of Finance, Operations Management and International Business at University of Tulsa, USA.. He re-ceived a Ph.D. from University of Michigan, M.B.A. and M.A. from University of Virginia, and B.B.A. from College of William and Mary.
Correspondence to: Prof. Mike Troilo, University of Tulsa, Collins College of Business, The University of Tulsa, 800 South Tucker Drive, Tulsa, Oklahoma 74104, USA, e-mail: [email protected]
Michał Zdziarski
Assistant Professor of Strategic Management and International Business at Faculty of Manage-ment, University of Warsaw. He received Ph.D. in Managerial Economics, MA in American Studies and MA in Management at University of Warsaw.
Correspondence to: Dr Michał Zdziarski, University of Warsaw, Faculty of Management, ul. Sztur-mowa 1/3, 02-678 Warsaw, Poland, e-mail: [email protected]
J. Markham Collins
The Bartlett Foundation Professor of Business Finance, Coordinator of International Business Pro-grams, and faculty director of Friends of Finance. Mark received a Ph.D. in Economics, with spe-cialisation in finance, from the University of Oklahoma, and his M.A. and B.A. degrees in Econom-ics from the University of Houston.
Correspondence to: Prof. J. Markham Collins, University of Tulsa, Collins College of Business, The Uni-versity of Tulsa, 800 South Tucker Drive, Tulsa, Oklahoma 74104, USA, e-mail: [email protected]
Acknowledgementsand Financial Disclosure
The authors would like to thank the anonymous referees for their useful comments, which al-lowed to increase the value of this article.
Copyright and License
This article is published under the terms of the Creative Commons Attribution – NoDerivs (CC BY-ND 4.0) License
http://creativecommons.org/licenses/by-nd/4.0/
Published by the Centre for Strategic and International Entrepreneurship – Krakow, Poland