https://doi.org/10.5194/tc-12-3907-2018
© Author(s) 2018. This work is distributed under the Creative Commons Attribution 4.0 License.
Velocity response of Petermann Glacier, northwest Greenland,
to past and future calving events
Emily A. Hill1, G. Hilmar Gudmundsson2, J. Rachel Carr1, and Chris R. Stokes3
1School of Geography, Politics, and Sociology, Newcastle University, Newcastle upon Tyne, NE1 7RU, UK
2Department of Geography and Environmental Sciences, Northumbria University, Newcastle upon Tyne, NE1 8ST, UK 3Department of Geography, Durham University, Durham, DH1 3LE, UK
Correspondence:E. A. Hill (e.hill3@newcastle.ac.uk)
Received: 8 August 2018 – Discussion started: 20 September 2018
Revised: 23 November 2018 – Accepted: 27 November 2018 – Published: 18 December 2018
Abstract.Dynamic ice discharge from outlet glaciers across the Greenland Ice Sheet has increased since the beginning of the 21st century. Calving from floating ice tongues that buttress these outlets can accelerate ice flow and discharge of grounded ice. However, little is known about the dynamic impact of ice tongue loss in Greenland compared to ice shelf collapse in Antarctica. The rapidly flowing (∼1000 m a−1) Petermann Glacier in northwest Greenland has one of the ice sheet’s last remaining ice tongues, but it lost ∼50 %– 60 % (∼40 km in length) of this tongue via two large calving events in 2010 and 2012. The glacier showed a limited veloc-ity response to these calving events, but it is unclear how sen-sitive it is to future ice tongue loss. Here, we use an ice flow model (Úa) to assess the instantaneous velocity response of Petermann Glacier to past and future calving events. Our re-sults confirm that the glacier was dynamically insensitive to large calving events in 2010 and 2012 (<10 % annual accel-eration). We then simulate the future loss of similarly sized sections to the 2012 calving event (∼8 km long) of the ice tongue back to the grounding line. We conclude that thin, soft sections of the ice tongue>12 km away from the grounding line provide little frontal buttressing, and removing them is unlikely to significantly increase ice velocity or discharge. However, once calving removes ice within 12 km of the grounding line, loss of these thicker and stiffer sections of ice tongue could perturb stresses at the grounding line enough to substantially increase inland flow speeds (∼900 m a−1),
grounded ice discharge, and Petermann Glacier’s contribu-tion to global sea level rise.
1 Introduction
Dynamic ice discharge from marine-terminating outlet glaciers is an important component of recent mass loss from the Greenland Ice Sheet (GrIS) (van den Broeke et al., 2016; Enderlin et al., 2014). Since the 1990s, outlet glaciers in Greenland have been thinning (Pritchard et al., 2009; Krabill et al., 2000), retreating (e.g., Carr et al., 2017; Jensen et al., 2016; Moon and Joughin, 2008), and accelerating (Joughin et al., 2010; Moon et al., 2012) in response to climate–ocean forcing. Marine-terminating glaciers are influenced by ocean warming (e.g., Holland et al., 2008; Mouginot et al., 2015; Straneo and Heimbach, 2013), increased surface air tem-peratures (Moon and Joughin, 2008), and reduced sea ice concentration in the fjords (Amundson et al., 2010; Shroyer et al., 2017; Reeh et al., 2001). However, glacier response to ocean–climate forcing is highly variable among regions and among individual glaciers due to differences in glacier topog-raphy and fjord geometry (e.g., Bunce et al., 2018; Carr et al., 2013; Porter et al., 2014). Moreover, changes at the terminus of these glaciers (i.e., calving or thinning) can reduce basal and lateral resistance which alters the force balance at the ter-minus and causes inland ice flow to accelerate. Indeed, 21st century retreat at two large outlet glaciers in southeast Green-land (Helheim and Kangerlussuaq) was followed by acceler-ation and ice surface thinning (Howat et al., 2005, 2007; Nick et al., 2009).
pro-vided along the ice shelf margins (Pegler, 2016; Pegler et al., 2013; Haseloff and Sergienko, 2018). Consequently, thinning and retreat of ice shelves can reduce backstress, which can perturb the stresses at the grounding line and propagate in-creases in driving stress inland causing accelerated ice flow. Understanding how glaciers may respond to ice shelf loss is therefore important for estimating future flow speeds and, ultimately, their increased contributions to grounded ice dis-charge and global sea level rise. Considerable work has fo-cused on the role of buttressing ice shelves on grounded ice dynamics in Antarctica (e.g., Schoof, 2007; Gudmundsson et al., 2012; Goldberg et al., 2009; Reese et al., 2018b), but less work has been done on floating ice tongues in Green-land, where large calving events have recently taken place (Hill et al., 2017; Box and Decker, 2011; Rignot et al., 2001). One of the last remaining ice tongues in Greenland is at Petermann Glacier, northwest Greenland. Petermann Glacier is fast flowing (∼1000 m a−1, Fig. 1) and drains
approxi-mately 4 % of the GrIS by area (Rignot and Kanagaratnam, 2006; Hill et al., 2017). Mass loss is predominantly via high melt rates (10–50 m a−1) beneath the ice tongue (Rignot and Steffen, 2008; Wilson et al., 2017) and also occurs via large episodic calving events (Johannessen et al., 2013). Formerly the glacier terminated in a 70 km floating ice tongue, but two well-documented large calving events in 2010 and 2012 re-moved∼40 km of the tongue (Johannessen et al., 2013; Nick et al., 2012; Falkner et al., 2011; Münchow et al., 2014). Contrary to the behavior of glaciers terminating in float-ing ice elsewhere, large calvfloat-ing events at Petermann Glacier were noted to be followed by minimal glacier acceleration (<100 m a−1) (Nick et al., 2012; Münchow et al., 2014, 2016; Ahlstrøm et al., 2013), suggesting that calving from the seaward parts of the ice tongue appear to have limited impact on flow upstream of the grounding line.
Several ice tongues have been lost from neighboring glaciers in northern Greenland since the early 2000s (C. H. Ostenfeld, Zacharaie Isstrøm, Hagen Bræ; Rignot et al., 2001; Hill et al., 2017; Mouginot et al., 2015), and with Arctic air and ocean temperatures predicted to increase in a warming climate (Gregory et al., 2004), the question re-mains, at what point will Petermann Glacier lose its ice tongue and how might its complete removal impact ice dy-namics? Petermann’s tongue has been retreating from the end of the fjord (∼90 km from the present grounding line) since the beginning of the Holocene (Jakobsson et al., 2018) and currently resides at its most retreated position in recent his-tory (Jakobsson et al., 2018; Falkner et al., 2011; Hill et al., 2018). More recently (2016), another large rift formed across the ice tongue (Münchow et al., 2016), suggesting another large calving event is imminent. As Petermann Glacier is fast flowing and drains a large area of the GrIS (∼4 %), it has the potential to contribute to increased ice discharge and ul-timately sea level rise, once it becomes grounded. Here, we attempt to answer the question at what point do large calv-ing events from the Petermann ice tongue cause substantial
acceleration (i.e.,>100 m a−1that propagates inland of the grounding line) and increased ice discharge? To do this we use the community finite-element ice flow model Úa (Gud-mundsson et al., 2012) to
i. infer the stress conditions beneath the glacier catchment and along the ice tongue walls;
ii. test whether the recent small changes in velocity follow-ing calvfollow-ing events in 2010 and 2012 can be replicated; iii. assess the future response (acceleration and ice
dis-charge) of Petermann Glacier to further calving events, and eventual entire loss of the remainder of the ice tongue (Fig. 1).
First, we initialize the model using observational datasets of surface and basal topography. We then invert observed ice velocities prior to the 2010 calving event to determine the initial basal conditions (slipperiness and rheology of the ice). Finally, we perform a series of diagnostic perturbation ex-periments in which we remove sections of the Petermann Glacier ice tongue and assess the instantaneous glacier ac-celeration and increase in grounding line ice flux.
2 Methodology 2.1 Data input
To initialize our model, we used several observational datasets of glacier geometry and ice velocity. Ice surface to-pography of Petermann Glacier was taken from the Green-land Ice Sheet Mapping Project (GIMP) digital elevation model (DEM) (Howat et al., 2014). We also used this to cal-culate the surface drainage catchment, using flow-routing hy-drological analysis in MATLAB TopoToolbox (Schwanghart and Kuhn, 2010). The defined catchment is ∼85 000 km2, extends approximately 550 km inland of the grounding line, and encompasses the tributary glaciers flowing into the east side of the Petermann Glacier ice tongue (Fig. 1). Ice thick-ness and basal topography were taken from the Operation IceBridge BedMachine v3 dataset (Morlighem et al., 2017). These data were generated from radar ice thicknesses, ice motion, and the mass conservation method to resolve the basal topography and ice thickness of the GrIS (Morlighem et al., 2017). This version also includes high resolution bathymetry of Petermann Glacier fjord seaward of the ice tongue (Jakobsson et al., 2018; Morlighem et al., 2017). All three topographic datasets have a resolution of 150 m and a nominal date of 2007, which precedes the large calving event in 2010.
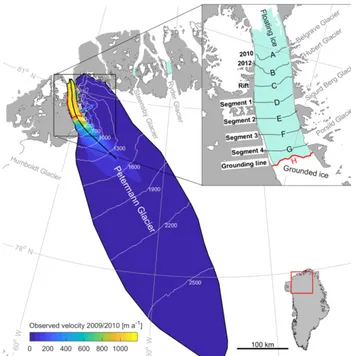
Figure 1.Study location, Petermann Glacier, northwest Greenland. Observed ice speeds from the MEaSUREs program (winter 2009/2010, Joughin et al., 2010) across the Petermann Glacier catchment, which corresponds with our model domain. White lines show 300 m ice surface contours across the catchment. The thick black line is the glacier centerline and the thick red line is the glacier grounding line. Inset shows the location of newly prescribed terminus positions for each diagnostic perturbation experiment (A–H). Light turquoise shows floating ice, and white is grounded ice.
has a resolution of 500 m, and an average error of 8 m a−1
across the entire Petermann catchment, which increases to 18 m a−1along the floating ice tongue (Table 1). To validate our modeled velocity changes in response to calving events in both 2010 and 2012, we required observed velocities from the years preceding and succeeding these events. Velocities from winter 2009/2010 (used for inversion) also acted as our baseline velocities that we compared with observed ve-locities after each calving event. However, Greenland-wide velocities for the winter following the 2010 calving event (2010/2011) were not readily available. Instead, a series of datasets exist that cover select regions of the ice sheet, de-rived from feature or intensity tracking of optical Landsat imagery (Howat, 2017; Rosenau et al., 2015) or synthetic aperture radar (SAR) imagery (Joughin et al., 2010). We do not use optical Landsat 7 ETM+derived velocities because their coverage is restricted to midsummer, which may reflect
seasonal speedups rather than the interannual impact of large calving events on ice velocity. Additionally, Landsat-derived velocities may have errors associated with cloud cover and/or the scanning line correction image banding from May 2003 onwards. Instead, we used a combination of SAR-derived ve-locities (TSX and PALSAR), which are not limited to the summer months and benefit from higher resolution, and more frequent repeat pass imagery (Table 1). High-resolution TSX imagery (100 m) was acquired from the MEaSUREs program (Joughin et al., 2010), but is limited to 11–45 km inland of the grounding line at Petermann Glacier. To supplement this we also used PALSAR-derived velocities (Table 1; Nagler et al., 2016), which provided additional coverage along the west-ern half of the floating ice tongue. Average errors across the catchment are 4 and 16 m a−1for TSX and PALSAR,
2012 calving event) velocities were also acquired from the MEaSUREs program (Table 1; Joughin et al., 2010).
To determine observed velocity change, we differenced velocity fields after each calving event (2010/2011 and 2012/2013) from initial baseline velocities (2009/2010) (Fig. S1 in the Supplement). For 2009/2010 to 2010/2011 speedup along the ice tongue averaged 29 m a−1, but further inland of the grounding line, noisy and unphysical veloc-ity differences (Fig. S1) indicate that there was no coherent velocity change, and it is unlikely velocity changes propa-gated far inland. For clarity we present centerline velocity profiles in Fig. 2, which show that increases in speed were limited to the lower portions of the ice tongue. Observed velocity estimates presented here after the calving event in 2010 are within the range of previous studies, which showed a 30–125 m a−1speed increase along the ice tongue (Johan-nessen et al., 2013; Nick et al., 2012; Münchow et al., 2016) and limited change further inland (Nick et al., 2012). Af-ter the calving event in 2012, velocity increases averaged 79 m a−1along the ice tongue and propagated further towards the grounding line (Figs. 2 and S2).
2.2 Model initialization
To model the response of Petermann Glacier to ice tongue loss we used the finite-element model Úa (Gudmundsson et al., 2012). Úa solves equations of ice dynamics using the shallow ice-stream approximation (SSA) (Macayeal, 1989; Morland, 1987), a Weertman sliding law, and Glen’s flow law. The momentum equation of the vertically integrated SSA can be written in the form
∇xy·(hT) −τbh=ρigh∇xys+ 1 2gh
2∇
xyρi, (1)
where
∇xy=(∂x, ∂y)T, (2)
andTis the resistive stress tensor defined as T=
2τxx+τyy τxy
τxy τxx+2τyy
. (3)
In the above equationsis the surface topography,his the ice thickness, pi is vertically averaged ice density,gis the gravitational acceleration, and τbh is the horizontal part of the bed-tangential basal tractionτb.
Úa has been previously used to understand glacier behav-ior following ice shelf loss in Antarctica (De Rydt et al., 2015) and ice tongue collapse at the Northeast Greenland Ice Stream (Rathmann et al., 2017). It has also been used to assess the impact of buttressing ice shelves around Antarc-tica (Reese et al., 2018a). Previous modeling studies at Peter-mann Glacier have been conducted using a one-dimensional flow line approach (Nick et al., 2012). Here we aim to expand on earlier work at Petermann to assess if Úa, a
two-horizontal-dimensional vertically integrated approach, can also replicate the observed velocity response to calving events in 2010 and 2012 and then be used to estimate the im-pact of future calving events on ice flow and discharge. This model is advantageous over a flow line approach, as it al-lows us to account for stresses in both horizontal dimensions, which can better assess the impact of ice shelf changes on the force balance at the glacier grounding line (Gudmundsson, 2013).
To set up the model, we used the surface velocity catch-ment (Fig. 1) as the outer computational boundary and im-posed Dirichlet (essential) boundary conditions by fixing ve-locities to zero inland of the ice divide. Nunataks and rock outcrops along the east side of the ice tongue were digi-tized using Landsat 8 imagery and treated as holes within the mesh. Ice velocities along the nunataks’ boundaries were set to zero, i.e., a no-slip boundary condition. Initially, it was less clear what type of boundary condition to impose along the margins of the ice shelf where it is in contact with the side walls. We began by imposing a free-slip boundary condi-tion along the ice tongue margins but conducted further runs with no-slip boundary conditions along the side walls to de-termine which boundary conditions were most appropriate (see Sect. 2.4).
The initial calving front boundary was the location of the terminus in 2009, digitized from Landsat 7 ETM+ im-agery, and in all cases a Neumann (natural) boundary con-dition was imposed along the terminus. Using this com-putational domain, and the finite element mesh generator Gmsh (Geuzaine and Remacle, 2009), we generated a high-resolution mesh, with 58 000 linear (three-node) elements, and∼30 000 nodes (Fig. S3). The unstructured mesh ca-pabilities of Úa allowed us to refine the mesh based on the observed velocity field. Where ice speeds are fastest (>500 m a−1), primarily along the ice tongue, element sizes are 0.75 km, whereas element sizes inland have a maximum size of 2.7 km. Overall the mean element size is 1.52 km, with a median of 1.4 km. We also increased the mesh reso-lution of the slower-flowing (<500 m a−1) tributary glaciers to the east of the Petermann Glacier ice tongue to 0.75 km. Topographic datasets (surface, bed, and ice thickness) and ice velocities observed before the calving (winter 2009/2010) were mapped onto this mesh using linear interpolation. 2.3 Model inversion
Table 1.Velocity data sources for Petermann Glacier.
Dataset Year Sensor(s) Resolution Catchment Use
(m) error (m)
MEaSUREs Greenland wide winter velocity 2009/2010 ALOS 500 8 m a−1 Model inversion
NSIDC (Joughin et al., 2010) TerraSAR-X Baseline initial velocities
MEaSUREs Greenland Ice Velocity: Selected
Selected Glacier Site Velocity Maps from 2010/2011 TerraSAR-X 100 4 m a−1 Validate modeled change
NSIDC (Joughin et al., 2010) after 2010 calving
ESA Greenland Ice Sheet CCI project 2010/2011 PALSAR 500 16 m a−1 Validate modeled change
IV Greenland margin winter velocities after 2010 calving
(Nagler et al., 2016)
MEaSUREs Greenland wide winter velocity 2012/2013 RADARSAT-1 500 3 m a−1 Validate modeled change
NSIDC (Joughin et al., 2010) TerraSAR-X after 2012 calving
TanDEM-X
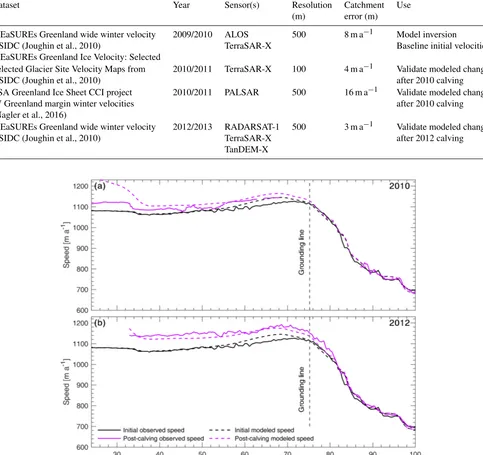
Figure 2.Observed and modeled velocities along the Petermann Glacier centerline before and after calving events in 2010(a)and 2012(b). Observed initial speed (MEaSUREs InSAR winter 2009/2010) is shown with a solid black line. Observed post-calving speeds after the 2010 calving event (PALSAR and TerraSAR-X winter 2010/2011) and the 2012 calving event (MEaSUREs InSAR winter 2012/2013) are shown with solid purple lines. Modeled initial speeds are shown in dashed black, and speeds after each respective modeled calving event are shown in dashed purple. Note the small change in both observed and modeled velocities, particularly inland of the grounding line.
function with respect toAandC are determined in a com-putationally efficient way using the adjoint method. Here we used Tikhonov regularization involving both amplitude and spatial gradients of Aand C. Values of regularization pa-rameters were varied by orders of magnitude between 1 and 10 000 and then within range. We also experimented with dif-ferent sliding law exponent values ofm(1,2,3,4,5,7,9) and
found the results of our diagnostic experiments to be insen-sitive to the value ofm(Fig. S3). We set the stress exponent in Glen’s flow law ton=3.
section we discuss two additional inversion experiments in which we varied the boundary conditions along the ice tongue. The model was inverted until the misfit converged, which was after 120 iterations. Resultant model velocities (Umod) are in good agreement with observations (Uobs) as
shown in Fig. 3. The mean percentage difference between observed and modeled velocities is 26 %, which equates to an absolute difference of 11 m a−1(Table 2). Absolute mean velocity difference increases to 28 m a−1 in areas flowing faster than 300 m a−1and to 66 m a−1along the floating ice tongue, which is only 7 % of the average ice tongue speed (967 m a−1). Flow velocities are not well resolved along the far northeastern tributary glacier, which is due to small ice thicknesses and poorly resolved bed topography from inter-polation (errors of∼150 m).
By inverting the known velocity field (winter 2009/10), we can infer the basal conditions beneath Petermann Glacier. To our knowledge, a catchment-scale assessment of the basal slipperiness and ice stiffness has not been previously docu-mented for this region. Some studies have examined the basal thermal state (MacGregor et al., 2016; Chu et al., 2018) or provided Greenland-wide slipperiness estimates (Lee et al., 2015). However, aside from these, little is known on the stress conditions of Petermann Glacier. Here, we provide a new record of the basal conditions beneath Petermann Glacier, which are important for understanding dynamic glacier behavior. For our initial inversion, the distribution of basal slipperiness (C), ice rate factor (A), and the misfit be-tween observed and modeled velocities are shown in the first line of Fig. 4. Basal slipperiness was on average 2 orders of magnitude greater within 10 km of the grounding line (C≈ 7.2×10⁻²m a−1kPa−3) than the rest of the grounded glacier
catchment (mean C≈1.47×10⁻⁴m a−1kPa−3, Fig. 4).
Grounded ice across the Petermann catchment is on aver-age stiffer (A≈1.2×10⁻⁸a−1kPa−3) than along the ice tongue (A≈7.4×10⁻⁸a−1kPa−3). However, the misfit be-tween observed and modeled velocities is highest along the ice tongue (Fig. 4g), which suggests that the ice rheology pa-rameter (A) may not reflect the true stress conditions along the ice tongue. The distribution of basal slipperiness and the ice rheology parameter (A) for our initial inversion are dis-cussed in more detail in the following section.
2.4 Boundary conditions
In an attempt to improve the misfit between observed and modeled velocities, and accurately replicate the lateral resis-tive stresses along the ice tongue margins, we conducted runs with both no-slip and free-slip boundary conditions along the side walls. We then tested which produced the best fit to ob-served velocities. Alongside our additional inversion (Sce-nario 1), in which no velocity condition was imposed along the ice tongue margins, we inverted the model using two fur-ther sets of boundary conditions. These are Scenario 2 with fixed velocities along the western margin of the ice tongue to
zero (no-slip) and the east margin left as free-slip and Sce-nario 3 with velocities fixed to zero (no-slip) along both mar-gins of the floating ice tongue. We then based our assessment of these boundary condition scenarios on three criteria: (i) the misfit between observed and modeled velocities, (ii) obser-vations of the confinement and attachment of the ice tongue to the fjord walls in satellite imagery (i.e., heavy rifting or not), (iii) the ability of each set of boundary conditions to replicate the observed velocity response following the 2010 calving event. The first two criteria are discussed in this sec-tion, and the third criterion is discussed alongside our model experiments in the following section (Sect. 2.5). As before, we perform each inversion for 120 iterations until the misfit has converged, and we use the same values ofm,n, and regu-larization parameters for each scenario. The slipperiness (C), ice rate factor (A), and misfit distributions (|Uobs| − |Umod|) are shown for each boundary condition scenario in Fig. 4. Mean misfits between observed and modeled velocities for each scenario are in Table 2.
Slipperiness values showed a similar spatial distribution across all boundary condition scenarios, i.e., increasing to-wards the grounding line and decreasing further inland (Fig. 4a–c), and do not vary substantially within 10 km of the grounding line (range of(3.8–7.2)×10−2m a−1kPa−3) or across the entire grounded catchment (range of(1.47–2.18)× 10−4m a−1kPa−3). In contrast, spatial variations in ice stiff-ness (A) were more obvious between each scenario, which corresponds to differences in the misfit distributions (Fig. 4). AverageAvalues along the ice tongue varied by 3 orders of magnitude between Scenarios 1 (A≈7.4×10⁻⁸a−1kPa−3) and 3 (A≈1.4×10⁻⁵a−1kPa−3). Scenarios 1 and 2 show stiff ice across the entire ice tongue, which does not reflect the stiff ice tongue center and weaker margins we would ex-pect from lateral reductions in longitudinal strain rates and ice velocity associated with shearing along the fjord walls (Raymond, 1996). In both cases, velocities do not reproduce observations along the lateral margins and lower portion of the ice tongue well (criterion i, Fig. 4g–h).
Figure 3. Observed (Uobs) winter velocities 2009/10(a)in the proximity of the grounding line.(b) Modeled (Umod) velocities. Panel
(c)shows a normalized bivariate histogram of the velocity residuals, which are the difference between modeled and observed velocities in the vicinity of the grounding line (magenta).1u=umod−uobsand1v=vmod−vobs.uandvarexandycomponents of the velocity vectors, respectively.
Table 2.Misfit between observed and modeled velocity for each boundary condition scenario.
Mean Mean Mean Mean
percentage velocity velocity velocity Boundary condition scenario difference difference difference difference (%) (m a−1) (>300 m a−1) ice tongue (m a−1)
(1) Natural ice tongue boundary 26 11 28 66
(2) Fixed west ice tongue margin to zero 24 12 34 77
(3) Fixed both ice tongue margins to zero 20 9.4 25 51
(criterion ii) and the best model fit to observed velocities (cri-terion i). These experiments have shown the importance of considering boundary conditions, particularly along floating ice margins in this study, for accurately determining lateral resistive stresses and replicating the observed velocity field. 2.5 Model experiments
Following model initialization and inversion, we performed a series of diagnostic experiments (Fig. 1) that perturb the calv-ing front position to replicate previous large calvcalv-ing events and potential future loss from the Petermann Glacier ice tongue. We then examine the instantaneous velocity change with respect to our initial modeled velocities. As the focus of this paper is the impact of large calving events on glacier ve-locity, we do not incorporate ice loss via surface and/or basal melting. For each perturbation experiment, we removed all elements from the mesh downstream of the new calving front position and mapped all topographic datasets onto the new mesh. We then performed a forward-diagnostic model run, which solves the shallow ice stream equations (see Eq. 1) independent of time. In each case, the model is restarted
from the previous experiment setup. During all experiments, grounding line position, boundary conditions, and ice thick-ness remained fixed. We also use our initially inverted param-eters of basal slipperiness and ice rheology as inputs to all ex-periments. We acknowledge that in reality there is likely to be a period of relaxation and geometric adjustment after each in-dividual calving event. Thus, by performing these sequential calving experiments in a diagnostic time-independent mode, we are modeling the immediate velocity change in response to a perturbation in buttressing at the terminus. We therefore do not allow any relaxation, adjustment, or deviation from our initial stress conditions (slipperiness or rheology) in be-tween subsequent events. It is therefore possible that these estimates of ice flow and discharge may be higher than the transient glacier response over longer timescales.
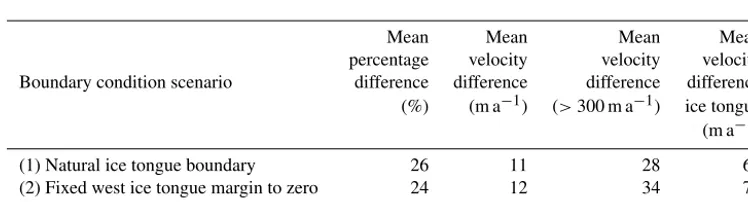
Figure 4.Inversion experiments using three sets of boundary conditions along the floating ice tongue. Panels(a)–(c)show logarithmically calculated basal slipperiness (C) for boundary condition Scenarios 1 to 3, respectively, in which orange represents highly slippery areas. Glen’s flow law rate factorA(d–f), for which light blue represents soft ice, and brown is stiff ice. The final column(g–i)is the absolute difference between observed (Uobs) and modeled velocities (Umod) after inversion using each set of boundary conditions.
assumptions: (i) Petermann Glacier will continue to calve episodically, via rift propagation, back to the grounding line and (ii) future icebergs will be sized similarly to previous calving events (∼8 km long, Fig. 1). Each segment along the ice tongue acted as the new prescribed terminus position, which has a natural boundary condition. In reality, the size and nature of future calving events may vary (e.g., may be a series of small icebergs), but we conduct these experiments to assess the impact of future events similar in magnitude to previous calving. After each diagnostic experiment we cal-culated the vertically and horizontally integrated flux across the grounding line in gigatonnes per year with respect to
pre-calving flux. We then convert to sea level equivalent (mm) by dividing by the volume of ice needed to raise global sea levels by 1 mm (361.8 Gt).
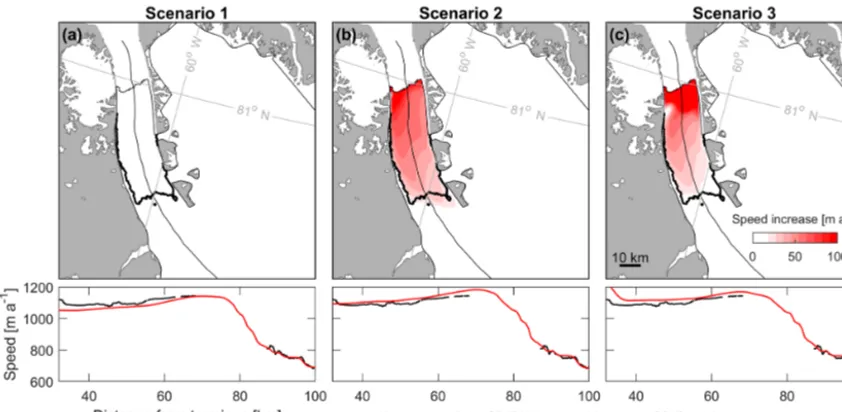
calv-ing, using different sets of boundary conditions, were rela-tively small. Hence, our results are insensitive to the type of boundary condition applied (see also Sect. 2.4). This in-sensitivity to the type of side-wall boundary conditions can be understood to be related to our inverse methodology (see Sect. 2.3), in whichAis inferred from measured velocities. In all cases the inversion was able to converge and provide a good fit to observations. Despite this, applying no resis-tance along the ice tongue margins (Scenario 1, free slip) produces no change in velocity along the tongue, which does not reflect observations (Figs. 2 and S1). However, when ap-plying no-slip side-wall boundary conditions, modeled speed increases along the ice tongue (Scenarios 2 and 3) produced a better fit to observed changes, i.e., acceleration at the ter-minus that did not propagate far inland, and average 45 and 37 m a−1, respectively. While both Scenarios 2 and 3 appear to adequately reproduce the observed velocity response af-ter the 2010 calving event, we discount Scenario 2 due to the high misfit between modeled and observed velocities (Ta-ble 2) and unrealistic ice stiffness along the tongue (Fig. 4). Thus, boundary conditions and parameters of basal slipperi-ness (C) and ice rate factor (A) calculated in Scenario 3 are input into our subsequent diagnostic experiments after 2010.
3 Results
3.1 Response to 2010 and 2012 calving
We have shown that the two-horizontal-dimensional model Úa can reproduce the flow of Petermann Glacier before the large calving event in 2010. Following this we removed sec-tions of the ice tongue to replicate large calving events in 2010 and 2012, and we compare the model results with ob-served changes in flow speeds (Fig. 6a and b).
The iceberg that calved away from Petermann Glacier in 2010 was∼214 km2and on average 83 m thick (Fig. 6). In-verted ice rate factorAreveals that this section of the tongue is softer (A≈2.1×10⁻⁵a−1kPa−3) by 3 orders of magni-tude than the rest of the ice tongue (Fig. 7b) or grounded glacier catchment (A≈1.2×10⁻⁸a−1kPa−3). Model results show that removing this section of the tongue was followed by a slight instantaneous increase in speed, ranging from ∼65 m a−1(6 % increase in tongue speed) at the terminus to <20 m a−1 between 60 and 80 km along the centerline (Fig. 6a). These modeled velocity changes are in very good agreement with observed velocities presented here (Fig. 2) and documented in previous studies (Nick et al., 2012; Mün-chow et al., 2016). After the 2010 calving event, increases in speed across the entire ice tongue averaged 29 and 37 m a−1 in observed and modeled velocities, respectively (Fig. 2). Modeled perturbations in flow speeds did not propagate far inland and averaged only +6 m a−1 inland of the ground-ing line, which is below the average misfit between observed and modeled velocities (9.4 m a−1, Table 2) and therefore
in-distinguishable from errors. Prior to the calving event, our modeled grounding line flux of 10.12 Gt a−1was within the
range of previous estimates by Rignot and Steffen (2008) (12±1 Gt a−1) and Wilson et al. (2017) (10.8±0.52 Gt a−1). Limited changes in speed following the 2010 calving event were accompanied by little change in modeled grounding line flux (+0.14 Gt a−1) and a negligible increase in sea level rise contribution (Fig. 7b).
In the next experiment, we removed a 96 km2section of the ice tongue to replicate a subsequent large calving event in July 2012. Importantly this calving event removed a thicker section of the ice tongue that averaged 111 m (Fig. 7a). Sim-ilar to the modeled dynamic response after 2010, ice flow speeds increased along the ice tongue after the 2012 calv-ing event and did not propagate far inland of the ground-ing line (Fig. 6b). These modeled velocity changes are con-sistent with observed velocities in 2012/2013 (Figs. 2 and S2). Both modeled and observed speeds increased within the range of 3 %–5 % at the terminus and showed limited change inland of the grounding line (Fig. 2). The 2012 calv-ing event was<50 % of the 2010 iceberg area and almost 4 times softer (A≈9.7×10⁻⁵a−1kPa−3), suggesting it should provide less resistive stress. However, speed increases were 46 % greater along the ice tongue than in 2010 (averaging 59 m a−1) and propagated further towards the grounding line. Despite some acceleration, the 2012 calving event had a lim-ited impact on grounding line flux, increasing it by only 0.35 Gt a−1(3.4 %) compared to initial ice flux and increas-ing sea level rise contribution to 0.029 mm a−1(Fig. 7b). 3.2 Response to future calving events
Calving events in 2010 and 2012 had a limited dynamic im-pact on the ice flow of Petermann Glacier and were followed by<10 % acceleration along the ice tongue and<2 % at the grounding line (Fig. 2). These modeled findings are con-sistent with observed velocity change (Fig. 2) and previous modeling of the 2010 calving event (Nick et al., 2012). Af-ter accurately replicating the observed velocity response to large calving events in 2010 and 2012, we were confident in the model’s ability to estimate the instantaneous velocity re-sponse of Petermann Glacier to a change in stress conditions at the grounding line associated with removing large sections of the ice tongue.
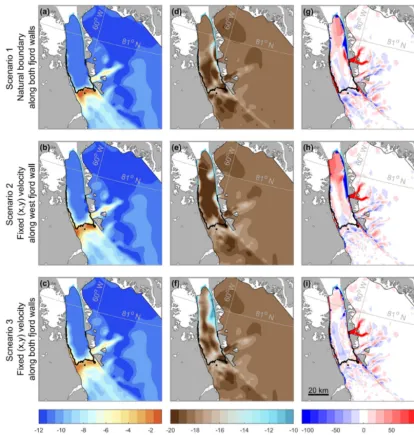
Figure 5.Diagnostic perturbation experiments for the 2010 calving event, using three scenarios of boundary conditions applied along the floating ice tongue(a–c). Graduated white to red shows speed increase between initial modeled velocities (Uinitial) and modeled velocities after the 2010 calving (Ucalving). Bottom plots show observed velocities (Uobs) after calving (winter 2010/2011) and modeled velocities (Umod) after the 2010 calving along the glacier centerline.
in 2010 and 2012 (Fig. 7b). In this case, average increases in speed along the ice tongue were greater (94 m a−1) and propagated further (∼30 km from the terminus) towards the grounding line than after previous calving events (Fig. 6). Acceleration 10 km inland of the grounding line more than doubled to 24 m a−1compared to acceleration after the 2012 calving event (10 m a−1). Despite this, acceleration inland of the grounding line remained 75 % smaller than increases along the ice tongue (Fig. 7c) and did not propagate far into the glacier catchment (Fig. 6c). After this experiment grounding line flux increased to 11 Gt a−1 (+0.87 Gt a−1)
and sea level equivalent rose to 0.03 mm a−1(Fig. 7b). Over the subsequent diagnostic calving experiments (D– H), there was a linear increase in average speed change across the ice tongue, as well as a near doubling of aver-age speed increases immediately inland of the grounding line (within 10 km) between each experiment (Fig. 7). Af-ter removing the 164 m thick section D from the tongue, average ice tongue speeds increased by 21 % compared to initial velocities (∼954 m a−1), but increases inland of the grounding line (within 10 km) remained small in compari-son (∼ +57 m a−1). During the following three experiments (E–G), instantaneous average velocity increases across the tongue were more substantial than after previous calving events ranging from 304 m a−1after removing segment E to
increasing by+1000 m a−1(>100 % of initial flow speeds)
across the small remaining section of the ice tongue af-ter experiment G. Throughout these experiments, higher-magnitude increases in speed propagated further into the catchment (∼10–15 km inland of the grounding line) than after previous calving events (Fig. 6). Simultaneous to
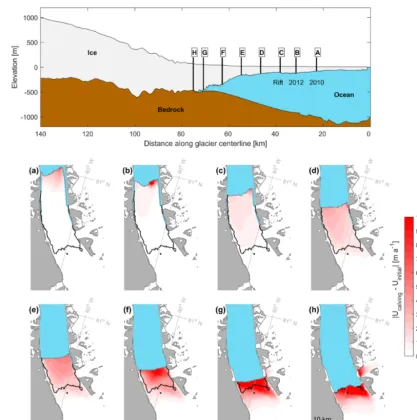
in-creases along the ice tongue, average speed inin-creases inland of the grounding line (10 km) went from 103 m a−1 (experi-ment E) to 453 m a−1(experiment G, Fig. 7). Once the last remaining section of the ice tongue was removed (54 km2, H), speed increases were double those of experiment G, reaching +900 m a−1 immediately inland of the grounding line (10 km). Removing the entire ice tongue, and conse-quently detaching it from any tributary glaciers, also led to a∼530 m a−1 speed up at the terminus of Porsild Glacier (Fig. 6h).
Figure 6.Diagnostic perturbation experiments at Petermann Glacier. The top panel shows a cross-sectional centerline profile of Petermann Glacier from the BedMachine v3 dataset (Morlighem et al., 2017). Letters A to H represent the points along the glacier centerline at which sections of the terminus were removed for each experiment. A is the 2010 calving event, B is the 2012 calving event, and C is the location of a large rift that formed in 2016. D to G are successive 8 km splices and H is the current grounding line location. Panels(a)–(h)show the modeled instantaneous increase in speed after each experiment with respect to initial pre-calving (before 2010) speeds.
4 Discussion and conclusions
Here, we expand on previous work and provide new insight into the velocity response of Petermann Glacier to past and future large calving events and eventual ice tongue collapse. In contrast to the removal of buttressing ice shelves else-where in Greenland (e.g., Jakobshavn Isbræ, Joughin et al., 2008; Zacharaie Isstrøm, Mouginot et al., 2015) and from the Antarctic Peninsula (e.g., Larsen B, De Rydt et al., 2015; Scambos et al., 2004), we show that Petermann Glacier was dynamically insensitive to the removal of∼310 km2 of the ice tongue via calving events in 2010 and 2012 (Fig. 6). After both calving events there was a limited increase in
speed (<10 % of initial flow speeds, Fig. 2) that remained below the∼22 %–25 % seasonal variability in flow speeds observed between 2006 and 2017 (Nick et al., 2012; Lemos et al., 2018). This insensitivity of ice velocities to large calv-ing events can be explained by weak resistance provided by the lower portion of the ice tongue along its lateral margins (Fig. 4f; Nick et al., 2012). From this, we can conclude that the section of the ice tongue that calved away in 2010 and 2012 provided little frontal buttressing on grounded ice.
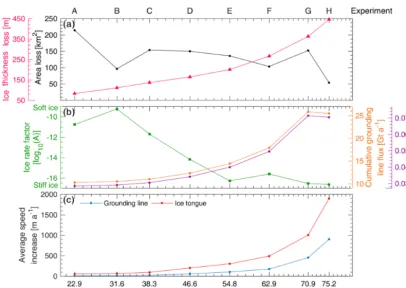
Figure 7.Modeled experiment parameters for Petermann Glacier, for each diagnostic experiment (A–H), also shown in Fig. 6.(a)The black line shows iceberg area lost between each experiment (km2) and magenta is the average ice thickness (m) of each section of ice removed.
(b)Green is the average ice rate factor (log10A) across the section of ice removed in each diagnostic experiment. Orange and purple lines represent the cumulative grounding line flux with respect to an initial ice flux of 10.12 Gt a−1and sea level equivalent contribution after the removal of each section of ice.(c)Average increases in ice speed across the entire ice tongue (red) and average ice speed within 10 km inland of the grounding line (blue) after each diagnostic experiment.
retreat from the fjord mouth (Jakobsson et al., 2018), it is possible that the ice tongue will continue to calve episod-ically and in the not-too-distant future collapse entirely. We set out to determine at what point future calving events at Pe-termann Glacier (similar in magnitude to past calving) will cause substantial acceleration and increased ice discharge. The key conclusion of this work is that future calving events (C–E) from the lower portions of the ice tongue (>12 km from the grounding line) appear to be passive. We attribute the small modeled velocity response (<100 m a−1increase at the grounding line) to calving events from this lower por-tion of the tongue to be due to ice that is thinner (<200 m) and an order of magnitude softer, which provides limited but-tressing on grounded ice. Indeed, if the next calving event takes the path of the 2016 rift formation, it is unlikely to substantially accelerate ice flow (Fig. 6c) or increase the glacier contribution to grounded ice discharge and sea level rise (Fig. 7). However, we find that removing sections of the ice tongue within 12 km of the grounding line (F–H) has a larger impact on ice flow speeds, increasing them by an av-erage of 900 m a−1 (96 %) after the entire ice tongue is re-moved (Fig. 6h). Alongside this, cumulative ice flux across
end of the fjord (Jakobsson et al., 2018), it may be that the current ice tongue has allowed grounding line stability, and its collapse will similarly lead to unstable grounding line re-treat. Indeed, the eastern portion of the current grounding line lies within a deep bedrock canyon (Bamber et al., 2013; Morlighem et al., 2017), which may allow for marine ice sheet instability. However, we cannot discount the possibil-ity that an ice tongue may regrow in the future (Nick et al., 2012). Here, we have estimated the instantaneous response of Petermann Glacier’s ice flow to the immediate removal of sections of the ice tongue. Importantly, future work in-corporating the transient evolution of the glacier geometry and grounding line position in between these large calving events is needed to assess the long-term response of Peter-mann Glacier to future ice tongue loss.
Data availability. The data and code used in this study are available on request to the lead author.
Supplement. The supplement related to this article is available online at: https://doi.org/10.5194/tc-12-3907-2018-supplement.
Author contributions. This work was carried out by EAH with in-put from all authors. EAH led the paper writing, and all authors contributed to editing the paper.
Competing interests. The authors declare that they have no conflict of interest.
Acknowledgements. We acknowledge several freely available datasets used in this work. These are the IceBridge BedMachine v3 (Morlighem et al., 2017) and MEaSUREs InSAR ice velocities (Joughin et al., 2010) both from the National Snow and Ice Data Center (NSIDC), and PALSAR derived velocities from the ESA Greenland Ice Sheet Climate Change Initiative (Nagler et al., 2015). This work was supported by a doctoral studentship award to Emily A. Hill at Newcastle University, UK, from the IAPETUS Natural Environment Research Council Doctoral Training Partnership (grant number NE/L002590/1). Emily A. Hill was also additionally supported by a CASE partnership from the British Antarctic Survey. We thank Ellyn Enderlin and the one anonymous reviewer for their helpful comments on the paper.
Edited by: Olaf Eisen
Reviewed by: Ellyn Enderlin and one anonymous referee
References
Ahlstrøm, A. P., Andersen, S. B., Andersen, M. L., Machguth, H., Nick, F. M., Joughin, I., Reijmer, C. H., van de Wal, R. S. W., Merryman Boncori, J. P., Box, J. E., Citterio, M., van As, D.,
Fausto, R. S., and Hubbard, A.: Seasonal velocities of eight ma-jor marine-terminating outlet glaciers of the Greenland ice sheet from continuous in situ GPS instruments, Earth Syst. Sci. Data, 5, 277–287, https://doi.org/10.5194/essd-5-277-2013, 2013. Amundson, J. M., Fahnestock, M., Truffer, M., Brown, J., Lüthi,
M. P., and Motyka, R. J.: Ice mélange dynamics and implications for terminus stability, Jakobshavn Isbrse, Greenland, J. Geophys. Res.-Earth, 115, 1–12, https://doi.org/10.1029/2009JF001405, 2010.
Bamber, J. L., Griggs, J. A., Hurkmans, R. T. W. L., Dowdeswell, J. A., Gogineni, S. P., Howat, I., Mouginot, J., Paden, J., Palmer, S., Rignot, E., and Steinhage, D.: A new bed el-evation dataset for Greenland, The Cryosphere, 7, 499–510, https://doi.org/10.5194/tc-7-499-2013, 2013.
Box, J. E. and Decker, D. T.: Greenland marine-terminating glacier area changes: 2000–2010, Ann. Glaciol., 52, 91–98, https://doi.org/10.3189/172756411799096312, 2011.
Bunce, C., Carr, J. R., Nienow, P. W., Ross, N., and Killick, R.: Ice front change of marine-terminating outlet glaciers in northwest and southeast Greenland during the 21st century, J. Glaciol., 64, 523–535, https://doi.org/10.1017/jog.2018.44, 2018.
Carr, J. R., Vieli, A., and Stokes, C.: Influence of sea ice decline, atmospheric warming, and glacier width on marine-terminating outlet glacier behavior in northwest Greenland at seasonal to in-terannual timescales, J. Geophys. Res.-Earth, 118, 1210–1226, https://doi.org/10.1002/jgrf.20088, 2013.
Carr, J. R., Stokes, C. R., and Vieli, A.: Threefold in-crease in marine-terminating outlet glacier retreat rates across the Atlantic Arctic: 1992–2010, Ann. Glaciol., 58, 72–91, https://doi.org/10.1017/aog.2017.3, 2017.
Chu, W., Schroeder, D. M., Seroussi, H., Creyts, T. T., and Bell, R. E.: Complex Basal Thermal Transition Near the Onset of Pe-termann Glacier, Greenland, J. Geophys. Res.-Earth, 123, 985– 995, https://doi.org/10.1029/2017JF004561, 2018.
De Rydt, J., Gudmundsson, G. H., Rott, H., and Bamber, J. L.: Mod-eling the instantaneous response of glaciers after the collapse of the Larsen B Ice Shelf, Geophys. Res. Lett., 42, 5355–5363, https://doi.org/10.1002/2015GL064355, 2015.
Enderlin, E. M., Howat, I. M., Jeong, S., Noh, M. J., Van Angelen, J. H., and Van Den Broeke, M. R.: An improved mass budget for the Greenland ice sheet, Geophys. Res. Lett., 41, 866–872, https://doi.org/10.1002/2013GL059010, 2014.
Falkner, K. K., Melling, H., Mnchow, A. M., Box, J. E., Wohlleben, T., Johnson, H. L., Gudmandsen, P., Samelson, R., Copland, L., Steffen, K., Rignot, E., and Higgins, A. K.: Context for the re-cent massive petermann glacier calving event, Eos, 92, 117–118, https://doi.org/10.1029/2011EO140001, 2011.
Geuzaine, C. and Remacle, J. F.: Gmsh: A 3-D finite ele-ment mesh generator with built-in pre- and post-processing facilities, Int. J. Numer. Meth. Eng., 79, 1309–1331, https://doi.org/10.1002/nme.2579, 2009.
Goldberg, D., Holland, D. M., and Schoof, C.: Ground-ing line movement and ice shelf buttressing in ma-rine ice sheets, J. Geophys. Res.-Earth, 114, F04026, https://doi.org/10.1029/2008JF001227, 2009.
Gudmundsson, G. H.: Ice-shelf buttressing and the stabil-ity of marine ice sheets, The Cryosphere, 7, 647–655, https://doi.org/10.5194/tc-7-647-2013, 2013.
Gudmundsson, G. H., Krug, J., Durand, G., Favier, L., and Gagliar-dini, O.: The stability of grounding lines on retrograde slopes, The Cryosphere, 6, 1497–1505, https://doi.org/10.5194/tc-6-1497-2012, 2012.
Haseloff, M. and Sergienko, O. V.: The effect of buttress-ing on groundbuttress-ing line dynamics, J. Glaciol., 64, 1–15, https://doi.org/10.1017/jog.2018.30, 2018.
Hill, E. A., Carr, J. R., and Stokes, C. R.: A Review of Recent Changes in Major Marine-Terminating Outlet Glaciers in Northern Greenland, Front. Earth Sci., 4, 1–23, https://doi.org/10.3389/feart.2016.00111, 2017.
Hill, E. A., Carr, J. R., Stokes, C. R., and Gudmundsson, G. H.: Dynamic changes in outlet glaciers in northern Green-land from 1948 to 2015, The Cryosphere, 12, 3243–3263, https://doi.org/10.5194/tc-12-3243-2018, 2018.
Holland, D. M., Thomas, R. H., de Young, B., Ribergaard, M. H., and Lyberth, B.: Acceleration of Jakobshavn Isbræ triggered by warm subsurface ocean waters, Nat. Geosci., 1, 659–664, https://doi.org/10.1038/ngeo316, 2008.
Howat, I. M.: MeaSUREs Greenland Ice Velocity: Selected Glacier Site Velocity Maps from Optical Images, Version 2, National Snow and Ice Data Center Distributed Active Archive Center, https://doi.org/10.5067/VM5DZ20MYF5C, 2017.
Howat, I. M., Joughin, I., Tulaczyk, S., and Gogi-neni, S.: Rapid retreat and acceleration of Helheim Glacier, east Greenland, Geophys. Res. Lett., 32, 1–4, https://doi.org/10.1029/2005GL024737, 2005.
Howat, I. M., Joughin, I., and Scambos, T. A.: Rapid changes in ice discharge from Greenland outlet glaciers, Science, 315, 1559– 1561, https://doi.org/10.1126/science.1138478, 2007.
Howat, I. M., Negrete, A., and Smith, B. E.: The Green-land Ice Mapping Project (GIMP) Green-land classification and surface elevation data sets, The Cryosphere, 8, 1509–1518, https://doi.org/10.5194/tc-8-1509-2014, 2014.
Jakobsson, M., Hogan, K. A., Mayer, L. A., Mix, A., Jennings, A., Stoner, J., Eriksson, B., Jerram, K., Mohammad, R., Pearce, C., Reilly, B., and Stranne, C.: The Holocene retreat dynamics and stability of Petermann Glacier in northwest Greenland, Nat. Commun., 9, 2104, https://doi.org/10.1038/s41467-018-04573-2, 2018.
Jensen, T. S., Box, J. E., and Hvidberg, C. S.: A sensitivity study of annual area change for Greenland ice sheet marine terminating outlet glaciers: 1999–2013, J. Glaciol., 62, 72–81, https://doi.org/10.1017/jog.2016.12, 2016.
Johannessen, O. M., Babiker, M., and Miles, M. W.: Unprece-dented retreat in a 50-year observational record for Peter-mann Glacier, North Greenland, Atmospheric and Oceanic Sci-ence Letters, 6, 259–265, https://doi.org/10.3878/j.issn.1674-2834.13.0021, 2013.
Joughin, I., Howat, I. M., Fahnestock, M., Smith, B., Krabill, W., Alley, R. B., Stern, H., and Truffer, M.: Continued evolution of Jakobshavn Isbrae following its rapid speedup, J. Geophys. Res.-Earth, 113, 1–14, https://doi.org/10.1029/2008JF001023, 2008. Joughin, I., Smith, B. E., Howat, I. M., Scambos, T.,
and Moon, T.: Greenland flow variability from
ice-sheet-wide velocity mapping, J. Glaciol., 56, 415–430, https://doi.org/10.3189/002214310792447734, 2010.
Krabill, W., Abdalati, W., Frederick, E., Manizade, S., Mar-tin, C., Sonntag, J., Swift, R., Thomas, R., Wright, W., and Yungel, J.: Greenland Ice Sheet: High-elevation bal-ance and peripheral thinning, Science, 289, 428–430, https://doi.org/10.1126/science.289.5478.428, 2000.
Lee, V., Cornford, S. L., and Payne, A. J.: Initialization of an ice-sheet model for present-day Greenland, Ann. Glaciol., 56, 129– 140, https://doi.org/10.3189/2015AoG70A121, 2015.
Lemos, A., Shepherd, A., McMillan, M., Hogg, A. E., Hatton, E., and Joughin, I.: Ice velocity of Jakobshavn Isbræ, Petermann Glacier, Nioghalvfjerdsfjorden, and Zachariæ Isstrøm, 2015– 2017, from Sentinel 1-a/b SAR imagery, The Cryosphere, 12, 2087–2097, https://doi.org/10.5194/tc-12-2087-2018, 2018. Macayeal, D. R.: Large-scale ice flow over a viscous
basal sediment: Theory and application to ice stream B, Antarctica, J. Geophys. Res. Sol. Ea., 94, 4071–4087, https://doi.org/10.1029/JB094iB04p04071, 1989.
MacGregor, J. A., Fahnestock, M. A., Catania, G. A., As-chwanden, A., Clow, G. D., Colgan, W. T., Gogineni, S. P., Morlighem, M., Nowicki, S. M., Paden, J. D., Price, S. F., and Seroussi, H.: A synthesis of the basal thermal state of the Greenland Ice Sheet, J. Geophys. Res.-Earth, 121, 1328–1350, https://doi.org/10.1002/2015JF003803, 2016.
Moon, T. and Joughin, I.: Changes in ice front position on Green-land’s outlet glaciers from 1992 to 2007, J. Geophys. Res.-Earth, 113, 1–10, https://doi.org/10.1029/2007JF000927, 2008. Moon, T., Joughin, I., Smith, B., and Howat, I.: 21st-Century
Evo-lution of Greenland Outlet Glacier Velocities, Science, 336, 576– 578, https://doi.org/10.1126/science.1219985, 2012.
Morland, L. W.: Unconfined Ice-Shelf Flow, in: Dynamics of the West Antarctic Ice Sheet, edited by: der Veen, C. J. and Oerlemans, J., Springer Netherlands, Dordrecht, 99–116, https://doi.org/10.1007/978-94-009-3745-1_6, 1987.
Morlighem, M., Williams, C. N., Rignot, E., An, L., Arndt, J. E., Bamber, J. L., Catania, G., Chauché, N., Dowdeswell, J. A., Dorschel, B., Fenty, I., Hogan, K., Howat, I., Hubbard, A., Jakob-sson, M., Jordan, T. M., Kjeldsen, K. K., Millan, R., Mayer, L., Mouginot, J., Noël, B. P., O’Cofaigh, C., Palmer, S., Rys-gaard, S., Seroussi, H., Siegert, M. J., Slabon, P., Straneo, F., van den Broeke, M. R., Weinrebe, W., Wood, M., and Zinglersen, K. B.: BedMachine v3: Complete Bed Topography and Ocean Bathymetry Mapping of Greenland From Multibeam Echo Sounding Combined With Mass Conservation, Geophys. Res. Lett., 44, 11051–11061, https://doi.org/10.1002/2017GL074954, 2017.
Mouginot, J., Rignot, E., Scheuchl, B., Fenty, I., Khazendar, A., Morlighem, M., Buzzi, A., and Paden, J.: Fast retreat of Zachariæ Isstrøm, northeast Greenland, Science, 350, 1357– 1361, https://doi.org/10.1126/science.aac7111, 2015.
Münchow, A., Padman, L., and Fricker, H. A.: Interannual changes of the floating ice shelf of Petermann Gletscher, North Greenland, from 2000 to 2012, J. Glaciol., 60, 489–499, https://doi.org/10.3189/2014JoG13J135, 2014.
Nagler, T., Rott, H., Hetzenecker, M., Wuite, J., and Potin, P.: The Sentinel-1 Mission: New Opportunities for Ice Sheet Observations, Remote Sensing, 7, 9371–9389, https://doi.org/10.3390/rs70709371, 2015.
Nagler, T., Hauglund, K., Forsberg, R., and Engdahl, M.: Product User Guide (PUG), vol. version 2, available at: http://esa-icesheets-greenland-cci.org/sites/default/files/ documents/public/ST-DTU-ESA-GISCCI-PUG-001_v2.0.pdf (last access: 11 Decemebr 2018), 2016.
Nick, F. M., Vieli, A., Howat, I. M., and Joughin, I.: Large-scale changes in Greenland outlet glacier dynam-ics triggered at the terminus, Nat. Geosci., 2, 110–114, https://doi.org/10.1038/ngeo394, 2009.
Nick, F. M., Luckman, A., Vieli, A., Van Der Veen, C. J., Van As, D., Van De Wal, R. S. W., Pattyn, F., Hubbard, A. L., and Floricioiu, D.: The response of Petermann Glacier, Greenland, to large calving events, and its future stability in the context of atmospheric and oceanic warming, J. Glaciol., 58, 229–239, https://doi.org/10.3189/2012JoG11J242, 2012.
Pegler, S. S.: The dynamics of confined extensional flows, J. Fluid Mech., 804, 24–57, https://doi.org/10.1017/jfm.2016.516, 2016. Pegler, S. S., Kowal, K. N., Hasenclever, L. Q., and Grae Worster, M.: Lateral controls on grounding-line dynamics, J. Fluid Mech., 722, 1–12, https://doi.org/10.1017/jfm.2013.140, 2013. Porter, D. F., Tinto, K. J., Boghosian, A., Cochran, J. R., Bell, R. E.,
Manizade, S. S., and Sonntag, J. G.: Bathymetric control of tide-water glacier mass loss in northwest Greenland, Earth Planet. Sc. Lett., 401, 40–46, https://doi.org/10.1016/j.epsl.2014.05.058, 2014.
Pritchard, H. D., Arthern, R. J., Vaughan, D. G., and Edwards, L. A.: Extensive dynamic thinning on the margins of the Greenland and Antarctic ice sheets, Nature, 461, 971–975, https://doi.org/10.1038/nature08471, 2009.
Rathmann, N. M., Hvidberg, C. S., Solgaard, A. M., Grin-sted, A., Gudmundsson, G. H., Langen, P. L., Nielsen, K. P., and Kusk, A.: Highly temporally resolved response to sea-sonal surface melt of the Zachariae and 79N outlet glaciers in northeast Greenland, Geophys. Res. Lett., 44, 9805–9814, https://doi.org/10.1002/2017GL074368, 2017.
Raymond, C.: Shear margins in glaciers and ice sheets, J. Glaciol., 42, 90–102, https://doi.org/10.3189/S0022143000030550, 1996. Reeh, N., Thomsen, H. H., Higgins, A. K., and Weidick, A.: Sea ice and the stability of north and northeast Greenland floating glaciers, Ann. Glaciol., 33, 474–480, https://doi.org/10.3189/172756401781818554, 2001.
Reese, R., Winkelmann, R., and Gudmundsson, G. H.: Grounding-line flux formula applied as a flux condition in numerical simulations fails for buttressed Antarctic ice streams, The Cryosphere, 12, 3229–3242, https://doi.org/10.5194/tc-12-3229-2018, 2018a.
Reese, R., Winkelmann, R., and Gudmundsson, G. H.: Grounding-line flux formula applied as a flux condition in numerical simula-tions fails for buttressed Antarctic ice streams, The Cryosphere, 12, 3229–3242, https://doi.org/10.5194/tc-12-3229-2018, 2018b. Rignot, E. and Kanagaratnam, P.: Changes in the velocity struc-ture of the Greenland Ice Sheet, Science, 311, 986–990, https://doi.org/10.1126/science.1121381, 2006.
Rignot, E. and Steffen, K.: Channelized bottom melting and sta-bility of floating ice shelves, Geophys. Res. Lett., 35, 2–6, https://doi.org/10.1029/2007GL031765, 2008.
Rignot, E., Gogineni, S., Joughin, I., and Krabill, W.: Contribu-tion to the glaciology of northern Greenland from satellite radar interferometry, J. Geophys. Res.-Atmos., 106, 34007–34019, https://doi.org/10.1029/2001JD900071, 2001.
Rosenau, R., Scheinert, M., and Dietrich, R.: A process-ing system to monitor Greenland outlet glacier velocity variations at decadal and seasonal time scales utilizing the Landsat imagery, Remote Sens. Environ., 169, 1–19, https://doi.org/10.1016/j.rse.2015.07.012, 2015.
Scambos, T. A., Bohlander, J. A., Shuman, C. A., and Skvarca, P.: Glacier acceleration and thinning after ice shelf collapse in the Larsen B embayment, Antarctica, Geophys. Res. Lett., 31, 2001– 2004, https://doi.org/10.1029/2004GL020670, 2004.
Schoof, C.: Ice sheet grounding line dynamics: Steady states, stability, and hysteresis, J. Geophys. Res.-Earth, 112, 1–19, https://doi.org/10.1029/2006JF000664, 2007.
Schoof, C., Davis, A. D., and Popa, T. V.: Boundary layer models for calving marine outlet glaciers, The Cryosphere, 11, 2283– 2303, https://doi.org/10.5194/tc-11-2283-2017, 2017.
Schwanghart, W. and Kuhn, N. J.: TopoToolbox: A set of Matlab functions for topographic analysis, Environ. Modell. Softw., 25, 770–781, https://doi.org/10.1016/j.envsoft.2009.12.002, 2010. Shroyer, E. L., Padman, L., Samelson, R. M., Münchow, A., and
Stearns, L. A.: Seasonal control of Petermann Gletscher ice-shelf melt by the ocean’s response to sea-ice cover in Nares Strait, J. Glaciol., 63, 324–330, https://doi.org/10.1017/jog.2016.140, 2017.
Straneo, F. and Heimbach, P.: North Atlantic warming and the retreat of Greenland’s outlet glaciers, Nature, 504, 36–43, https://doi.org/10.1038/nature12854, 2013.
van den Broeke, M. R., Enderlin, E. M., Howat, I. M., Kuipers Munneke, P., Noël, B. P. Y., van de Berg, W. J., van Meijgaard, E., and Wouters, B.: On the recent contribution of the Greenland ice sheet to sea level change, The Cryosphere, 10, 1933–1946, https://doi.org/10.5194/tc-10-1933-2016, 2016.