https://doi.org/10.5194/amt-10-4687-2017 © Author(s) 2017. This work is distributed under the Creative Commons Attribution 4.0 License.
Effects of gas–wall partitioning in Teflon tubing and instrumentation
on time-resolved measurements of gas-phase organic compounds
Demetrios Pagonis1,2, Jordan E. Krechmer1,2,3, Joost de Gouw1,4, Jose L. Jimenez1,2, and Paul J. Ziemann1,2
1Cooperative Institute for Research in Environmental Sciences (CIRES), Boulder, Colorado 80309, USA 2Department of Chemistry and Biochemistry, University of Colorado, Boulder, Colorado 80309, USA 3Aerodyne Research, Inc., Billerica, Massachusetts 01821, USA
4NOAA Earth System Research Laboratory, Boulder, Colorado 80305, USA
Correspondence to:Paul J. Ziemann ([email protected]) and Jose L. Jimenez ([email protected]) Received: 30 July 2017 – Discussion started: 1 August 2017
Revised: 13 October 2017 – Accepted: 16 October 2017 – Published: 4 December 2017
Abstract. Recent studies have demonstrated that organic compounds can partition from the gas phase to the walls in Teflon environmental chambers and that the process can be modeled as absorptive partitioning. Here these studies were extended to investigate gas–wall partitioning of or-ganic compounds in Teflon tubing and inside a proton-transfer-reaction mass spectrometer (PTR-MS) used to mon-itor compound concentrations. Rapid partitioning of C8–C14
2-ketones and C11–C16 1-alkenes was observed for
com-pounds with saturation concentrations (c∗)in the range of 3×10⁴to 1×10⁷µg m−3, causing delays in instrument re-sponse to step-function changes in the concentration of com-pounds being measured. These delays vary proportionally with tubing length and diameter and inversely with flow rate andc∗. The gas–wall partitioning process that occurs in tub-ing is similar to what occurs in a gas chromatography col-umn, and the measured delay times (analogous to retention times) were accurately described using a linear chromatog-raphy model where the walls were treated as an equivalent absorbing mass that is consistent with values determined for Teflon environmental chambers. The effect of PTR-MS sur-faces on delay times was also quantified and incorporated into the model. The model predicts delays of an hour or more for semivolatile compounds measured under commonly em-ployed conditions. These results and the model can enable better quantitative design of sampling systems, in particular when fast response is needed, such as for rapid transients, aircraft, or eddy covariance measurements. They may also allow estimation ofc∗ values for unidentified organic com-pounds detected by mass spectrometry and could be
em-ployed to introduce differences in time series of compounds for use with factor analysis methods. Best practices are sug-gested for sampling organic compounds through Teflon tub-ing.
1 Introduction
Teflon tubing is widely used for sampling organic gases in field and laboratory studies, primarily because it is chemi-cally inert and flexible. These properties also make Teflon the material of choice for environmental “smog” chambers, most of which are constructed using fluorinated ethylene-propylene (FEP) or perfluoroalkoxy (PFA) Teflon film (Hal-lquist et al. 2009). Although it has been known for decades that Teflon is permeable to small organic compounds (Yi-Yan et al., 1980; Chemours, 2016), only recently have environ-mental chamber studies shown that it can also absorb large gaseous organic compounds in an equilibrium partitioning process that is rapid (timescale∼10–60 min), reversible, and independent of the age of the chamber (Matsunaga and Zie-mann, 2010; Yeh and ZieZie-mann, 2015; Zhang et al., 2015; Krechmer et al., 2016; Ye et al., 2016). The equilibrium reached in this process can be conveniently described using a model that is analogous to gas–particle partitioning theory (Matsunaga and Ziemann, 2010), in which the chamber walls are treated as an equivalent mass concentration of liquid or-ganic aerosol,Cw. Values ofCwreported by Matsunaga and
cham-ber, a range indicating that a significant fraction of organic products formed from oxidation reactions regularly studied in environmental chambers (and even some less-volatile pre-cursors) will be absorbed into the walls at equilibrium. Using typical values forCwand the timescale for reaching gas–wall
partitioning equilibrium, one can incorporate the effect into box models to estimate the effect of partitioning on cham-ber measurements, as has been done in several studies of secondary organic aerosol yields (Matsunaga and Ziemann, 2010; Shiraiwa et al., 2013; McVay et al., 2014; Bian et al., 2015; Krechmer et al., 2015; La et al., 2016).
Although gas–wall partitioning of organic compounds in Teflon environmental chambers has now been systemati-cally investigated in a number of studies, this is not the case for Teflon tubing used for sampling lines. Delays in in-strument response have been observed and documented re-peatedly, with many references to “sticky” compounds and “memory effects” inside tubing and instrumentation. For ex-ample Teflon O-rings are used inside the proton-transfer-reaction mass spectrometer (PTR-MS) because other mate-rials caused significant delays (Warneke et al., 2003), mea-sured eddy covariance frequencies are dampened by sticky compounds (Park et al., 2013), heated instruments have been developed specifically to reduce delays for semivolatile com-pounds (Mikoviny et al., 2010), and instrument surfaces are often heated when measuring aerosol components through thermal desorption (Holzinger et al., 2010). Memory effects in the inlet of the PTR-MS have been modeled previously, but the concept has not been extended to tubing (Schuhfried et al., 2012).
In the study presented here, we quantified delays observed when a set of organic compounds with a range of volatilities were sampled through Teflon tubing for analysis in a PTR-MS and then developed a model that applies the principles of gas chromatography and gas–wall partitioning in Teflon environmental chambers to predict the delays measured for different tubing lengths and diameters, flow rates, and or-ganic functional groups. The results quantify the potential effects of tubing on measurements of organic gases and en-able better design of sampling systems, in particular when fast instrument response is needed.
2 Experimental section
2.1 Measurements of tubing delay
Experiments were conducted by sampling homologous se-ries of either C11, C12, and C14–C161-alkenes (1-undecene,
1-dodecene, 1-tetradecene, 1-pentadecene, 1-hexadecene) or C8, C10, and C12–C14ketones (octanone, decanone,
2-dodecanone, 2-tridecanone, 2-tetradecanone) from an 8 m3 FEP Teflon environmental chamber into a quadrupole PTR-MS using Teflon tubing. The PTR-PTR-MS has been described previously (de Gouw and Warneke, 2007). For each
exper-iment approximately 20 ppb of each of the compounds in a homologous series was added to the chamber by evapo-rating a known amount from a glass bulb (with heating as necessary) into a 5 L min−1 stream of ultra high-purity N2.
The chamber was then mixed with a Teflon-coated fan for 1 min and allowed to sit for 30 min to ensure that gas–wall partitioning equilibrium had been achieved inside the cham-ber (Matsunaga and Ziemann, 2010). The combined passi-vation time of the tubing+PTR-MS for compounds in the chamber was determined by moving the tubing from sam-pling room air (a clean air source for the conditions of these experiments) to sampling chamber air containing the com-pounds. This procedure produces a step function in the con-centration of compounds sampled and is identical to frontal analysis, a long-standing technique for characterizing chro-matography columns (James and Phillips, 1954; Schay and Szekely, 1954). After the instrument response reached steady state (meaning that the PTR-MS and tubing were fully equi-librated with the incoming air), either the tubing was moved back to sampling room air, allowing the PTR-MS and tub-ing to approach a new equilibrium state, or the PTR-MS was investigated separately by detaching the inlet tubing so that it sampled room air directly. The effect of the tubing on the equilibration time was isolated by comparing the response times when the PTR-MS was sampling room air with and without the tubing.
The base case measurements of delays were conducted with 2-ketones sampled through 1.0 m of PFA Teflon tub-ing (1/4 in. OD, 3/16 in. ID) at a flow rate of 0.36 L min−1, with the 1-alkenes evaluated under the same conditions. The effect of tubing length on the delay was evaluated by also using 3.0 m of PFA Teflon tubing with the same OD and ID at a flow rate of 0.36 L min−1. The effect of flow rate on the delay was evaluated by increasing the flow rate from 0.36 to 2.7 L min−1by adding a line sampling an additional 2.3 L min−1flow (controlled by a critical orifice) in parallel with the PTR-MS. In this experiment a 3.0 m length of PFA Teflon tubing was used to achieve a sufficiently large delay. The effect of tubing diameter on the delay was investigated using a 3.0 m length of 1/8 in. OD, 1/16 in. ID PFA Teflon tubing at a flow rate of 0.36 L min−1. Flow was laminar in the tubing during all experiments, with calculated Reynolds numbers of 90 and 650 for the low and high flow experi-ments in the 3/16 in. ID tubing and 260 in the experiment using 1/16 in. ID tubing. The tests were conducted at ambi-ent laboratory temperature (23◦C) and when the instrument had been pumped down and operated for several weeks, thus representing typical operating conditions.
2.2 Chemicals
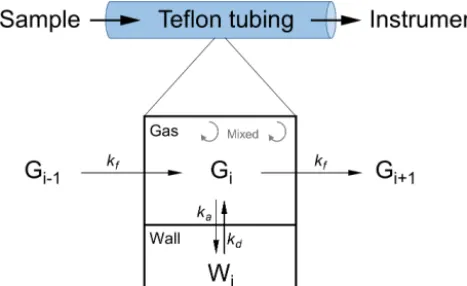
Figure 1.Schematic of the chromatography model used to describe delays caused by gas–wall partitioning of organic compounds in Teflon tubing. Compounds flow through a series of perfectly mixed bins, undergoing gas–wall partitioning within each bin. The rates constants for flow between bins (kf), absorption (ka), and desorption (kd)are dependent on tubing diameter, flow rate, and the saturation vapor concentrationc∗of the compound being measured.
Aldrich; 2-dodecanone (98 %) and 2-tetradecanone (98 %) from ChemSampCo; and 1-hexadecene (99.8 %) from Fluka. 2.3 Model for transport of an organic compound
through Teflon tubing
The model used to describe the effect of tubing on the delay is a linear kinetic chromatography model, where the affinity of a compound for the walls of the Teflon tubing (the sta-tionary phase) is determined by its saturation concentration (c∗). This approach seems reasonable, considering the nature of the processes involved, the dependence of gas–wall parti-tioning onc∗(Matsunaga and Ziemann, 2010; Krechmer et al., 2016), and the observation that the extent of partitioning of an organic compound in a Teflon chamber correlates well with its retention time measured by gas chromatography (Yeh and Ziemann, 2015). Based on the chamber results, we as-sume that the rate of absorption of a compound into the walls is controlled by gas-phase diffusion to the walls (and thus does not depend on mass accommodation) and treat absorp-tion and desorpabsorp-tion as first-order processes. For a numerical solution the tubing is divided into a series of perfectly mixed bins, with compound flowing into and out of each bin and also undergoing gas–wall partitioning, as shown in Fig. 1.
Our assumption of diffusion-limited absorption is consis-tent with the criteria developed by McMurry and Stolzen-burg (1987), who compared timescales for diffusion and up-take at the walls to determine whether mass accommoda-tion affects the uptake kinetics of sticky compounds pass-ing through tubpass-ing. They estimate the timescale for diffusion (τdiff)as in Eq. (1),
τdiff=
dt2
8Dg
, (1)
and the timescale for accommodation into the wall (τac)as in
Eq. (2),
τac=
dt
2αc¯, (2)
whereDgis the compound’s diffusion coefficient in air,αis
its mass accommodation coefficient on the tubing wall,c¯is its mean thermal speed, anddt is the ID of the tubing. The
mass accommodation coefficient has an impact on the rate of uptake at the walls when the timescale for accommodation is comparable to or larger than the timescale for diffusion, as in Eq. (3):
τac
τdiff
=4Dg
αcd¯ t&
1. (3)
Using a diffusion coefficient of 0.067 cm2s−1, the average of values calculated for the compounds studied here (range of 0.055–0.088 cm2s−1)using three methods (Tucker and Nelken, 1982), and a tubing ID of 0.47 cm, Eq. (3) indicates that mass accommodation does not affect the rate of uptake to the walls for values of α> 3×10⁻⁵. Since this thresh-old is similar to that determined in studies of gas–wall parti-tioning in Teflon environmental chambers, where it has been shown that the rate of turbulent mixing within the chamber is the rate-limiting process in establishing partitioning equilib-rium for compounds with mass accommodation coefficients greater than∼10−5(Matsunaga and Ziemann, 2010; Krech-mer et al., 2016), our assumption that absorption of com-pounds into the walls is limited by gas-phase diffusion seems justified.
The first-order rate constant for absorption of compounds into the tubing walls (ka)was calculated using Eq. (4):
ka=
8Dg
dt2 , (4)
which is the inverse of the timescale for diffusion-limited transport to the walls given by Eq. (1). For the 0.47 cm ID tubing used in our experiments,τa=0.4 s. Rate constants for
desorption of compounds out of the walls (kd)were
calcu-lated using Eq. (5):
kd=
ka
Kgw
, (5)
whereKgw is the equilibrium constant for gas–wall
parti-tioning inside the tubing. The most- and least-volatile com-pounds measured here had desorption timescales of 0.2 and 50 s, respectively, in 0.47 cm ID tubing. Values ofKgwwere
calculated using Eq. (6):
Kgw=
Cw
c∗, (6)
chambers. Values ofc∗were estimated using the SIMPOL.1 group contribution method (Pankow and Asher, 2008), and
Cw was obtained by linear fitting of our largest data set
(0.47 cm ID tubing sampling at 0.36 L min−1) in log–log space using orthogonal distance regression, which gave an optimum value of 4 g m−3. Additional details on the fitting procedure used to determineCwcan be found in the
Supple-ment of this paper.
For perfectly mixed flow in the bins, flow is modeled as a first-order process as in Eq. (7):
kf=
Q
A l, (7)
whereQis the volumetric flow rate inside the tubing,Ais the cross-sectional area of the tubing, andlis the length of a bin in the model (2 cm). A comparison of the concentration profiles of compounds at the tubing exit simulated assuming perfectly mixed or laminar flow is presented in Fig. S1 in the Supplement. The error this assumption causes in transfer time through a 1 m length of tubing is generally smaller than the effect of gas–wall partitioning within the tubing and so does not affect the model results presented here.
Diffusion of compounds absorbed into the walls of the Teflon tubing is fast compared to the timescales investigated here, and thus it is not explicitly included in our model. This is similar to the assumption often made in chromatography models that diffusion within the stationary phase does not af-fect mass transfer within the column (Guiochon et al., 2006). Using the formulation developed by Krechmer et al. (2016), we estimate that the depth to which organic compounds ef-fectively partition into the Teflon tubing is 2.2 nm for theCw
value derived here. This value is consistent with our esti-mates for Teflon chambers, which ranged from 1.5 to 4.5 nm (Krechmer et al., 2016). Diffusion coefficients of larger or-ganic molecules in Teflon (e.g., toluene and benzene) are
Dt∼2×10⁻⁹cm2s−1(Tokarev et al., 2006), resulting in a
timescale for diffusion in the walls ofτdw∼lw2/Dt∼0.1 ms.
This is much smaller than the minimum timescale for gas-phase diffusion and accommodation of∼400 ms, indicating that this process is too fast to limit partitioning and thus does not need explicit representation in the model.
Using the rate constants defined above, the rates of change in concentration of compounds in the gas phase and wall compartments in bini, [Gi] and [Wi], can be expressed as in Eqs. (8) and (9):
d[Gi] dt =kf
Gi−1−kf[Gi]−ka[Gi]+kd[Wi], (8)
d[Wi]
dt =ka[Gi]−kd[Wi], (9)
where both [Gi] and [Wi] are expressed in units of moles per cubic meter of air. These units are consistent with our
treatment of gas–wall partitioning as being analogous to gas– particle partitioning, where the concentration of compounds in the condensed phase is represented as moles (or mass) per cubic meter of air (Pankow, 1994; Donahue et al., 2006).
The model was solved numerically using the Euler method at a time step of 1 ms and 50 bins per meter of tubing, using IGOR Pro (Wavemetrics, v7.02). Shortening the time step and/or increasing the number of bins per meter of tubing did not appreciably change the numerical results.
3 Results and discussion
3.1 Effect of volatility, tubing length, and flow rate on tubing delays
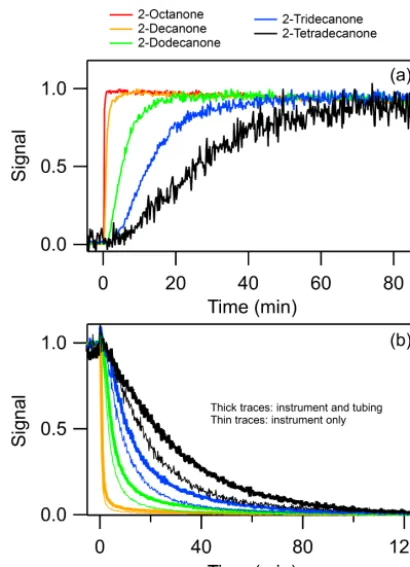
Tubing delays were measured by introducing step-function changes in the concentration of organic compounds mea-sured by the PTR-MS, with all compounds of a homologous series being measured simultaneously, as shown in Fig. 2. We quantify delays in this study as the amount of time re-quired for the PTR-MS signal to achieve 90 % of the total change caused by the step-function change in sample con-centration. As can be seen in Fig. 2a for 2-ketones, the to-tal (PTR-MS+tubing) delay increases with increasing com-pound carbon number and therefore decreasing comcom-pound volatility. This can be explained by noting that the criteria for gas–wall partitioning equilibrium is that the rates of ab-sorption and deab-sorption are equal throughout the system, so for tubing (a similar equation holds for the PTR-MS) this condition is everywhere given by Eq. (10):
ka[G]=kd[W]. (10)
Substituting Eqs. (5) and (6) and rearranging, the equilibrium condition is then given by Eq. (11):
[W]=Cw[G]
c∗ . (11)
SinceCw, [G] (the input concentration), and the rate of
ab-sorption are essentially the same for all compounds, the time required for [W] to reach the equilibrium value given by Eq. (11) increases with decreasing compound volatility. This reflects the need for the tubing to absorb a larger amount of the less-volatile compounds to reach equilibrium, while only a very small amount of the more-volatile species needs to be absorbed to meet that condition.
Figure 2. (a) PTR-MS time profiles measured in response to a step-function increase in the concentration of 2-ketones. All com-pounds were measured simultaneously through 1 m of 3/16 in. ID PFA Teflon tubing at a flow rate of 0.36 L min−1. Profiles are nor-malized to peak signal. The decline in signal over time is due to drift in instrument response following start-up.(b)PTR-MS time profiles measured in response to a step-function decrease in the concentra-tion of 2-ketones for tubing+MS (thick lines) and the PTR-MS alone (thin lines). The tubing used was a 3 m length of 3/16 in. ID PFA Teflon, and the flow rate for both traces was 0.36 L min−1. Profiles are normalized to the equilibrium concentration measured prior to the step change. The signal-to-noise ratio is lower at higher carbon numbers due to gas–wall partitioning in the chamber lower-ing sample concentration as well as mass discrimination within the PTR-MS quadrupole mass analyzer. For visual clarity the profiles for 2-octanone are not shown since they overlap with the profiles for 2-decanone.
The tubing delays measured for 2-ketones sampled through two lengths of 0.47 cm ID tubing (1 and 3 m) at a single flow rate (0.36 L min−1)and through a single length of 0.47 cm ID tubing (3 m) at two flow rates (0.36 and 2.7 L min−1)are shown in Fig. 3a and b, respectively. The tubing delay increases almost proportionally with tubing length, similar to the effect of column length on retention time established in the chromatography literature, captured in Eq. (12):
tr=
B L vf
, (12)
Figure 3. (a)Tubing delays for PTR-MS analysis of 2-ketones sampled using 1 and 3 m of 3/16 in. ID tubing at a flow rate of 0.36 L min−1. The dashed line corresponds to the model case where the delay is proportional to the length of the tubing, which for these experiments is a factor of 3.(b)Tubing delays for PTR-MS analysis of 2-ketones sampled using 3 m of 3/16 in. ID tubing and flow rates of 0.36 and 2.7 L min−1. The dashed line corresponds to the model case where the delay is inversely proportional to the flow rate, which for these experiments is a factor of 0.13.
wheretris retention time,Lis column length,vfis the bulk
flow velocity, andB is a constant that incorporates the par-titioning coefficient and volumes of stationary and mobile phases (Poole, 2003; Skoog et al., 2007). The tubing delay decreases as flow rate is increased (Fig. 3b) because com-pounds have less time to partition to the walls, but the ob-served change is less than inversely proportional to the flow velocity (0.20 instead of 0.13) as predicted by Eq. (12). This discrepancy is thought to occur because, unlike chromatog-raphy where the timescale for absorption of compound to the walls is much shorter than the timescale for flow in the tube, in the tubing experiments the timescales are comparable.
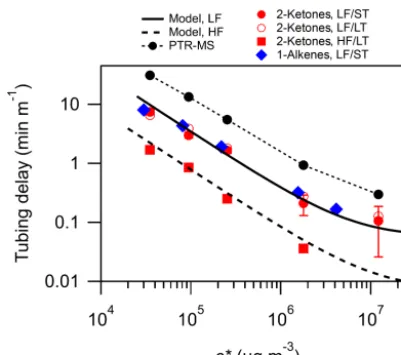
The dependence of tubing delays measured for 2-ketones and 1-alkenes onc∗ for a range of conditions is shown in Fig. 4. Because delays increase proportionally with increas-ing tubincreas-ing length, they are plotted as minutes of delay per meter of tubing. Delays are inversely proportional to c∗, eventually leveling off at the residence time of the tubing whenc∗Cwand gas–wall partitioning becomes
Figure 4. Comparison of modeled and measured tubing delays for homologous series of 2-ketones and 1-alkenes with a range of c∗ values using short (ST=1 m) and long (LT=3 m) lengths of 3/16 in. ID tubing with low (LF=0.36 L min−1)flow and long tub-ing with low and high (HF=2.7 L min−1)flow. The instrument de-lay for the PTR-MS is also shown. Values ofc∗were calculated using SIMPOL.1 (Pankow and Asher, 2008). Error bars are only shown for the 2-ketone LF/ST case, and represent the variability (SD) of the observations. Note that for the larger delays, the error bars are smaller than the data points.
to reach partitioning equilibrium with c∗, as described in Eq. (11). Figure 4 also compares model output to our ex-perimental results and shows that the model accurately pre-dicts the tubing delay as a function ofc∗across all functional groups, tubing lengths, and flow rates tested. No effect of functional group on tubing delay was observed, consistent with past studies of gas–wall partitioning in Teflon cham-bers, where compound volatility is the property that best pre-dicts the extent of sorption (Matsunaga, 2010). We note here that past work has shown that gas–wall partitioning equilib-rium established in Teflon chambers is independent of sam-ple concentration (Matsunaga and Ziemann, 2010) and rela-tive humidity (Krechmer et al., 2017). Limited experiments conducted here were consistent with those findings, indicat-ing that this model can be used to estimate tubindicat-ing delays in both lab and field settings.
Model simulations were also conducted for a range of flow rates and c∗ typically encountered in laboratory and field studies. The tubing delays predicted by the model are pre-sented in Fig. 5 and are clearly significant, especially for organic compounds with c∗ below 105µg m−3. The results also quantify the heuristics already being used by researchers to minimize tubing delays, which are to minimize tubing length, increase flow rate, and heat tubing. Heating tubing increases thec∗of the compounds being measured, reducing their gas–wall partitioning coefficient and thereby decreas-ing tubdecreas-ing delay. Sampldecreas-ing compounds through the tubdecreas-ing at higher flows than necessary for instruments and dumping
Figure 5.Simulated tubing delays presented as a function ofc∗and flow rate for 3/16 in. ID PFA Teflon tubing. The range of conditions for measurements made in this study are shown by the dashed box. Values ofc∗were calculated using SIMPOL.1 (Pankow and Asher, 2008).
excess flow (oversampling) also reduces tubing delays by de-creasing the time available for compounds to partition to the walls. The delays for 3/16 in. ID Teflon tubing presented in Fig. 5 can be estimated using the empirical parameterization in Eq. (13):
Delaymin m−1= 3.18×10 −3
Q 4.73+Q ×
c∗
8.11×10⁶+c∗
, (13)
whereQis flow rate (L min−1)andc∗is the saturation va-por concentration (µg m−3)at the temperature of the tubing calculated using SIMPOL.1. This parameterization matches the model predictions of tubing delay within a factor of 1.2 for delays between 5 s m−1and 60 min m−1across the range of flow rates andc∗plotted in Fig. 5. We note that although the parameterization in Eq. (13) is based on diffusion coeffi-cientsDgestimated at 23◦C, changes inDgdue to
tempera-ture produce only small changes in predicted delay (∼10 % when raising temperature from 23 to 100◦C). This effect is negligible compared to the change in delay caused by the ac-companying shift inc∗(several orders of magnitude for the same temperature change), making this parameterization a useful predictive tool for the changes in tubing delay caused by changes in temperature. The parameterization does not, however, take into account changes in the absorptive proper-ties of Teflon that may occur at lower or higher temperatures. 3.2 EstimatingCwfor Teflon tubing
As mentioned above, the value ofCwused in the model for
per cubic meter of internal tube volume). In order to directly compare Cw in tubing and chambers one must correct for
differences in the surface-area-to-volume ratios. Since we model gas–wall partitioning as occurring within a finite depth at the surface of the Teflon tubing or chamber, the volume of Teflon into which partitioning occurs is the product of the Teflon surface area (SA) and the partitioning depth (δ).Cw
can then be expressed as in Eq. (14):
Cw=
SAδ ρ
V , (14)
whereρ is the density of Teflon andV is the volume of gas exposed to the given SA of Teflon. The equivalent wall mass measured for tubing can then be scaled for comparison with chamber values using Eq. (15):
Cw,ch=Cw,t
SAchVtδchρch
SAtVchδtρt
, (15)
where the subscripts ch and t denote the chamber and tub-ing. As discussed above,δch/δt∼0.7–2, and since PFA
(tub-ing) and FEP (chambers) Teflon have the same density,
ρch/ρt=1.
When scaled according to Eq. (15), the value of
Cw,t=4 g m−3 reported above is equivalent to ∼10–
30 mg m−3of liquid organic aerosol in an 8 m3chamber. This is comparable to the values ofCwdetermined in FEP Teflon
chambers: 16 mg m−3 for 1-alkenes and 24 and 78 mg m−3 for 2-ketones (Matsunaga and Ziemann, 2010; Yeh and Ziemann, 2015), where values from Matsunaga and Zie-mann (2010) were recalculated withc∗values obtained using SIMPOL.1 (Pankow and Asher, 2008). The similarity inCw
values indicates that gas–wall partitioning of organic com-pounds is similar for PFA and FEP Teflon. We also note that since gas–wall partitioning in tubing depends onCw(Eq. 6)
and since estimates ofCwdepend on the method used to
esti-mate compound vapor pressures, researchers applying the re-sults of this work to other compounds should use SIMPOL.1 to estimate c∗ values, even when measured vapor pressures are available.
3.3 Effect of tubing diameter on tubing delays
We find that tubing delays are shortest for small diameter tubing, provided that flow rate or Reynolds number is held constant. When the tubing is being depassivated following a step-function decrease in sample concentration one can treat the residence time of compound in the walls of the tubing (τw) as the limiting step in depassivation. By substituting
Eqs. (4), (6), and (14) into Eq. (5) one arrives at an expres-sion for the residence time of a compound in the walls of the tubing given in Eq. (16):
τw=
Cw
kac∗
= δtρtdt 2c∗D
g
, (16)
which shows a linear relationship betweenτwand tubing
di-ameter. While this approach is clearly a simplification and
ignores the effect of flow rate on the rate of equilibration, we show in Fig. S2 that our numerical model also predicts a linear relationship between tubing delay and tubing diame-ter when flow rate is held constant. This linear relationship also aligns well with our experimental results. In Fig. S3 we present tubing delays and model results for 1/16 and 3/16 in. ID tubing. In the region where delays are dominated by gas–wall partitioning inside the tubing (c∗< 106µg m−3)
we observe that modeled and measured delays are three times longer for 3/16 in. ID tubing compared to 1/16 in. ID tubing. This relationship breaks down at higher volatilities (c∗> 106µg m−3)sincec∗>Cw and the extent of gas–wall
partitioning is small, giving very short residence times in the walls. With this in mind, one can conclude that tubing delays scale directly with tubing diameter at a constant flow rate when delays are larger than a few seconds.
To quantify the effect of simultaneous changes in tubing diameter and flow rate we generated model predictions of tubing delay for a compound withc∗=105µg m−3across a range of tubing diameters and flow rates. These results are presented in Fig. S4 and provide guidance for designing a sampling system that minimizes tubing delay. As expected, the model predictions indicate that smaller diameter tubing has shorter tubing delays when flow rate or Reynolds num-ber is held constant. The results in Fig. S4 also suggest that one may be able to reduce tubing delays by sampling under turbulent flow conditions. We did not attempt to quantify de-lays under such conditions, however, in part due to the larger pressure drops experienced in that flow regime, which are undesirable under many circumstances.
3.4 Effect of instrumentation on delays
4 Conclusions
We found that gas–wall partitioning of organic compounds inside Teflon tubing significantly affects time-resolved mea-surements of compounds with saturation concentration (c∗)
below 107µg m−3. The compounds measured in this study (SIMPOL.1-calculated c∗ values ranging from 3×10⁴ to 1×10⁷µg m−3)are all expected to exist entirely in the gas phase in the atmosphere (Donahue et al., 2006). We found that measurements of compounds in this volatility range were significantly affected by delays caused by partitioning to the walls of the tubing and the PTR-MS. We modeled the de-lays caused by Teflon tubing using a simple chromatogra-phy model and the gas–wall partitioning framework of Mat-sunaga and Ziemann (2010). This model accurately predicts tubing delays across all compound volatilities, functional groups, tubing lengths and diameters, and flow rates tested. The measurements and model simulations indicate that de-lays can shift compound time profiles by minutes to hours – timescales that are highly relevant to both laboratory and atmospheric measurements.
A potential application of these delays is for estimating compound saturation concentration, even when the identity of the compound is unknown. Past work has proposed using desorption kinetics inside an inlet as a technique for iden-tifying compounds (Schuhfried et al., 2012), and the model presented here can be used in a similar way. Another possi-ble application is to induce time separation among different compounds that are otherwise indistinguishable to the ana-lytical instrumentation (e.g., compounds with the same accu-rate mass in chemical ionization mass spectrometry (CIMS); Stark et al., 2015), since thec∗of multifunctional compounds with the same molecular formula can often differ by 5 orders of magnitude (Krechmer et al., 2015). The separation in time can then be exploited via manual analyses or factor analysis techniques (e.g., Ulbrich et al., 2009). This is equivalent to a “poor-person’s chromatography,” but using ambient temper-ature and Teflon surfaces that avoid thermal decomposition of multifunctional species that can occur in gas chromatog-raphy due to use of high temperatures (Stark et al., 2017).
Accounting for tubing and instrument delays is especially important in circumstances where concentrations of the com-pounds are changing rapidly, including eddy covariance mea-surements, mobile platforms such as aircraft, rapidly chang-ing emission sources such as fires or motor vehicle ex-haust, and fast processes such as chemical reactions and gas–particle–wall partitioning. As CIMS techniques continue to be developed for detecting multifunctional organic com-pounds, extra care must be taken to minimize the impact that tubing and instrument surfaces have on measurements since these compounds are especially sticky.
Based on our results, we recommend that studies mea-suring intermediate volatility and semivolatile compounds (c∗< 106µg m−3)minimize the length of Teflon tubing used and, since increased flow rates and smaller tubing diameters
also help to mitigate tubing delays, use the fastest flow rate in the smallest diameter tubing that still maintains laminar flow. We also recommend that researchers determine the volatility-dependent time response function of their instrument. This sets the lower limit for the response time for a given com-pound and allows for deconvolution of the effects of gas–wall partitioning in the instrument from those in the inlet tubing. The instrument response function can then be convolved with the output of the model presented in this study to correct for delay artifacts caused by gas–wall partitioning in Teflon ing. This method can also be used to characterize other tub-ing materials as well as the effect of temperature and other variables and to enable improved inlet system designs.
Code and data availability. Data for each figure and model code are available for download at http://cires1.colorado.edu/jimenez/ group_pubs.html (Jimenez Group Publications, 2017). The model code can also be found in the Supplement.
The Supplement related to this article is available online at https://doi.org/10.5194/amt-10-4687-2017-supplement.
Competing interests. Joost de Gouw was a consultant for Aerodyne Research Inc. during part of the study.
Acknowledgements. We thank the Alfred P. Sloan Founda-tion (grant no. G–2013–6–02), the US DOE (BER/ASR, grant DE-SC0016559), and the National Science Foundation (grants AGS-1420007 and AGS-1360834) for funding this study.
Edited by: Hendrik Fuchs
Reviewed by: two anonymous referees
References
Bian, Q., May, A. A., Kreidenweis, S. M., and Pierce, J. R.: Investigation of particle and vapor wall-loss effects on con-trolled wood-smoke smog-chamber experiments, Atmos. Chem. Phys., 15, 11027–11045, https://doi.org/10.5194/acp-15-11027-2015, 2015.
Chemours: Teflon FEP fluoroplastic film, available at: https://www.chemours.com/Teflon_Industrial/en_US/assets/ downloads/teflon-fep-film-properties.pdf (last access: 6 July 2017), 2016.
de Gouw, J. and Warneke, C.: Measurements of volatile organic compounds in the earth’s atmosphere using proton-transfer-reaction mass spectrometry, Mass Spectrom. Rev., 26, 223–257, https://doi.org/10.1002/mas.20119, 2007.
semivolatile organics, Environ. Sci. Technol., 40, 2635–2643, https://doi.org/10.1021/es052297c, 2006.
Guiochon, G., Felinger, A., Shirazi, D. G., and Katti, A. M.: Funda-mentals of Preparative and Nonlinear Chromatography, 1st edn., Elsevier Inc, San Diego, CA, USA, 2006.
Hallquist, M., Wenger, J. C., Baltensperger, U., Rudich, Y., Simp-son, D., Claeys, M., Dommen, J., Donahue, N. M., George, C., Goldstein, A. H., Hamilton, J. F., Herrmann, H., Hoff-mann, T., Iinuma, Y., Jang, M., Jenkin, M. E., Jimenez, J. L., Kiendler-Scharr, A., Maenhaut, W., McFiggans, G., Mentel, Th. F., Monod, A., Prévôt, A. S. H., Seinfeld, J. H., Surratt, J. D., Szmigielski, R., and Wildt, J.: The formation, properties and im-pact of secondary organic aerosol: current and emerging issues, Atmos. Chem. Phys., 9, 5155–5236, https://doi.org/10.5194/acp-9-5155-2009, 2009.
Holzinger, R., Williams, J., Herrmann, F., Lelieveld, J., Don-ahue, N. M., and Röckmann, T.: Aerosol analysis using a Thermal-Desorption Proton-Transfer-Reaction Mass Spec-trometer (TD-PTR-MS): a new approach to study process-ing of organic aerosols, Atmos. Chem. Phys., 10, 2257–2267, https://doi.org/10.5194/acp-10-2257-2010, 2010.
James, D. H. and Phillips, C. S. G.: The chromatography of gases and vapours. Part III. The determination of adsorption isotherms, J. Chem. Soc., 1066–1070, 1954.
Jimenez Group Publications: Pagonis AMT tubing model, available at: http://cires1.colorado.edu/jimenez/group_pubs.html, last ac-cess: 29 November 2017.
Krechmer, J. E., Coggon, M. M., Massoli, P., Nguyen, T. B., Crounse, J. D., Hu, W., Day, D. A., Tyndall, G. S., Henze, D. K., Rivera-Rios, J. C., Nowak, J. B., Kimmel, J. R., Mauldin, R. L., Stark, H., Jayne, J. T., Sipilä, M., Junninen, H., St. Clair, J., Zhang, X., Feiner, P. A., Brune, W. H., Keutsch, F. N., Wennberg, P. O., Seinfeld, J. H., Worsnop, D. R., Jimenez, J. L., and Cana-garatna, M. R.: Formation of low volatility organic compounds and secondary organic aerosol from isoprene hydroxyhydroper-oxide Low-NO oxidation, Environ. Sci. Technol., 49, 10330– 10339, https://doi.org/10.1021/acs.est.5b02031, 2015.
Krechmer, J. E., Pagonis, D., Ziemann, P. J., and Jimenez, J. L.: Quantification of gas-wall partitioning in Teflon environ-mental chambers using rapid bursts of low-volatility oxidized species generated in situ, Environ. Sci. Technol., 50, 5757–5765, https://doi.org/10.1021/acs.est.6b00606, 2016.
Krechmer, J. E., Day, D. A., Ziemann, P. J., and Jimenez, J. L.: Direct measurements of gas/particle partitioning and mass accommodation coefficients in environmen-tal chambers, Environ. Sci. Technol., 51, 11867–11875, https://doi.org/10.1021/acs.est.7b02144, 2017.
La, Y. S., Camredon, M., Ziemann, P. J., Valorso, R., Matsunaga, A., Lannuque, V., Lee-Taylor, J., Hodzic, A., Madronich, S., and Au-mont, B.: Impact of chamber wall loss of gaseous organic com-pounds on secondary organic aerosol formation: explicit mod-eling of SOA formation from alkane and alkene oxidation, At-mos. Chem. Phys., 16, 1417–1431, https://doi.org/10.5194/acp-16-1417-2016, 2016.
Matsunaga, A. and Ziemann, P. J.: Gas-wall partition-ing of organic compounds in a Teflon film chamber and potential effects on reaction product and aerosol yield measurements, Aerosol Sci. Tech., 44, 881–892, https://doi.org/10.1080/02786826.2010.501044, 2010.
McMurry, P. H. and Stolzenburg, M. R.: Mass accommodation co-efficients from penetration measurements in laminar tube flow, Atmos. Environ., 21, 1231–1234, https://doi.org/10.1016/0004-6981(87)90251-4, 1987.
McVay, R. C., Cappa, C. D., and Seinfeld, J. H.: Vapor-Wall deposi-tion in chambers: Theoretical consideradeposi-tions, Environ. Sci. Tech-nol., 48, 10251–10258, https://doi.org/10.1021/es502170j, 2014. Mikoviny, T., Kaser, L., and Wisthaler, A.: Development and char-acterization of a High-Temperature Proton-Transfer-Reaction Mass Spectrometer (HT-PTR-MS), Atmos. Meas. Tech., 3, 537– 544, https://doi.org/10.5194/amt-3-537-2010, 2010.
Pankow, J. F.: An absorption model of gas/particle partitioning of organic compounds in the atmosphere, Atmos. Environ., 28, 185–188, https://doi.org/10.1016/1352-2310(94)90093-0, 1994. Pankow, J. F. and Asher, W. E.: SIMPOL.1: a simple group
con-tribution method for predicting vapor pressures and enthalpies of vaporization of multifunctional organic compounds, Atmos. Chem. Phys., 8, 2773–2796, https://doi.org/10.5194/acp-8-2773-2008, 2008.
Park, J.-H., Goldstein, A. H., Timkovsky, J., Fares, S., Weber, R., Karlik, J., and Holzinger, R.: Eddy covariance emission and deposition flux measurements using proton transfer reaction – time of flight – mass spectrometry (PTR-TOF-MS): compari-son with PTR-MS measured vertical gradients and fluxes, At-mos. Chem. Phys., 13, 1439–1456, https://doi.org/10.5194/acp-13-1439-2013, 2013.
Poole, C. F.: The Essence of Chromatography, 1st ed., Elsevier, Boston, MA, USA, 2003.
Schay, G. and Szekely, G.: Gas adsorption measurements in flow systems, Acta Chim., 5, 167–182, 1954.
Schuhfried, E., Aprea, E., Cappellin, L., Soukoulis, C., Viola, R., Märk, T. D., Gasperi, F., and Biasioli, F.: Desorption kinetics with PTR-MS: Isothermal differential desorption kinetics from a heterogeneous inlet surface at ambient pressure and a new con-cept for compound identification, Int. J. Mass Spectrom., 314, 33–41, https://doi.org/10.1016/j.ijms.2012.01.013, 2012. Shiraiwa, M., Yee, L. D., Schilling, K. a, Loza, C. L., Craven,
J. S., Zuend, A., Ziemann, P. J., and Seinfeld, J. H.: Size dis-tribution dynamics reveal particle-phase chemistry in organic aerosol formation, P. Natl. Acad. Sci. USA, 110, 11746–11750, https://doi.org/10.1073/pnas.1307501110, 2013.
Skoog, D. A., Holler, F. J., and Crouch, S. R.: Principles of Instru-mental Analysis, Cengage Learning, Boston, MA, USA, 2007. Stark, H., Yatavelli, R. L. N., Thompson, S. L., Kimmel, J. R.,
Cu-bison, M. J., Chhabra, P. S., Canagaratna, M. R., Jayne, J. T., Worsnop, D. R., and Jimenez, J. L.: Methods to extract molecu-lar and bulk chemical information from series of complex mass spectra with limited mass resolution, Int. J. Mass Spectrom., 389, 26–38, https://doi.org/10.1016/j.ijms.2015.08.011, 2015. Stark, H., Yatavelli, R. L. N., Thompson, S. L., Kang, H.,
Krech-mer, J. E., Kimmel, J. R., Palm, B. B., Hu, W., Hayes, P. L., Day, D. A., Campuzano Jost, P., Canagaratna, M. R., Jayne, J. T., Worsnop, D. R., and Jimenez, J. L.: Impact of ther-mal decomposition on therther-mal desorption instruments: advan-tage of thermogram analysis for quantifying volatility distribu-tions of organic species, Environ. Sci. Technol., 51, 8491–8500, https://doi.org/10.1021/acs.est.7b00160, 2017.
amor-phous Teflon AF2400, J. Polym. Sci. Pol. Phys., 44, 832–844, https://doi.org/10.1002/polb.20725, 2006.
Tucker, W. A. and Nelken, L. H.: Diffusion Coefficients in Air and Water, in: Handbook of Chemical Property Estimation Methods, edited by: Lyman, W. J., Reehl, W. F., and Rosenblatt, D. H., McGraw-Hill, New York, NY, USA„ 17.1–17.35, 1982. Ulbrich, I. M., Canagaratna, M. R., Zhang, Q., Worsnop, D. R., and
Jimenez, J. L.: Interpretation of organic components from Posi-tive Matrix Factorization of aerosol mass spectrometric data, At-mos. Chem. Phys., 9, 2891–2918, https://doi.org/10.5194/acp-9-2891-2009, 2009.
Warneke, C., De Gouw, J. A., Kuster, W. C., Goldan, P. D., and Fall, R.: Validation of atmospheric VOC measurements by proton-transfer-reaction mass spectrometry using a gas-chromatographic preseparation method, Environ. Sci. Technol., 37, 2494–2501, https://doi.org/10.1021/es026266i, 2003. Ye, P., Ding, X., Hakala, J., Hofbauer, V., Robinson, E. S., and
Donahue, N. M.: Vapor wall loss of semi-volatile organic com-pounds in a Teflon chamber, Aerosol Sci. Tech., 50, 822–834, https://doi.org/10.1080/02786826.2016.1195905, 2016.
Yeh, G. K. and Ziemann, P. J.: Gas-wall partitioning of oxygenated organic compounds: measurements, structure– activity relationships, and correlation with gas chromato-graphic retention factor, Aerosol Sci. Tech., 49, 727–738, https://doi.org/10.1080/02786826.2015.1068427, 2015. Yi-Yan, N., Felder, R. M., and Koros, W. J.: Selective
perme-ation of hydrocarbon gases in poly(tetrafluoroethylene) and poly(fluoroethylene-propylene) copolymer, J. Appl. Polym. Sci., 25, 1755–1774, https://doi.org/10.1002/app.1980.070250822, 1980.