www.solid-earth.net/3/161/2012/ doi:10.5194/se-3-161-2012
© Author(s) 2012. CC Attribution 3.0 License.
Solid Earth
New developments in the analysis of column-collapse pyroclastic
density currents through numerical simulations of multiphase flows
S. Lepore and C. Scarpati
Dipartimento di Scienze della Terra, University of Naples Federico II, Largo San Marcellino 10, 80138 Naples, Italy Correspondence to: S. Lepore ([email protected]), C. Scarpati ([email protected])
Received: 27 December 2011 – Published in Solid Earth Discuss.: 26 January 2012 Revised: 6 May 2012 – Accepted: 8 May 2012 – Published: 8 June 2012
Abstract. A granular multiphase model has been used to evaluate the action of differently sized particles on the dy-namics of fountains and associated pyroclastic density cur-rents. The model takes into account the overall disequi-librium conditions between a gas phase and several solid phases, each characterized by its own physical properties. The dynamics of the granular flows (fountains and pyro-clastic density currents) has been simulated by adopting a Reynolds-averaged Navier-Stokes model for describing the turbulence effects. Numerical simulations have been carried out by using different values for the eruptive column temper-ature at the vent, solid particle frictional concentration, tur-bulent kinetic energy, and dissipation. The results obtained provide evidence of the multiphase nature of the model and describe several disequilibrium effects. The low concentra-tion (≤5×10⁻⁴) zones lie in the upper part of the granular flow, above the fountain, and above the tail and body of pyro-clastic density current as thermal plumes. The high concen-tration zones, on the contrary, lie in the fountain and at the base of the current. Hence, pyroclastic density currents are assimilated to granular flows constituted by a low concen-tration suspension flowing above a high concenconcen-tration basal layer (boundary layer), from the proximal regions to the dis-tal ones. Interactions among the solid particles in the bound-ary layer of the granular flow are controlled by collisions be-tween particles, whereas the dispersal of particles in the sus-pension is determined by the dragging of the gas phase. The simulations describe well the dynamics of a tractive bound-ary layer leading to the formation of stratified facies during Strombolian to Plinian eruptions.
1 Introduction
Pyroclastic density currents (PDCs) are among the most complex processes occurring during explosive volcanic erup-tions (Branney and Kokelaar, 2002). They originate from eruptive columns formed by magma fragmentation pro-cesses, which arise in the volcanic conduit when ten-sile inner stress overcomes the magma breaking strength (Zhang, 1999). If the density of the eruptive column remains greater than the atmospheric one, the column collapses in a fountain, from which PDCs extend radially (Woods, 1995). The fountains are characterized by considerable unsteady interactions between the jet and the collapsing part of the columns, which produces recycling of eruptive material into the jet and oscillations in their heights (Valentine et al., 1991; Neri and Dobran, 1994). The complexity of the recycling processes is due to the multiphase nature of the eruptive columns, as well as to the transient and multidimensional properties of the fountains.
During the propagation of PDCs away from the vent, ther-mal plumes rise above the flow, while solid particles settle in its basal part (Druitt, 1998). The unsteady behaviour of the PDCs is caused by water vapour buoyancy effects occurring over them and by ash dragged toward the top by eruption-induced winds (Valentine, 1998). Both processes are charac-terized by transient and multidimensional dynamics.
The development of numerical multiphase codes allowed the implementation of new procedures in the analysis of ex-plosive volcanism. A two-dimensional and two-phase flow model, initially developed to numerically simulate a caldera-forming eruption (Wohletz et al., 1984), was then improved to reproduce PDCs by Valentine and Wohletz (1989). Next, a two-component description of the gas phase and a kinetic de-piction for the dense gas-particle regime (Dobran et al., 1993) and non-equilibrium effects between particles of two differ-ent sizes (Neri and Macedonio, 1996) were included. There-after, treating the gas and the solid phases as permeable con-tinua, described by constitutive equations, multiphase flow models became particularly suited for describing transient and multidimensional non-equilibrium processes. The de-scription of solid particle sedimentation, as well as of air en-trainment and elutriation, was carried out directly from the set of constitutive equations without the need to define new parameters (Valentine, 1998; Macedonio and Neri, 2000; Burgisser and Bergantz, 2002; Valentine et al., 2002). At the same time, PDCs were treated as granular flows, defined as moving interstitial fluids in which an assemblage of dis-crete solid particles is dispersed (Dartevelle, 2004). These flows hold all the ordinary properties of multiphase flows and show a wide variety of behaviours and features. Depending on the loading conditions, the flows are highly dissipative because of frictions, inelastic collisions, and multiphase tur-bulence. Finally, they display a wide range of grain concen-trations, as well as complex (non-linear, non-uniform, and unsteady) rheologies (Dartevelle, 2004, and references cited therein). To account for the whole spectrum of rheologies, the multiphase computer code GMFIX (Geophysical Mul-tiphase Flow with Interphase Exchanges) has been devised, which can successfully simulate several pyroclastic phenom-ena and related eruptive processes (Dartevelle, 2004; Dartev-elle et al., 2004). Multiphase flow models have been exten-sively tested through laboratory experiments and numerical simulations (Gidaspow, 1994; Boyle et al., 1998; Crowe et al, 1998; Dartevelle and Valentine, 2007). Meanwhile, a tran-sient three-dimensional flow model of pyroclastic dispersion has been proposed, in which solid particles are considered to be in dynamic equilibrium with the gas phase (Oberhu-ber et al., 1998; Fadlun et al., 2000; Suzuki et al., 2005; On-garo et al., 2007).
The aim of the present work is to improve the descrip-tion of the PDC deposidescrip-tional processes and boundary layer, as inferred from multiphase numerical models reported in the literature (Dartevelle, 2004; Dartevelle et al., 2004). PDCs are considered as granular flows (Neri et al., 2003), and the GMFIX code is used to develop two-dimensional multiphase numerical simulations. Employing the RANS (Reynolds Average Navier-Stokes) model to describe the tur-bulence (Ferziger and Per´ıc, 2002; Liu and Chow, 2002), numerical simulations are useful for bringing to light new information about the transport and deposition mechanisms of PDCs. The longitudinal transformations will be examined
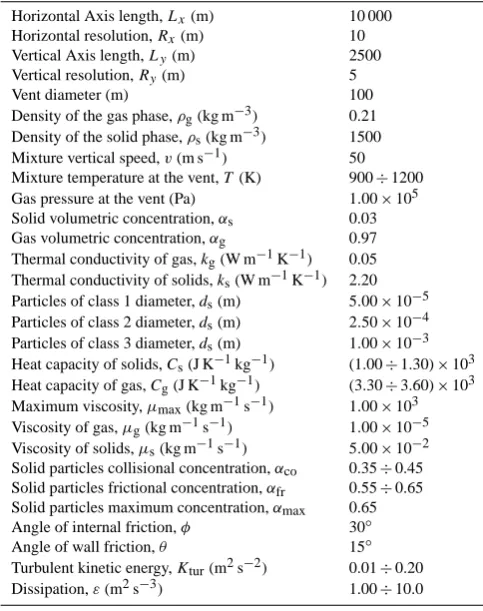
Table 1. Boundary and initial conditions used for numerical
simu-lations.
Horizontal Axis length,Lx(m) 10 000
Horizontal resolution,Rx(m) 10
Vertical Axis length,Ly(m) 2500
Vertical resolution,Ry(m) 5
Vent diameter (m) 100
Density of the gas phase,ρg(kg m−3) 0.21 Density of the solid phase,ρs(kg m−3) 1500 Mixture vertical speed,v(m s−1) 50 Mixture temperature at the vent,T(K) 900÷1200 Gas pressure at the vent (Pa) 1.00×10⁵ Solid volumetric concentration,αs 0.03
Gas volumetric concentration,αg 0.97
Thermal conductivity of gas,kg(W m−1K−1) 0.05 Thermal conductivity of solids,ks(W m−1K−1) 2.20 Particles of class 1 diameter,ds(m) 5.00×10⁻⁵ Particles of class 2 diameter,ds(m) 2.50×10⁻⁴ Particles of class 3 diameter,ds(m) 1.00×10⁻³ Heat capacity of solids,Cs(J K−1kg−1) (1.00÷1.30)×103 Heat capacity of gas,Cg(J K−1kg−1) (3.30÷3.60)×103 Maximum viscosity,µmax(kg m−1s−1) 1.00×10³ Viscosity of gas,µg(kg m−1s−1) 1.00×10⁻⁵ Viscosity of solids,µs(kg m−1s−1) 5.00×10⁻² Solid particles collisional concentration,αco 0.35÷0.45 Solid particles frictional concentration,αfr 0.55÷0.65 Solid particles maximum concentration,αmax 0.65
Angle of internal friction,φ 30◦
Angle of wall friction,θ 15◦
Turbulent kinetic energy,Ktur(m2s−2) 0.01÷0.20
Dissipation,ε(m2s−3) 1.00÷10.0
2 Numerical technique
Granular flows are made up of a large number of particles that inelastically interact among each other. Therefore, be-ing unfeasible to solve sbe-ingularly the dynamics of each par-ticle, the Implicit Multi-Field formalism (IMF), which han-dles all phases in the flow as permeable continua, has been employed. Each point variable (mass, velocity, temperature, pressure, etc.) is volume-averaged over a region greater than the particle dimension, but much smaller than the area of the whole flow domain (Syamlal et al., 1993). Thus, the detailed small-scale fluctuations within the flow are not analytically solved (they are somewhat smoothed out), and all the point variables are replaced by local average variables.
As for the averaged part, the physical description is made through the conservation equations of mass, momentum, and energy, which are formulated in terms of the local volume-averaged variable for each phase. The complete list of sym-bols, units, and constants is provided in Table 1.
(∂ρ g
∂t +∇· ρgvg
= 0
∂ρs
∂t +∇·(ρsvs) = 0
(1a)
(∂(ρ
gvg)
∂t +∇· ρgvgvg
= K (∇·v)+ρgg−∇p−∇· ˜τg ∂(ρsvs)
∂t +∇·(ρsvsvs)= K (∇·v)+ρsg−∇p−∇· ˜τs
(1b)
ρgCg h∂Tg
∂t +vg·∇Tg i
= Q1T˙ + ˙K (1v)−∇·qg+
−pg h∂αg
∂t +∇·αgvg i
ρsCs h∂Tg
∂t +vs·∇Ts i
= Q1T −∇·qs
(1c)
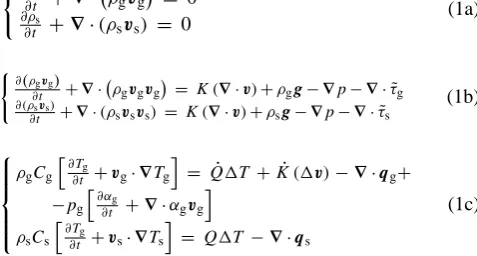
The Eqs. (1a), (1b), and (1c) state the following: the den-sity change with time is equal to the momentum gradient; the momentum change in time and space equals the sum of drag force (friction between solid and gas), pressure gradient, vis-cous forces, and gravity force; the energy change is equiva-lent to the sum of the heat exchange between phases, the heat conduction of each phase, the work done by the drag force due to the frictional contacts within the flow, and the work associated with the volume change of the gas phase (Valen-tine and Wohletz, 1989; Dobran et al., 1993; Neri and Mace-donio, 1996; Neri et al., 2003; Dartevelle, 2004). Unfortu-nately, during the averaging process, some information in-volving the bulk flow behaviour could be lost, and therefore the following constitutive equations are needed for interfacial dragD, viscous stress tensorτ, heat capacityC, exchange heatQ, and heat conductionq (Syamlal et al., 1993; Crowe et al., 1996):
D = 0.145αsρg|vg−vs| ds
τf = sin2φ[∇(vf)]+∇(vf)t −sin3φ(∇·vf) I
C = β0+β1T+β2T2
Q = 6αskg
d2
s Nu(α, κ, µ)
qf = −αfkf∇T
(2)
In Eq. (2), the subscript “t” denotes the mathematical oper-ation of transpose,φ the angle of internal friction that de-scribes frictional contacts between solid particles (Srivas-tava and Sundaresan, 2003; Kelfoun, 2011; Table 1),I the unit tensor, andNu the Nusselt number (Gunn, 1978), and β0,β1, andβ2are numerical constants.
In granular flows, a viscous dissipation within the solid phase is also present. It is related to the particles volumet-ric concentration and is described through variations of the granular energyEγ in time and space, as follows:
∂ρsEγ
∂t + ∇ ·ρsEγvs = 8−Ps∇ ·vs− = ·qs+0 (3)
In Eq. (3),8is the dissipation function,=the density vari-ation in time, and 0 the viscous dissipation involved in slipping, collisions, and dragging. From experimental, nu-merical, and theoretical studies, it was inferred that three granular behaviours can be discerned (Dartevelle, 2004). In the low concentration part of the flow, particles fluctu-ate and translfluctu-ate randomly, thus producing a viscous dis-sipation called kinetic. At higher volumetric concentration (1 %< αs<50 %, Table 1), the collisions among particles become predominant; hence, the viscous dissipation be-comes collisional-like. The collisions among particles and between particles and walls are characterized by dimension-less restitution coefficients. At very high volumetric concen-tration (50 %< αs<65 %, Table 1), particles endure sliding and rubbing contacts that are the source of frictional dissi-pation. The frictional contacts between particles and walls are described through the angle of wall friction θ (Srivas-tava and Sundaresan, 2003; Kelfoun, 2011; Table 1).
Granular flows are also turbulent flows showing time and space dependent properties. With the aim of analysing ac-curately the turbulence features, the computational domain, 10 km long (Lx)and 2.5 km high (Ly), is divided into 1000
cells, each of 10 m (Rx)×2.5 m (Ry)(boundary conditions in
Table 1). Moreover, it is necessary to add transient terms to the conservation equations, which become neither non-linear nor analytically resolvable. Thus, a numerical iterative solu-tion procedure must be adopted to describe the fluctuasolu-tions of each quantity in time and space due to the turbulence. To facilitate the procedure, under-relaxation parameters in the iterations could be used (Ferziger and Per´ıc, 2002). To de-scribe the effects on the motion of solid particles within the granular flow, two fundamental models are reported in the literature: namely the LES and the RANS (Moeng, 1984; Smagorinsky, 1993; Leith, 1993; Dartevelle et al., 2004).
turbulence is given by the following equation:
E (k) ∝ ξ2/3·k−5/3. (4)
In Eq. (4),ξ is the energy cascade rate andk the conduc-tivity. From the energy spectrum, simple scaling laws allow deducing appropriately the eddy viscosity and the eddy ther-mal conductivity. These two quantities are used to define the turbulent subgrid shear stress and the turbulent heat flux (Smagorinsky, 1993; Leith, 1993). The turbulent viscosity is related to the Smagorinsky constant℘as follows:
µtur = (℘·r)2ρkψk. (5)
In Eq. (5),ris the geometric average of the grid size and||ψ|| the Euclidian norm of the rate-of-strain tensor (Nieuwstadt et al., 1991). Several authors have used the LES model in the last 20 years (Dartevelle, 2004, and references cited therein). The RANS model of turbulence averages out the whole set of unsteadiness, considering all the instabilities as part of the turbulence. The averaging process is reasonable at high Reynolds numbers: in that case, in fact, there is a cascade of energy from the largest to the smallest scales, where viscous effects prevail and the energy is dissipated (McWilliams, 1990). Therefore, every quantity can be written as the sum of a time-averaged value and a fluctua-tion around that value:
(x, t ) = ¯ (x)+0(x, t ) . (6)
In Eq. (6), the averaging interval must be greater than the typical time scale of the fluctuations, and the effects of tur-bulence are represented as an increased viscosity. The appli-cation of this factorization in the Navier-Stokes momentum equation leads to the following one, where the turbulent ki-netic energyKtur(Table 1) has been introduced:
ρv0iv0j = 2
3ρδijKtur−ρ<
Ktur2 ε
∂v i ∂xj
+∂vj
∂xi
Ktur= 1 2v
0
iv
0
j (turbulent kinetic energy)
. (7)
In Eq. (7),<is the Reynolds constant andεthe dissipation (Table 1). The turbulent kinetic energy and the dissipation are connected through the following equation (Ferziger and Per´ıc, 2002):
ε·L = Ktur3/2. (8)
In Eq. (8),L is a mixing length scale (Hoffman and Chi-ang, 2000) introduced to relate the turbulent viscosity with the mean velocity of the flow (Odier et al., 2009).
Unlike the LES, the RANS model has not often been used in numerical simulations of geophysical multiphase granu-lar flows. However, from a mathematical point of view, the RANS describes more satisfactorily the interactions between particles and walls (Benhamadouche and Laurence, 2003) and represents more simply the flow transformations due to
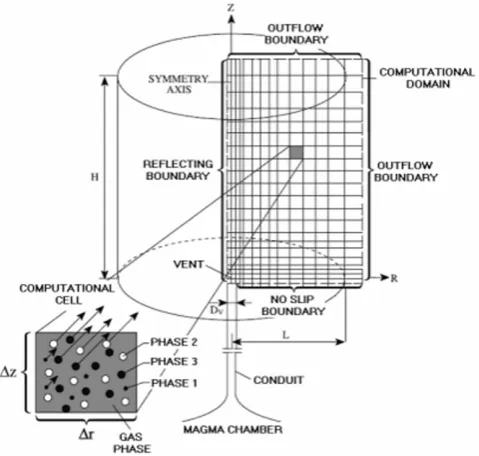
Fig. 1. Domain used in numerical simulations (modified from Neri
et al., 2003).
the turbulence (Cantero et al., 2008). For these reasons, it has been preferred to LES to analyze PDCs dynamics.
All the above described equations are solved numerically by means of the recently validated GMFIX software (Dartev-elle and Valentine, 2007). That requires the definition of a computational domain, the boundary conditions and the ini-tial ones. The domain used in numerical simulations is re-ported in Fig. 1, where cylindrical coordinates are used: the symmetry axis corresponds to the main axis of the eruptive pyroclastic column, and the boundary conditions are defined as reflecting at left, outflow at right and top, and no-slip at bottom.
The GMFIX software derives from the computer code MFIX (Multiphase Flow with Interphase eXchanges). MFIX is a FORTRAN 90 general purpose code (Boyle et al., 1998; Syamlal, 1998; Guenther and Syamlal, 2001), assembled in the Los Alamos National Laboratory from the K-FIX (Kachina with Fully Implicit eXchange) code (Dartev-elle et al., 2004). MFIX has been updated into the Geo-physical version GMFIX to deal with typical geoGeo-physical applications, maintaining all the previous capabilities and adding new ones, such as the work associated with volu-metric variations of the gas phase, the standard atmospheric profiles, the LES and RANS turbulence models, and the subgrid turbulent heat flux (Dartevelle, 2004; Dartevelle et al., 2004). The “FIX” family codes have been used suc-cessfully in volcanological analyses, starting from Valen-tine and Wohletz (1989).
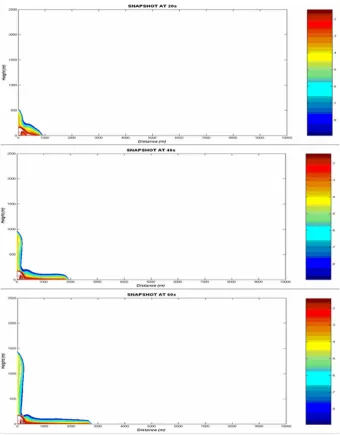
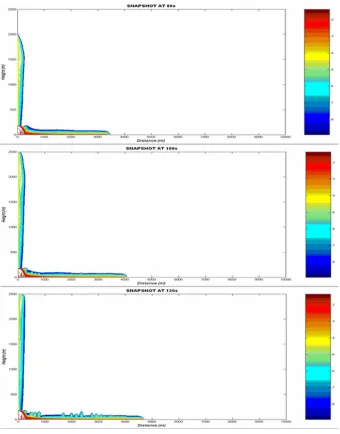
Fig. 2a. Snapshots of the solid particle concentration (logarithmic scale) as a function of distance and height at 20 s, 40 s, and 60 s.
and time (Lakehal, 2002). For the space discretization, GM-FIX uses a finite volume method, which entails that the phys-ical domain is divided into discrete three-dimensional cells, over which the conservation equations are integrated. This integration procedure ensures conservation of mass, momen-tum, and energy, on the entire domain. Scalar quantities, such as mass and temperature, are computed at the cell cen-tre, whereas velocity components are calculated along the cell boundaries. The cell dimension is critical, as solid parti-cles settling and deposition could be neglected by an exces-sively (larger than 100 m2)coarse grid (Patankar, 1980; Do-bran et al., 1993; Neri et al., 2003; Dartevelle et al., 2004). As for the time discretization, GMFIX uses an implicit backward Euler method, and includes various first-order (e.g. FOU) and second-order (e.g. Superbee, Smart, and
Minmod) accurate schemes for discretizing the convection terms (Syamlal, 1998). The FOU discretization scheme was favoured for its stability, better convergence, and because sig-nificant differences were not seen with respect to the second-order schemes (Dartevelle et al., 2004). The products ob-tained through numerical simulations performed with GM-FIX have been processed by using the software MATLAB to generate isolines contour plots.
3 Results
Fig. 2b. Snapshots of the solid particle concentration (logarithmic scale) as a function of distance and height at 80 s, 100 s, and 120 s.
Temperature, heat capacity, frictional concentration of solid particles (defined as the volume of solids divided by the total volume of the flow), turbulent kinetic energy and dissi-pation are parameters that vary between two extreme values (Table 1), while the others are assumed to be constant. The values for velocity and vent dimension are determined from field evaluations of mass flux (Dartevelle et al., 2004). The density of solid particles is the average between the values for lithics and pumices, while the frictional and the maxi-mum concentrations of solid particles are assigned according to Srivastava and Sundaresan (2003). The values for turbu-lent kinetic energy and dissipation are defined in agreement with Ferziger and Per´ıc (2002). A detailed description of the results obtained from one simulation is reported as an
exam-ple. The results from the analysis of the other simulations will be synthesized at the end of this section.
Fig. 2c. Snapshots of the solid particle concentration (logarithmic scale) as a function of distance and height at 140 s, 160 s, and 180 s.
950 m. At increasing time, from 60 to 80 s, the PDC con-tinues to propagate reaching progressively 3.5 km from the vent. The average velocity decreases, reaching 43 m s−1. The maximum height of the tail decreases progressively down to 160 m. Similarly, the height of the body and head decreases to 90 m. The plume above the fountain continues to ascend in the atmosphere up to 2000 m. At 100 s, the PDC propagates to 4100 m from the vent. The basal part propagates to 4 km, with an average velocity of 40 m s−1. The tail, which reaches a maximum height of 150 m, is still the thickest part. The body and the head have become 85 m high. Several thermal plumes start to form along the tail and the body, produced by the loss of the momentum within the PDC and by the dilu-tion due to air ingesdilu-tion coming from the head. The plume above the fountain ascends in the atmosphere to a height of
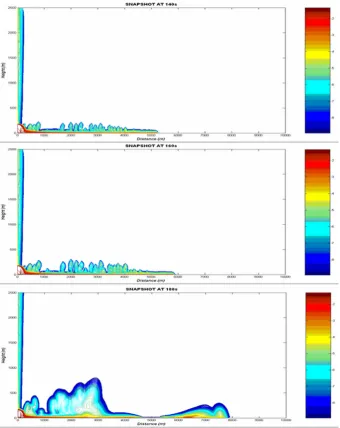
Fig. 3. Sedimentation rate in the PDC as a function of time at 500 m from the vent.
and body attain a maximum height of 850 m. The PDC head, 310 m high, is now the thickest part. This abrupt increase in the height is caused by a large accretion of air ingestion in the last 20 seconds. The plume above the fountain ascends in the atmosphere over the height of 2500 m.
The changes in the features of fountain and PDC dynamics are well described by the plot in Fig. 3 of the sedimentation rate (SR) vs. time. SR is defined as the product of the average horizontal velocity of solid particles and their concentration within the basal part, at a certain time and distance from the vent. The chosen distance is 500 m, since, at that distance, the PDC body is present in all the snapshots of Fig. 2. During the first 40 s the SR increases rapidly, showing an unsteady behaviour. Then this parameter fluctuates only slightly, de-noting a quasi-steady behaviour between 40 s and 160 s. Un-steadiness appears again during the final 20 s of this simu-lation. Waxing unsteadiness is related to a strong increase of pyroclastic concentration possibly due to vertical segrega-tion of clasts during the initial phase of an overloaded current (Hiscott, 1994).
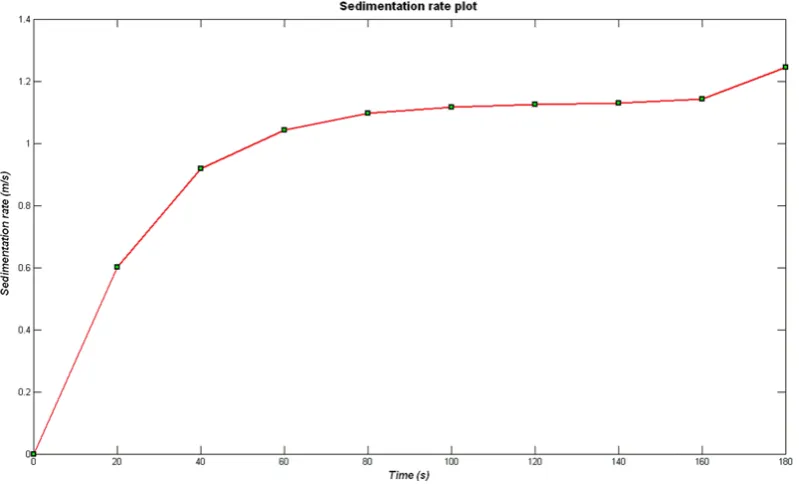
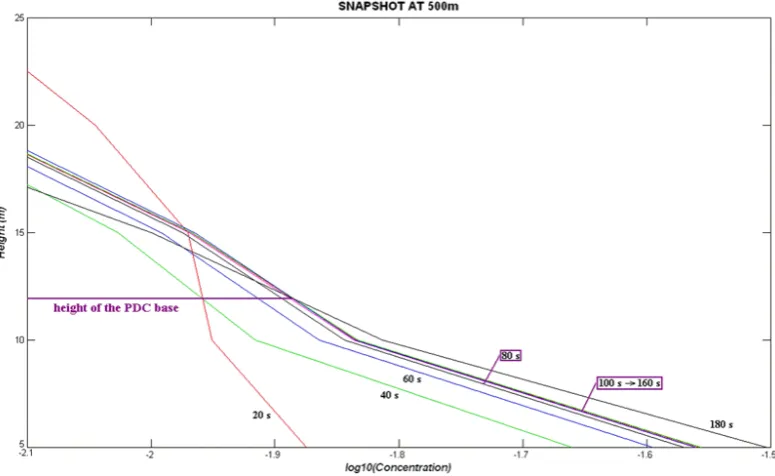
The trends of solid particle concentration as a function of the PDC height, evaluated at the distance of 500 m from the vent and at different times, are analyzed in Fig. 4a. The con-centration at the base (about 12 m high) of the PDC (Fig. 4b) increases quickly between 20 s and 40 s, then slowly until 180 s, reaching a maximum value at about 3 %. In the basal part of the PDC, therefore, solid particles settle continuously reaching a boundary layer (BL) with a low particle concen-tration. Above the base, the concentration of the solid par-ticles decreases progressively passing from 20 s to 80 s. Be-tween 100 s and 180 s, a sudden jump in the concentration,
characterized by some oscillations due to the formation of the thermal plumes, is present in the overall gradual decreas-ing trend.
Finally, the analysis of the results obtained from the other simulations shows that the BL concentration increases from 3 % as maximum value, to 4 % as the temperature decreases from 1200 to 900 K. Besides, the BL concentration increases from 3 to 3.5 % as the solid particle frictional concentration grows from 0.55 up to 0.65, while the BL concentration re-mains almost unaltered around 3 % as the turbulent kinetic energy increases from 0.01 to 0.2 m2s−2and the dissipation from 1.0 to 10.0 m2s−3.
4 Discussion
The initial and boundary conditions reported in Table 1, used in all our numerical simulations, pertain to the activity of collapsing eruptive columns and associated PDCs occurring during Plinian eruptions, as stated by the value of the mass discharge rate, which is 2.3×10⁷kg s−1. The set of the re-sults obtained from all the simulations shows a vertical strat-ification of the solid particle concentration and a quick devel-opment of a thin BL under the more dilute and turbulent PDC portion. In addition, the SR shows low values and the concen-tration in the BL increases at increasing time, first quickly, and then slowly, up to a maximum value in the 3/4 % range.
Fig. 4a. Temporal curves of solid particles logarithmic concentration as a function of height at 500 m from the vent.
Fig. 4b. Zoom of Fig. 4 illustrating the solid particle concentration at the base of the PDC.
part can be assimilated to those producing stratified facies. They can be crossed or diffused according to the values as-sumed by the volumetric concentration of solids in the BL (Chough and Sohn, 1990; Branney and Kokelaar, 2002). The formation of a stratified deposit is suggested by the low maxi-mum value of the sedimentation rate (Giordano et al., 2008). A stratified facies is present when the concentration in the
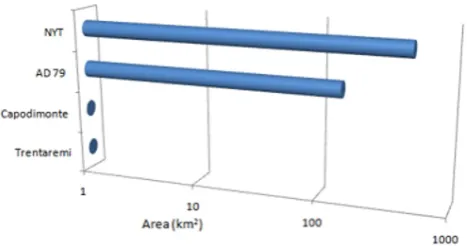
Fig. 5. Areas covered by some of the stratified pyroclastic current
deposits of Phlegraean Fields and Vesuvius.
The formation of stratified facies is not related to the mag-nitude of the eruption, but only to the development of ap-propriate depositional conditions within the PDCs. Strati-fied facies have been observed inside the PDC successions of Strombolian to Plinian eruptions. Here, we briefly report some examples in the Campanian volcanic area. The dif-ferent areas covered by selected pyroclastic deposits are re-ported in Fig. 5. Stratified facies are well developed in Strom-bolian deposits covering an area of less than 1 km2as well as Plinian deposits up to 500 km2. Trentaremi and Capodimonte tuff cones (Cole et al., 1994) are small monogenetic vents of phreatomagmatic style. Their deposits show a limited disper-sion. The flanks of both cones are formed by stratified tuff with several sand-wave structures (Fig. 6a and b), which de-rive from turbulent low-concentration PDCs. Different strat-ified facies (Fig. 6c) have been recognized in the deposits formed by PDCs during Neapolitan Yellow Tuff, which was a large and phreatoplinian eruption. These facies have been interpreted as the product of deposition from turbu-lent low-concentration PDCs, due to traction sedimentation (Cole and Scarpati, 1993). Finally, a stratified facies has been recorded in the succession (Fig. 6d) that occurred during the 79 AD Plinian Vesuvius eruption (Luongo et al., 2003).
As previously shown, convective thermal plumes develop above the PDC tail and body. These low concentration plumes (less than 10−4)bring small- dimensional solid parti-cles up in the atmosphere (to 1 km height above the sea level). A fall deposition of pyroclastic fragments occurs from them (Sparks and Walker, 1977), causing the formation of vesicu-lated ash layers (Cole and Scarpati, 1993) at the end of the eruptive phase or when a gap in the emplacement of PDC occurs. The formation of thermal plumes above the body and tail does not affect the BL behaviour. Namely, a net dis-sociation exists between the PDC boundary layer, where a kinetic-collisional regime develops, and the low concentra-tion suspension that flows above, in which a pure kinetic regime holds. Indeed, the model employed and applied to the study of the PDCs dynamics shows that the high concen-tration boundary layer never outruns the upper more diluted
Fig. 6. Stratified deposits: (A) Trentaremi Tuff showing abundant
cross-stratification and sand-wave structures; (B) panoramic view of the Capodimonte Tuff, with undulating thin ash and fine lapilli layers; (C) section through the Neapolitan Yellow Tuff. Note the complex multilayered nature of this deposit; (D) sedimentary struc-tures in the AD 79 deposit in the ancient town of Pompeii. Frag-ments of tiles and walls are present in the deposit.
suspension. This has been noticed in various eruptions, such as the Neapolitan Yellow Tuff (Cole and Scarpati, 1993) and the 79 AD Vesuvius Plinian (Luongo et al., 2003).
180 s in the two cases, it follows that the associated deposit will show stratified facies in our simulations and massive fa-cies in the Dartevelle et al. (2004) simulation. Consequently, the simulations performed by using the RANS model can be best applied to the study of the dynamics of eruptive phases in which associated deposits display stratified facies. On the contrary, the simulations performed by using the LES model can be best applied to the analysis of the dynamics of erup-tive phases where associated deposits show massive facies.
5 Conclusions
Two-dimensional numerical simulations of the dynamics of fountains and associated PDCs have been performed by us-ing a granular multiphase model, with the aim of reproduc-ing the dynamics of stratified lithofacies recurrent in pyro-clastic density current deposits of both historical and prehis-torical eruptions. Pyroclastic density currents are considered as granular flows, and the GMFIX code, together with the RANS model for describing turbulence, is used to carry out numerical simulations. The analysis of the results allowed not only the description of the granular flow macroscopic dynamics, but also the depiction of sedimentation into the boundary layer and deposition from it. On a large scale, the rising mixture above the collapsing fountain, the upper part of the granular flow and thermal plumes above the pyroclas-tic current tail and body are characterized by a low concentra-tion (≤5×10⁻⁴)of solid particles. The collapsing fountain and the basal part of the density stratified pyroclastic current, instead, show a higher concentration of solid particles. From our simulations, it appears that granular flows are therefore formed by a high concentration boundary layer underlying a low concentration suspension. This structure of the flow is present from the proximal to the distal regions. On a small scale, the dynamics in the boundary layer is strongly af-fected by interactions between solid particles, whereas in the overlying low concentration suspension, the dispersion of the solid particles is controlled by the dragging of the gas phase. Significant thermal disequilibrium effects are observed be-tween gas and solid particles in the granular flow especially in the regions of effective air entrainment, as in the head of the flow. The analysis of the maximal values of solid parti-cles volumetric concentration reached in the boundary layer implies that its dynamics is tractive and suggests a connec-tion with the mechanisms leading to the formaconnec-tion of strat-ified facies. The results from our numerical simulations re-produce some of the features that lead to the stratified fa-cies observed in the field and associated with a wide range of physical conditions (e.g. magmatic and phreatomagmatic styles of Strombolian to Plinian events). A deeper knowledge of the processes investigated should be attained by the devel-opment of more detailed granular multiphase models, com-bining field-based investigation on deposits of past eruptions with modern computational fluid dynamics techniques.
Acknowledgements. The authors thank Greg Valentine (Natural Sciences Complex, University at Buffalo, Buffalo, New York, USA) for having hosted Simone Lepore in his laboratory and made available the use of the Center for Computational Research of the University at Buffalo to perform numerical simulations, and Professor Sebastian Dartevelle (Los Alamos National Laboratory, Los Alamos, New Mexico, USA) for the helpful discussions about the use of the GMFIX software. The authors thank two anonymous referees for their helpful comments and A. Longo for her editorial assistance. The final version of this manuscript has benefited from constructive review by Alison Crook.
Edited by: A. Longo
References
Benhamadouche, S. and Laurence D.: LES, coarse LES, and tran-sient RANS comparisons on the flow across a tube bundle, Int. J. Heat Fluid Fl., 24, 470–479, 2003.
Boyle, E. J., Sams, W. N., and Cho, S. M.: MFIX validation studies: December 1994 to January 1995, US Dep. of Energy, Washing-ton, D.C., 1998.
Branney, M. and Kokelaar, P.: Pyroclastic density currents and the sedimentation of ignimbrites, Geol. Soc. Mem., 27, 143 pp., 2002.
Burgisser, A. and Bergantz, G. W.: Reconciling pyroclastic flow and surge: the multiphase physics of pyroclastic density currents, Earth Planet. Sc. Lett., 202, 405–418, 2002.
Cantero, M. I., Garc´ıa, M. H., and Balachandar, S.: Effect of par-ticle inertia on the dynamics of depositional particulate density currents, Comput. Geosci., 34, 1307–1318, 2008.
Chough, S. K. and Sohn, Y. K.: Depositional mechanics and se-quence of a base surge, Songaksan tuff ring, Cheju Island, Korea, Sedimentology, 37, 1115–1135, 1990.
Cole, P. D. and Scarpati, C.: A facies interpretation of the eruption and emplacement mechanisms of the upper part of the Neapolitan Yellow Tuff, Campi Flegrei, southern Italy, Bull. Volcanol., 55, 311–326, 1993.
Cole, P. D., Perrotta, A., and Scarpati, C.: The volcanic history of the south-western part of the city of Naples, Geol. Mag., 131, 785–799, 1994.
Crowe, C. T., Troutt, T. R., and Chung J. N.: Numerical models for two-phase turbulent flows, Annu. Rev. Fluid. Mech., 28, 11–43, 1996.
Crowe, C., Sommerfeld, M., and Tsuji, Y.: Multiphase Flows With Droplets and Particles, CRC Press, Boca Raton, Fla., 1998. Dartevelle, S.: Numerical modelling of geophysical granular flows:
1. A comprehensive approach to granular rheologies and geo-physical multiphase flows, Geochem. Geophys. Geosyst., 5, 1– 28, 2004.
Dartevelle, S.: Comprehensive Approaches to Multiphase Flows in Geophysics: application to non-isothermal, non-homogenous, unsteady, large-scale, turbulent dusty clouds. I. Basic RANS and LES Navier-Stokes equations, LA-14228, Los Alamos Natl. Lab., Los Alamos, New Mexico, 51 pp., 2005.
Dartevelle, S., Rose, W. I., Stix, J., Kelfoun, K., and Vallance, J. W.: Numerical modeling of geophysical granular flows: 2. Computer Simulations of Plinian Clouds and Pyroclastic Flows and Surges, Geochem. Geophy. Geosyst., 5, 1–36, 2004.
Dobran, F., Neri, A., and Macedonio G.: Numerical simulation of collapsing volcanic columns, J. Geophys. Res., 98, 4231–4259, 1993.
Druitt, T. H.: Pyroclastic density currents, in The Physics of Explo-sive Volcanic Eruptions, edited by: Gilbert, J. S. and Sparks, R. S. J., Geol. Soc. Spec. Publ., 145, 27–50, 1998.
Fadlun, E., Verzicco, R., Orlandi, P., and Mohd-Yusof, J.: Com-bined immersed-boundary finite-difference methods for three-dimensional complex flow simulations, J. Comput. Phys., 161, 35–60, 2000.
Ferziger, J., and Peri´c, M.: Computational Methods for fluid dynam-ics, Springer, 423 pp., 2002.
Gidaspow, D.: Multiphase Flow and Fluidization: Continuum and Kinetic Theory Descriptions, Academic, San Diego, Calif., 467 pp., 1994.
Giordano, G., Porreca M., Musacchio, P., and Mattei, M: The Holocene Secche di Lazzaro phreatomagmatic succession (Stromboli, Italy): evidence of pyroclastic density current origin deduced by facies analysis and AMS flow directions, Bull. Vol-canol., 70, 1221–1236, 2008.
Guenther, C. and Syamlal, M.: The Effect of Numerical Diffusion on Isolated Bubbles in a Gas-Solid Fluidized Bed, Powder Tech-nol., 116, 142–154, 2001.
Gunn, D. J.: Transfer of heat or mass to particles in fixed and flu-idized beds, Int. J. Heat Mass Tran., 21, 467–476, 1978. Hiscott, R. N.: Loss of capacity, not competence, as the
fundamen-tal process governing deposition from turbidity currents, J. Sed. Res., 64, 209–214, 1994.
Hoffmann, K. A. and Chiang, S. T.: Computational fluid dynamics, Engineering Education System, Wichita, 2000
Kelfoun, K.: Suitability of simple rheological laws for the numerical simulation of dense pyroclastic flows and long-runout volcanic avalanches, J. Geophys. Res., 116, B08029, doi:10.1029/2010JB007622, 2011.
Lakehal, D.: On the modelling of multiphase turbulent flows for environmental and hydrodynamic applications, Int. J. Multiphas. Flow, 28, 823–863, 2002.
Leith, C. E.: Stochastic backscatter formulation for three-dimensional compressible flow, in: Large Eddy Simulation of Complex Engineering and Geophysical Flows, edited by: Galperin, B. and Orszag, S. A., Cambridge Univ. Press, New York, 105–116, 1993.
Liu, S. L. and Chow, W. K.: A review on numerical simulation of turbulent flow, Int. J. Archit. Sci., 3, 77–102, 2002.
Lowe, D. R.: Sediment gravity flow: depositional models with spe-cial reference to the deposits of high turbidity currents, J. Sed. Petrol., 52, 279–297, 1982.
Luongo, G., Perrotta, A., and Scarpati, C.: Impact of 79 AD ex-plosive eruption on Pompeii, I. Relations amongst the deposi-tional mechanisms of the pyroclastic products, the framework of the buildings and the associated destructive events, J. Volcanol. Geotherm. Res., 126, 201–223, 2003.
Macedonio, G. and Neri, A.: Fluid dynamics models of pyroclastic dispersion processes from explosive eruptions, Capricious Earth: Models and Modelling of Geologic Processes and Objects, edited
by: Glebovitsky, V. A. and Dech, V. N., Theophrastus, Athens, 101–122, 2000.
McWilliams, J. C.: The vortices of two-dimensional turbulence, J. Fluid. Mech., 219, 361–385, 1990.
Moeng, C. H.: A large eddy-simulation model for the study of plan-etary boundary-layer turbulence, J. Atmos. Sci., 41, 2052–2062, 1984.
Neri, A. and Dobran, F.: Influence of eruption parameters on the thermofluid dynamics of collapsing volcanic columns, J. Geo-phys. Res., 99, 833–857, 1994.
Neri, A. and Macedonio, G.: Numerical simulation of collapsing volcanic columns with particles of two sizes, J. Geophys. Res., 101, 8153–8174, 1996.
Neri, A., Esposti Ongaro, T., Macedonio, G., and Gidaspow, D.: Multiparticle simulation of collapsing volcanic columns and py-roclastic flow, J. Geophys. Res., 108, 1–24, 2003.
Nieuwstadt, F. T. M., Mason, P. J., Moeng, C. H., and Schumann, U.: Large eddy simulation of the convective boundary layer: a comparison of four computer codes, in: Turbulent Shear Flows 8, edited by: Durst, F., Friedrich, R., Launder, B. E., Schmidt, F. W., Schumann, U., and Whitelaw, J. H., Springer-Verlag, New York, 343–367, 1991.
Oberhuber, J. M., Herzog, M., Graf, H. F., and Schwanke, K.: Vol-canic plumes simulation on large scales, J. Volcanol. Geotherm. Res., 87, 29–53, 1998.
Odier, P., Chen, J., Rivera, M. K., and Ecke1, R. E.: Fluid Mixing in Stratified Gravity Currents: The Prandtl Mixing Length, Phys. Rev. Lett., 102, 1–4, 2009.
Ongaro, T. E., Cavazzoni, C., Erbacci, G., Neri, A., and Salvetti, M. V.: A parallel multiphase flow code for the 3D simulation of explosive volcanic eruptions, Parallel Comput., 33, 541–560, 2007.
Patankar, S.: Numerical heat transfer and fluid flow, Hemisphere Publishing Corporation, 1980.
Smagorinsky, J.: Some historical remarks of the use of nonlinear viscosities, in: Large Eddy Simulation of Complex Engineering and Geophysical Flows, edited by: Galperin, B. and Orszag, S. A., Cambridge Univ. Press, New York, 3–36, 1993.
Sparks, R. S. J. and Walker, G. P. L.: The significance of vitric-enriched air-fall ashes associated with crystal-vitric-enriched ign-imbrites, J. Volcanol. Geotherm. Res., 2, 329–341, 1977. Srivastava, A. and Sundaresan, S.: Analysis of a frictional-kinetic
model for gas-particle flow, Powder Tecnol., 129, 72–85, 2003. Suzuki, Y. J., Koyaguchi, T., Ogawa, M., and Hachisu, I.: A
nu-merical study of turbulent mixing in eruption clouds using a three-dimensional fluid dynamics model, J. Geophys. Res., 110, B08201, doi:10.1029/2004JB003460, 2005.
Syamlal, M.: MFIX documentation: Numerical technique, DOE/MC/31346-5824, DE98002029, US Dep. of Energy, Washington, D.C., 80 pp., 1998.
Syamlal, M., Rogers, W., and O’Brien, T. J.: MFIX documentation: Theory guide, DOE/METC-94/ 1004, DE9400, 097, US Dep. of Energy, Washington, D.C., 49 pp., 1993.
Valentine, G. A.: Eruption column physics, in: From Magma to Tephra, edited by: Freundt, A. and Rosi, M., Elsevier Sci., New York, 91–138, 1998.
Valentine, G. A., Wohletz, K. H., and Kieffer, S. W.: Sources of unsteady column dynamics in pyroclastic flow eruptions, J. Geo-phys. Res., 96, 887–892, 1991.
Valentine, G., Zhang, D., and Robinson, B. A.: Modelling complex, nonlinear geological processes, Annu. Rev. Earth Pl. Sc., 30, 35– 64, 2002.
Wohletz, K. H., McGetchin, T. R., Sandford, M. T., and Jones, E. M.: Hydrodynamic aspects of caldera-forming eruptions: Nu-merical models, J. Geophys. Res., 89, 8269–8285, 1984.
Woods, A. W.: The dynamics of explosive volcanic eruptions, Rev. Geophys., 33, 495–530, 1995.