https://doi.org/10.5194/se-9-735-2018
© Author(s) 2018. This work is distributed under the Creative Commons Attribution 3.0 License.
Simulating carbon sequestration using cellular automata
and land use assessment for Karaj, Iran
Ali Khatibi1, Sharareh Pourebrahim2, and Mazlin Bin Mokhtar3
1Environmental Science, Department of Environment, Faculty of Natural Resources, University of Tehran, Iran 2Department of Environment, Faculty of Natural Resources, University of Tehran, Iran
3Institute for Environment and Development (LESTARI), Universiti Kebangsaan Malaysia, UKM, The National University of Malaysia, 43600 UKM BANGI, Selangor Darul Ehsan, Malaysia Correspondence:Sharareh Pourebrahim ([email protected])
Received: 20 February 2017 – Discussion started: 10 March 2017
Revised: 14 March 2018 – Accepted: 26 April 2018 – Published: 11 June 2018
Abstract. Carbon sequestration has been proposed as a means of slowing the atmospheric and marine accumulation of greenhouse gases. This study used observed and simulated land use/cover changes to investigate and predict carbon se-questration rates in the city of Karaj. Karaj, a metropolis of Iran, has undergone rapid population expansion and associ-ated changes in recent years, and these changes make it suit-able for use as a case study for rapidly expanding urban areas. In particular, high quality agricultural space, green space and gardens have rapidly transformed into industrial, residential and urban service areas. Five classes of land use/cover (resi-dential, agricultural, rangeland, forest and barren areas) were considered in the study; vegetation and soil samples were taken from 20 randomly selected locations. The level of car-bon sequestration was determined for the vegetation samples by calculating the amount of organic carbon present using the dry plant weight method, and for soil samples by using the method of Walkley and Black. For each area class, average values of carbon sequestration in vegetation and soil sam-ples were calculated to give a “carbon sequestration index”. A cellular automata approach was used to simulate changes in the classes. Finally, the carbon sequestration indices were combined with simulation results to calculate changes in car-bon sequestration for each class. It is predicted that, in the 15 year period from 2014 to 2029, much agricultural land will be transformed into residential land, resulting in a se-vere reduction in the level of carbon sequestration. Results from this study indicate that expansion of forest areas in ur-ban counties would be an effective means of increasing the levels of carbon sequestration. Finally, future opportunities
to include carbon sequestration into the simulation of land use/cover changes are outlined.
1 Introduction
Carbon sequestration is defined as the process of removing carbon from the atmosphere and depositing it in a carbon reservoir (UNFCC, 2015). Soil carbon sequestration is the process of storing carbon in soil, sometimes for thousands of years. When carbon is removed from the atmosphere and stored in the soil as organic carbon, its contribution to global warming is reduced. Plants absorb carbon from the atmo-sphere through photosynthesis and they release carbon to the atmosphere through respiration. Any carbon that is stored in plant tissue is either consumed by animals or, after the plant dies, it enters the soil as decomposed organic matter. Soil or-ganic matter is a complex mixture of carbon-containing ma-terials that include decomposed plant and animal tissues, mi-crobes (protozoa, nematodes, fungi and bacteria) and carbon-containing minerals. Factors such as climate, natural vege-tation, soil texture and drainage all influence the level and duration of soil carbon sequestration (Schlesinger, 1984).
burn-Because the majority of carbon is sequestered in soil, or-ganic carbon that is contained in soil plays an important role in the overall sequestration process. The amount of carbon that is sequestered in soil changes significantly according to location, topography, bedrock or vegetation type and previ-ous management approaches (Schoonover and Crim, 2015). Furthermore, the amount of carbon found in the roots, litter and biomass of microorganisms in the soil varies according to the time of year due to growing season effects and time re-quired for biomass decomposition. Erosion, compaction and reduction of soil permeability, loss of soil structure, miner-alization and oxidation of humic substances all contribute to reducing the amount of organic matter in soil (Bruce et al., 1999). Although the amount and rate of carbon sequestra-tion is higher in mild and humid tropical forest ecosystems, the high level of plant respiration that is associated with high humidity and temperature results in a fast release of carbon dioxide back into the atmosphere so that, on balance, the net carbon storage is reduced. Therefore, arid and semi-arid re-gions are considered to be the most desirable locations for carbon sequestration (Lal, 2008). Indeed, international orga-nizations, such as FAO and UNDP, have chosen to implement programs of carbon sequestration in arid and semi-arid re-gions in an effort to reduce levels of greenhouse gases (Ghan-bari, 2014).
Changes to land use are a major driver of carbon storage in the terrestrial ecosystem (Chuai et al., 2013). Cellular au-tomata are often used to simulate spatial changes in land use. A cellular automaton is a system that contains a finite num-ber of cells that are located next to each other in a regular and continuous grid which takes the form of a raster (Kwadwo Nti, 2013). When used to model land use, the cells are clas-sified into multiple grid classes according to land use type. This classification includes sorting the cells in groups of cells based on the relationships that exist between them (Sokal, 1974; Anderson et al., 1976; Gregorio and Jansen, 2005). Changes in land use/cover are caused either by natural fac-tors or human intervention. Although human intervention is a long time historical factor in changes to land use/cover, the current rate of change is much higher now than in the past, and this is causing many changes in the environment and
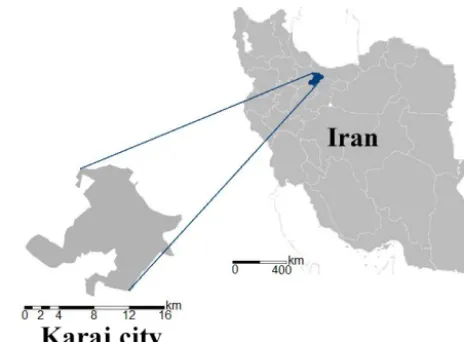
eco-Figure 1.The location of the city of Karaj in Iran.
logical processes at the local, regional and international lev-els. Monitoring and modeling regional land use helps to pre-dict future consequences of changes in land use/cover, so that resources can be adequately protected ( ¸Satır and Berbero˘glu, 2012).
This study investigates if and/or how changes in land use/cover affect carbon sequestration, which we will regard as an ecosystem service, over time. Furthermore, this study will ascertain if cellular automata are an appropriate simula-tion method for predicting the levels of carbon sequestrasimula-tion. Specifically, we use cellular automata to simulate different classes of land use/cover.
2 Materials and method 2.1 Study area
The Iranian city of Karaj, located in the region 35.42◦N, 50.50◦E to 35.53◦N, 51. 03◦E (Fig. 1), was selected as the study area.
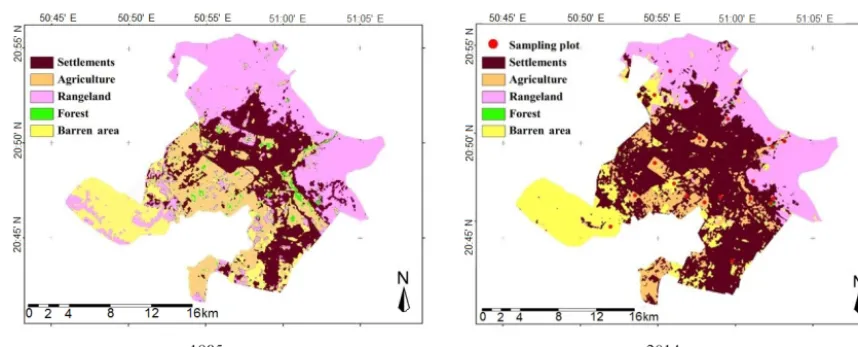
Figure 2.Land use/cover classes in 1985 and 2014.
2.2 Simulation of land use/cover changes
Satellite images were obtained from Landsat TM and ETM+ sensors during the period from 1985 to 2014, and land use/cover changes were simulated using the Dinamica EGO 2.4.1 software. Prior to use in the simulations, all data were preprocessed in other applications such as ArcGIS 10.2, ENVI 4.7 and IDRISI Taiga, and all images were checked (number of rows and columns, geographic coordinate sys-tem and overlapping border areas), reviewed and modified as needed (Makhdoom et al., 2001). For the cellular automata simulation, the main simulation parameter was the proba-bility of a change in class for each cell. Probaproba-bility values were calculated using the Markov chain method (Soares-filho et al., 2012). The probability of a cell’s class chang-ing was then used as the rule for a cellular automata, givchang-ing a probability map that shows the most probable status for land use/cover classes after a specific period of time. Markov chain probabilities can be improved by adding other auxiliary relations into the cellular automata rule. These auxiliary rela-tions come from regression analysis between land use/cover changes and arbitrary variables such as depth of soil, slope, aspect and distance to rivers and water bodies.
In this study we considered five land use/cover classes: (i) residential, (ii) agricultural, (iii) rangeland, (iv) forest and (v) barren areas. In addition, following auxiliary variables were used: (i) slope, (ii) aspect, (iii) elevation, (iv) distance to rivers and other water bodies, (v) distance to roads, (vi) depth of soil, (vii) salinity of soil, (viii) soil texture and (ix) dis-tance to each other land use/cover class. Before running the simulation based on the proposed model, all the proposed variables were examined for effectiveness on the model; all ineffective variables were removed from the model sepa-rately for each transition. The transition matrix was then de-termined using the Markov chain model. The cellular au-tomata model, which took the initial land use/cover maps as its input, and which used transition matrix as its main rule,
was used to simulate land use/cover over a specific period of time. The initial simulation, which was used to validate the model, was performed for the period from 1985 to 2014. A simulation was then performed for the period from 2014 to 2029 to predict the future status of land use/cover classes (Soares-filho et al., 2009; Kwadwo Nti, 2013).
The Dinamica EGO software considers many types of em-bedded models and it enabled us to introduce data to our model, including land use/cover maps and auxiliary vari-ables. We executed the model for a specified time period and stored the results as maps. The Dinamica EGO soft-ware incorporates a number of map comparison tools; we used the “fuzzy reciprocal similarity tool”, which locates a window of odd dimensions at the same coordinates on two different maps. Proportional to the relative window sizes, a minimum similarity was calculated using the fuzzy recipro-cal similarity method. Briefly, this method uses an enhanced kappa accuracy method which is suitable for circumstances where “small patches” cannot be “moved around” the area under investigation. In our study, we used this tool to com-pare the predicted and observed maps in order to validate the proposed model. The size of the moving window was var-ied from 1 to 33 (arbitrary units). The square window, with unity area, had a side length of 30 m and a land area that is equivalent to a square window with an area of 33 and a side length of over 990 m on Earth (Soares-filho et al., 2009, 2012; Kwadwo Nti, 2013).
2.3 Sampling and calculation of carbon sequestration index per land use/cover class
The most probable class transition
Class Probability Class
Residential 0.0094 Rangeland Agriculture 0.0520 Rangeland Rangeland 0.0307 Barren area Forest 0.1122 Agriculture Barren area 0.0604 Residential
Table 3.Minimum similarities between observed and simulated re-sults for the year 2014.
Area (m2) Minimum similarity
900 0.30
4500 0.41
8100 0.50
15 300 0.61
26 100 0.70
(Allison, 1965). Plant sampling was usually performed when plants were in their dormant growth season; thus, the plant species that was dominant in the sampling area determined the time of year at which the sample was taken (Karimian, 2009). For samples that were dominated by grass and shrub cover, above-ground and below-ground biomasses were sam-pled separately. Direct measurements were taken of above-ground biomass by cutting samples and drying them in the laboratory. The dried samples were weighed and the plant ba-sis weight per unit area calculated; weight of above-ground biomass and total biomass per hectare were thereby esti-mated (Mesdaghi, 2001).
The sampling points were made up of plots with spe-cific dimensions (1 m2). Plant litter from each plot was col-lected as part of the above-ground biomass. Plant litter sam-ples were transported to the laboratory and, after being fully dried, the dry weight of each sample was recorded and the to-tal mass of plant litter per square meter was determined. The below-ground biomass of the sampled species was also
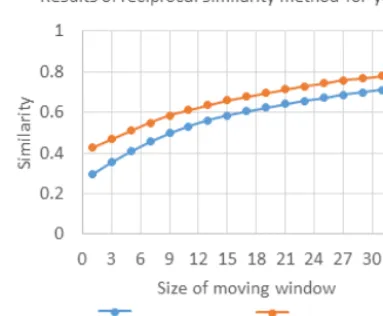
sam-Figure 3.Maximum and minimum similarities between simulated and observed maps for the year 2014.
pled, usually in 30×30×30 cm samples. For each sampling point, roots were collected, dried and weighed, so that the root mass per unit area could be calculated. In forest cover, only trees with trunks of at least 10 cm diameter were se-lected for sampling in order to avoid damaging very young trees. In order to determine the biomass of standing trees, plots of different sizes were used depending on forest density and homogeneity. To do this, plots were randomly selected within forest areas and the number of each tree species was counted. We measured the tree diameter at 1.5 m height in or-der to determine the tree volume. To determine the bulk tree density, tree branches with specific dimensions were cut, and their dry weight and volume was measured; bulk tree den-sity was determined by dividing weight by volume. Then, by multiplying the volume of trees with the calculated bulk density, biomass weight per unit area was determined. The method was used for sampling forest litter was similar to the method used for herbaceous plants and shrubs (Karim-ian, 2009).
Table 4.Changes of land use/cover in the period from 1985 to 2014 (in hectares).
Year/Class Residential Agricultural Rangeland Forest Barren area
1985 7534.53 7289.37 17 138.61 1412.37 2202.75
2000 9267.21 7201.98 13 968.36 531.81 4608.27
2014 16 002.54 3632.85 9433.98 89.37 6418.89
Change direction Increasing Decreasing Decreasing Decreasing Increasing
Figure 4.Predicted land use/cover classes in different years.
most prevalent and where the majority of the plant roots that were growing were formed. Samples of approximately 1 kg weight were sent to the laboratory for analysis. Sampling in forest areas was also usually carried out in the first 30 cm of soil, in 30×30×30 cm (or until bedrock was reached) samples; soil was sampled both under trees and in the spaces between trees (Mahdavi et al., 2007). In other land use/cover classes, such as barren areas, only soil samples were taken.
Samples of shoots, below-ground plants and plant litter were dried in the open air for several weeks and then their dry weight were determined (Karimian, 2009). Wet samples were dried in an oven at 72◦C for 48 h and the dry weight of each sample was calculated (Gholami, 2008). The weight of organic carbon stored in samples was determined using the combustion method (McDicken, 1997). Samples were ground to a powder and 2 g of each sample was placed in an electric furnace at 550◦C for 5 h (Ghanbari, 2014). Af-ter weighing the combustion ashes, the difference between initial weight and weight of the ashes revealed the amount of organic matter in the sample. The weight of organic carbon is calculated using Eq. (1), where OC is the weight of organic carbon and OM is the weight of organic matter (Birdsey et al., 2000):
OC= 1
2OM. (1)
Soil samples were dried in the open air, ground and sieved using a 2 mm mesh. The amount of organic matter and or-ganic carbon in the soil samples was determined according to the soil analysis methods of Walkley and Black (Allison, 1965). Specifically, the amount of soil organic matter was
determined by measuring the amount of oxide-able organic matter in the soil; after determining the percentage of ganic carbon, the amount of soil organic matter and soil or-ganic carbon was calculated by using the Walkley and Black method, and an Erlenmeyer flask (Haghighi, 2003). The per-centage of soil organic matter is calculated by Eq. (2): %OM= (V2−V1)×N×0.39
S , (2)
whereV1 is the volume of ferrous ammonium sulfate used for the control sample (in mL),V2is the volume of ferrous ammonium sulfate used for the sample (in mL),Nis the nor-mality of ferrous ammonium sulfate,Sis the weight of dried soil sample in the open air and OM is percentage of organic material in the soil sample. Equation (3) gives the percent-age of organic matter expressed as the percentpercent-age of organic carbon (Haghighi, 2003):
%OC= %OM
1.724, (3)
where OC is the organic carbon content. Finally, Eq. (4) gives the organic carbon content of the soil, in kilograms per hectare (Haghighi, 2003):
OC=10 000×%OC×Bd×E, (4)
where Bd is the soil sample density in gram per cubic cen-timeter, andEis the sampling depth in cm.
2.4 Modeling of carbon sequestration changes
(t ha−1)
Agriculture 1178 310.9
Rangeland 686 178.8
Forest 675 172.5
Barren area 92 22.16
Table 7. Carbon sequestration in vegetation per land use/cover class, using dry plant weight method.
Land use/cover class Mean carbon MSE sequestration in vegetation (t ha−1)
Agriculture 28 3.7
Rangeland 14 2.1
Forest 94 15.7
area and combining it with the results of the land use/cover change simulation, the rate of carbon sequestration and its variations in accordance with the land use/cover changes was simulated in the future. Thus, if the sampling region has n
land use/cover classes, and each class hasCicells, each class
hasCSi carbon sequestration; if the area of each cell on the
ground isS(in hectares), as determined by the cell size of the satellite image, then the total amount of carbon sequestration in the study area can be calculated using Eq. (5):
CST=
n X
i=1
CSi×Ci×S
. (5)
In the above equation for eachi=1,2, . . ., n, part of(CSi× Ci×S) gives the amount of carbon sequestration in theith
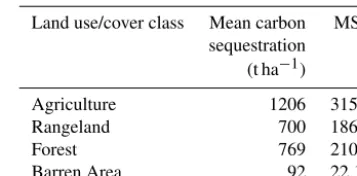
class, in hectares. The amount of carbon sequestration of each class includes amount of carbon sequestration of vege-tation shoots, underground organs, all of the vegevege-tation cover, soil and the average for the land use/cover class.
Agriculture 1206 315.5
Rangeland 700 186.6
Forest 769 210.6
Barren Area 92 22.16
3 Results and discussion
3.1 Simulation of land use/cover changes
By using the Dinamica EGO software, a cellular model was run for a 29-year period, starting from 1985, to obtain a sim-ulated result for the year 2014. In order to simulate changes in land use/cover classes, the transition matrix between two land use/cover maps between the years 1985 and 2014 was calculated, based on the Markov chain method. By introduc-ing auxiliary variables to the model, the correlation between them and land use/cover classes was calculated using the re-gression method; one of two correlated variables, or the vari-ables that did not have any impact on the transition matrix, were excluded from the model. Table 1 details the final ef-fective variables. The final probability matrix was then recal-culated (Table 2).
As explained in the material and methods section, mini-mum similarity between observed and simulated result was determined using the fuzzy reciprocal similarity method for the same area regions in order to validate the model (Table 3 and Fig. 3).
The results of simulated land use/cover classes for changes of land use/cover in the period from 1985 to 2014 are shown in Table 4.
Finally, land use/cover classes were simulated for a period of 15 years, from 2014 to 2029. Selected simulation results are presented in Fig. 4 and Table 5.
3.2 Sampling and carbon sequestration index calculations
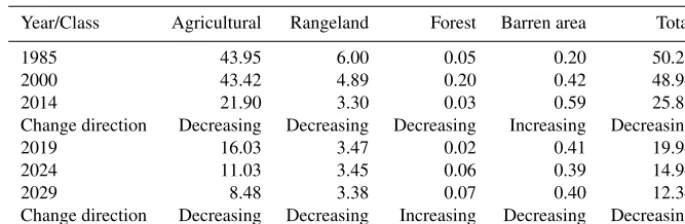
Table 9.Simulated carbon sequestration of the study area from 2014 to 2029 (millions of tons).
Year/Class Agricultural Rangeland Forest Barren area Total
1985 43.95 6.00 0.05 0.20 50.21
2000 43.42 4.89 0.20 0.42 48.94
2014 21.90 3.30 0.03 0.59 25.83
Change direction Decreasing Decreasing Decreasing Increasing Decreasing
2019 16.03 3.47 0.02 0.41 19.94
2024 11.03 3.45 0.06 0.39 14.94
2029 8.48 3.38 0.07 0.40 12.34
Change direction Decreasing Decreasing Increasing Decreasing Decreasing
taken at each point in order to measure the level of carbon sequestration. Using the method of Walkley and Black, the amount of sequestered carbon was calculated to provide an index of soil carbon sequestration of the soil (see Table 6 for results).
Following the soil experiments, carbon sequestrations of plant samples were measured and, according to the average volume of plants in each plot, the levels of carbon seques-tration of plants per plot (and per hectare) were calculated. After the calculation for each sample in same the class by using plant dry weight method, mean values were calculated for each land use/cover class; the mean values were intro-duced as an index of the average carbon sequestration in vegetation of that class (Table 7). There were different types of vegetation within the overall study area. For example, in agricultural areas most of plants were alfalfa and potatoes. In rangeland areas, most samples included sagebrush, and in the forest areas, plane tree and cedar were the most commonly sampled.
The mean soil and vegetation index values for each land use/cover class (Tables 6 and 7) were combined to give a total index for each class (Table 8).
3.3 Simulation of carbon sequestration changes
Carbon sequestration changes based on the changes of the land use/cover classes in the study area were predicted by inserting the carbon sequestration indices and results of land use/cover simulation into Eq. (5) (Table 9).
3.4 Discussion
By measuring the direction of change of land use/cover, we are able to better understand a range of important phenom-ena and make important predictions into the future (Webster, 2002); therefore this work is invaluable for future environ-mental planning. In this study, which was based in the city of Karaj, Iran, we determined, in the laboratory, two sepa-rate indices of carbon sequestration for soil and vegetation for five land use/cover classes. We simulated the changes in those classes by using satellite images of Landsat TM and ETM+ sensors during the period from 1985 to 2014, and
by using the method of cellular automata. Our simulations determined that, in the study period (1985 to 2014), residen-tial and barren areas underwent an annual size increase of approximately 2.63 and 3.76 %, respectively, and that agri-cultural, forest and rangeland areas decreased annually by approximately 2.37, 9.08 and 2.04 %, respectively. By com-paring the results of observed data from 1985 to 2014 with simulated data from 2014 to 2029 we predict that the rate of land use change in the period from 2014 to 2029 will be slower than that observed in the period from 1985 to 2014. According to our simulations, residential space will increase in area by approximately 10 %, agricultural land will reduce by 5 %, forests will increase slightly by approximately 0.3 %, barren areas will reduce by approximately 6 % and rangeland will remain almost constant, with only slight fluctuations in area. Finally, the results suggest that the city of Karaj will ex-perience a reduction in its levels of carbon sequestration due to the impingement of residential areas, which do not con-tribute to carbon sequestration, into other land use classes. In this study we used a reciprocal fuzzy method to validate the proposed model by comparing observed and simulated land use/cover maps from 2014. Our results show that observed and simulated results will converge over a 15 year period as the size of the compared areas increases. More specifi-cally, simulated results will converge with observed data for regions with an area of at least 900 m2 with a probability of > 30 %, and for regions with an area of 26 100 m2 with a probability of > 70 %. Sheng et al. (2012), Soares-fihlo et al. (2012, 2013) and Kwadwo Nti (2013) also used cellu-lar automata and Markov chain with fuzzy analysis methods to simulate and validate predicted changes in land use/cover use; this further validates the results of the present study.
Jantz et al., 2010; Kwadwo Nti, 2013; White and Engelen, 1993, 1997; Deadman et al., 1993; Itami, 1994; White, 1998; Li and Yeh, 2002; Barredo et al., 2003, 2004; Al-Ahmadi et al., 2008). Furthermore, the results of this study agree with the findings of Soares-filho et al. (2012), who used cellular automata and Markov chain tools with Dinamica EGO soft-ware to study carbon sequestration in agricultural land and forests in Brazil.
It is important to note that the results of this study are specific to urban areas, and that they can, therefore, be ap-plied to urban growth over time. For our study area, as de-tailed in Tables 4 and 5, some land use/cover classes, such as agricultural, decrease in size due to increases in residen-tial requirements. Thus, our results cannot be extrapolated to all landscape types beyond urban. Furthermore, it is impor-tant to note that the results of our study indicate that the use of fertilizers resulted in levels of carbon sequestration that were elevated in agricultural areas compared to forest areas. We decided to include data from soil that had been fertil-ized because (i) the traditional fertilization methods used by the farmers meant that the amount of fertilizer used was not recorded and (ii) agricultural land forms a significant part of carbon sequestration capacity and, therefore, should not be excluded from the study.
4 Conclusions
Our results indicate a number of opportunities to include car-bon sequestration in simulations of land use change in fast growing cities; the methods used in this study can be ap-plied elsewhere as an “ecosystem service” for urban plan-ning based on land use changes. Based on our results, which demonstrate rapid changes in residential areas, we recom-mend that city managers take effective measures to increase residential green spaces which are planted with appropriate plant species. We also recommend that comparative studies are performed to confirm that our methods can be used else-where; these studies should ascertain whether the results are affected by variables that were not possible to isolate in the
of interest.
Acknowledgements. We acknowledge the University of Tehran and the National University Malaysia (UKM) for their provision of resources and collaborative efforts. This research was supported by grant numbers 7314850/1/1 and 952/5/298 from University of Tehran and grant numbers GP-K005248, UKM: XX-11-2012, AP-2015-012 and KRA-2017-022 from UKM, Malaysia.
Edited by: Martine van der Ploeg Reviewed by: two anonymous referees
References
Al-Ahmadi, K., See, L., Heppenstall, A., and Hogg, J.: Calibration of a fuzzy cellular automata model of residential dynamics in Saudi Arabia, Ecol. Complex., 6, 80–101, 2008.
Al-Ghamdi, K. A.: Modeling Spatial Dynamics Changes with Cel-lular Automata, The 7th National GIS Symposium 29 April–1 May, 1–7, 2012.
Allison, L. E.: Organic Carbon, in: Methods of Soil Analysis, Part 2, Chemical and Microbiological Properties, edited by: Black, C. A., Evans, D. D., White, J. L., Ensminger, L. E., and Clark, F. E., Madison: American Society of Agronomy, p. 1367, 1965. Anderson, R. J., Hardy, E. E., Roach, J. T., and Witmer, R. E.: A
Land Use and Land Cover Classification System for Use with Remote Sensor Data, Washington, 964 pp., 1976.
Barredo, J. I., Kasanko, N., McCormick, M., and Lavalle, C.: Mod-elling dynamic spatial process: simulation of residential future scenarios through cellular automata, Landscape and Residential Planning, 64, 145–160, 2003.
Barredo, J. I., Demicheli, L., Lavalle, C., Kasanko, M., and Mc-Cormick, N.: Modelling future residential scenarios in develop-ing countries: an application case study in Lagos, Nigeria, Envi-ron. Plann. B, 31, 65–84, 2004.
Birdsey, R., Heath, I., and Williams, D.: Estimation of Carbon Bud-get Model of the United State Forest Sector, North Carolina, Ad-vances in Terrestrial Ecosystem Carbon Inventory, Measurement, and Monitoring Conference in Raleigh, 3–5, 2000.
Chuai, X. W., Huang, X. J., and Wang, G. B.: NDVI, tem-perature and precipitation changes and their relationships with different vegetation types during 1998–2007 in In-ner Mongolia, China, Int. J. Climatol., 33, 1696–1706, https://doi.org/10.1002/joc.3543, 2013.
Deadman, P., Brown, R. D., and Gimblett, H. R.: Modelling Rural Residential Settlement Patterns with Cellular Automata, J. Envi-ron. Manage., 37, 147–160, 1993.
Ferreiro, J. P., Cepeda, C. T., Leiros, M. C., Seoane, S., and Sotres, F. G.: Effect of Management and Climate on Biochemical Prop-erties of Grassland Soils from Galicia (NW Spain), J. Soil Biol., 46, 136–143, 2010.
Forge, F.: Carbon sequestration by agricultural soil, Science and Technology Division, Library of parliament, Parlia-mentary Information and Research Service, Parliament of Canada, available at: https://lop.parl.ca/Content/LOP/ ResearchPublicationsArchive/bp1000/prb0038-e.asp (last access: 10 February 2017), 2001.
Ghanbari, N.: Investigating of Impacts of Land use Change from Rangeland to Forest on Soil Carbon Sequestration (Case Study: Sanandaj city), MSc thesis, faculty of natural resources, Univer-sity of Tehran, Iran, 105 pp., 2014.
Gholami, H.: Investigating and Comprising of Carbon Sequestra-tion between Atriplex canescence and Hulthemia persica, MSc thesis, faculty of natural resources, University of Tehran, Iran, 82 pp., 2008.
Gregorio, A. D. and Jansen, L. J.: 2005. Land Cover Clas-sification System: ClasClas-sification concepts and use man-ual, available at: http://www.fao.org/gtos/doc/ECVs/T09/ ECV-T9-landcover-ref25-LCCS.pdf (last access: 7 January 2015), 2005.
Guan, Q. and Clarke, K. C.: A general-purpose parallel raster pro-cessing programming library test application using a geographic cellular automata model, Int. J. Geogr. Inf. Sci., 24, 695–722, 2010.
Haghighi, M. J.: Methods of Soil Analysis, Nedaye Zoha Publica-tion, Tehran, Iran, 450 pp., 2003.
Hodrien, C.:. Squaring the Circle on Coal-Carbon Capture and Stor-age (CCS), Calverton Energy Conference, Bath, 2008.
Itami, R. M.: Simulating spatial dynamics: cellular automata theory, Landscape and Residential Planning, 30, 27–47, 1994.
Jantz, C., Goetz, S. J., Donato, D., and Claggett, P.: Designing and implementing a regional residential modeling system using the SLEUTH cellular residential model, Computers, Environment and Residential Systems, 34, 1–16, 2010.
Karimian, Z. R.: Comparison of Carbon Sequestration in Grassland and Shrubbery Area (Case Study: Shahriar), MSc thesis, faculty of natural resources, University of Tehran, Iran, 89 pp., 2009. Kwadwo Nti, I.: Geospatial Process Modelling for Land Use Cover
Change, PhD thesis, Auckland University of Technology, Auk-land, 216 pp., 2013.
Lal, R.: The Role of Soil Organic Matter in the Global Carbon Cy-cle, J. Soil Environ. Pollut., 116, 353–360, 2008.
Li, X. and Yeh, A. G.: Neural-network-based cellular automata for simulating multiple land use changes using GIS, Int. J. Geogr. Inf. Sci., 16, 323–343, 2002.
Makhdoom, M., Darvishsefat, A. A., Jafarzadeh, H., and Makhdoom, A.: Environmental assessment and planning by us-ing GIS, University of Tehran press, Tehran, Iran, 304 pp., 2001. Mahdavi, S. K., Mokhtari Asl, A., and Mahdavi, F.: Role of range-land in Carbon Sequestration, Journal of Forest and Rangerange-land, 79–80, 24–31, 2007.
McDicken, K. G.: A Guide to monitoring Carbon Storage in Af-forestation and Agro-afAf-forestation Projects, Winrock Interna-tional Arlington, VA, USA, 90 pp., 1997.
Mesdaghi, M.: Rangeland Management in Iran, 4 Edn. Astan Ghods Razavi Press, Mashhad, Iran, 760 pp., 2001.
¸Satır, O. and Berbero˘glu, S.: Land Use/Cover Classification Tech-niques Using Optical Remotely Sensed Data in Landscape Plan-ning, in: Landscape PlanPlan-ning, InTech, Shanghai, China, 21–55, 2012.
Schlesinger, W. H.: Soil Organic Matter a Source of Atmospheric CO2, in: the role of terrestrial vegetation in the global carbon cycle, edited by: Woodwell, G. M., John Wiley & Sons, New York, USA, 11–127, 1984.
Schoonover, J. E. and Crim, J. F.: An Introduction to Soil Con-cepts and the Role of Soils in Watershed Management, Jour-nal of Contemporary Water Research & Education, 154, 21–47, https://doi.org/10.1111/j.1936-704X.2015.03186.x, 2015. Sheng, J., Qing, G., Chun-yu, W., Bei, L., Xiao-dong, L.,
Guang-ming, Z., Zhong-xing, Y., and Jie, L.: Ecological suitability evaluation for residential growth boundary in red soil hilly ar-eas based on fuzzy theory, Journal of Central South University, Springer, 19, 1364–1369, 2012.
Soares-filho, B., Rodrigues, H., Costa, W., and Schlesinger, P.: Modeling Environmental Dynamics with DINAMICA EGO, Belo Horizonte, Brazil, 116 pp., 2009.
Soares-filho, B., Lima, L., Bowman, M., and Viana, L.: Challenges for Low-Carbon Agriculture and Forest Conservation in Chal-lenges for Low-Carbon Agriculture and Forest Conservation in Brazil, Inter-American Development Bank, 40 pp., 2012. Soares-Filho, B., Rodrigues, H., and Follador, M.: A hybrid
analytical-heuristic method for calibrating land-use change mod-els, Environ. Modell. Softw., 43, 80–87, 2013.
Sokal, R. R.: Classification: Purposes, Principles, Progress, Prospects, Science, 185, 1115–1123, 1974.
Strategic Plan and Structural Design of Karaj City (SPSDKC): Organization of Housing and Urban Development of Tehran Province, Department of Housing and Urban Development, 194 pp., 2012.
United Nations Framework Convention on Climate Change (UNFCCC): United Nations Climate Change, available at: http://unfccc.int/resource/cd_roms/na1/ghg_inventories/english/ 8_glossary/Glossary.htm, last access: 5 January 2015.
Webster, R. and Payne, R. W.: Analysing repeated measurements in soil monitoring and experimentation, Eur. J. Soil Sci., 53, 1–13, https://doi.org/10.1046/j.1365-2389.2002.00408.x, 2002. White, R.: Cities and cellular automata, Discrete Dynamics in
Na-ture and Society, 2, 111–125, 1998.